Today’s Bounce Play is strong…However with the Indexes at resistance it is too soon to judge if the Bulls can maintain the Rally. Bears are still in control for now:
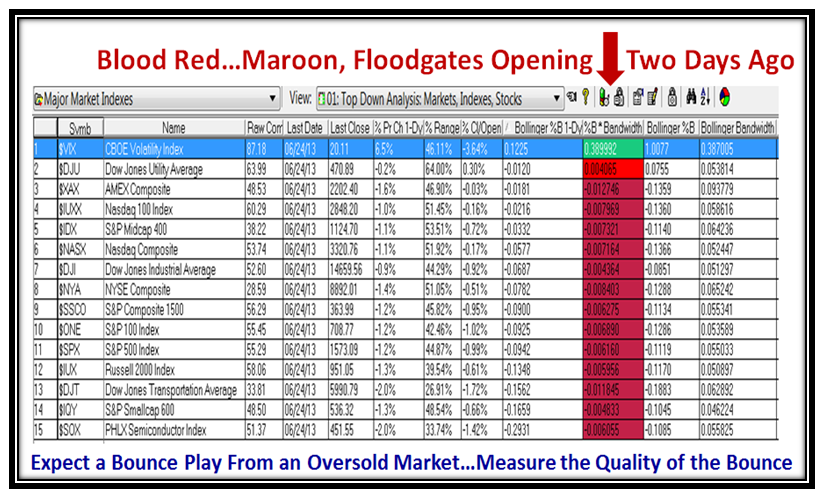
So let’s review the bidding for Past, Present and Future, starting with two days ago which looked very ugly:
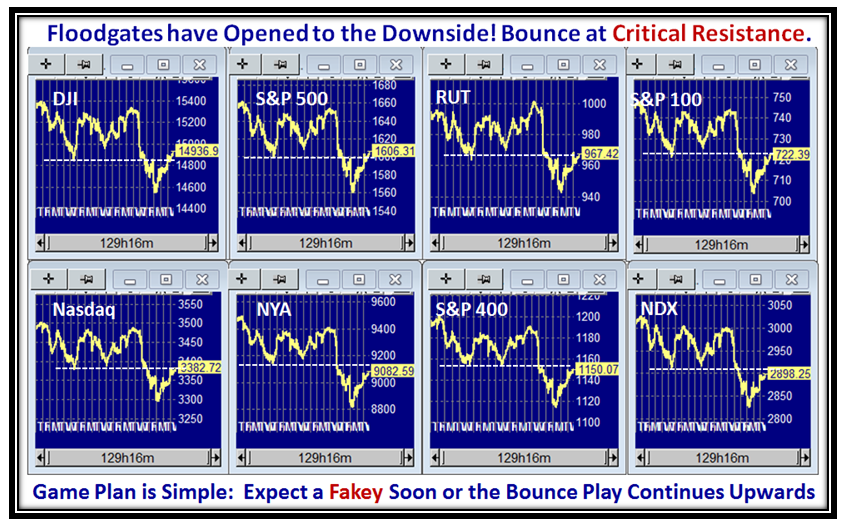
Present: With half an hour to go, this is a Strong Bounce Play, but as we can see the Indexes are now at Critical Resistance:
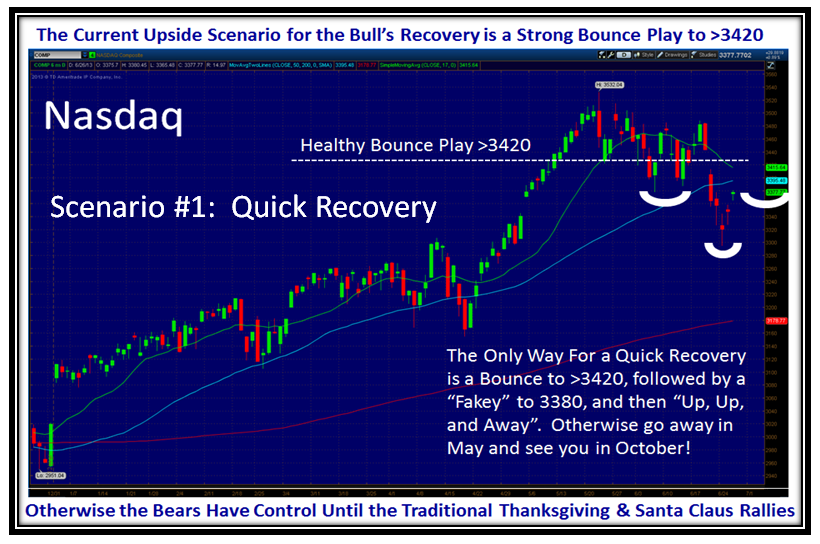
Future: Scenario #1: Quick Recovery…the expected plan is shown below as a follow up to my previous note to Paul Reiche in the Comments Section of “Scary Ride to Come or Up, Up, and Away?”
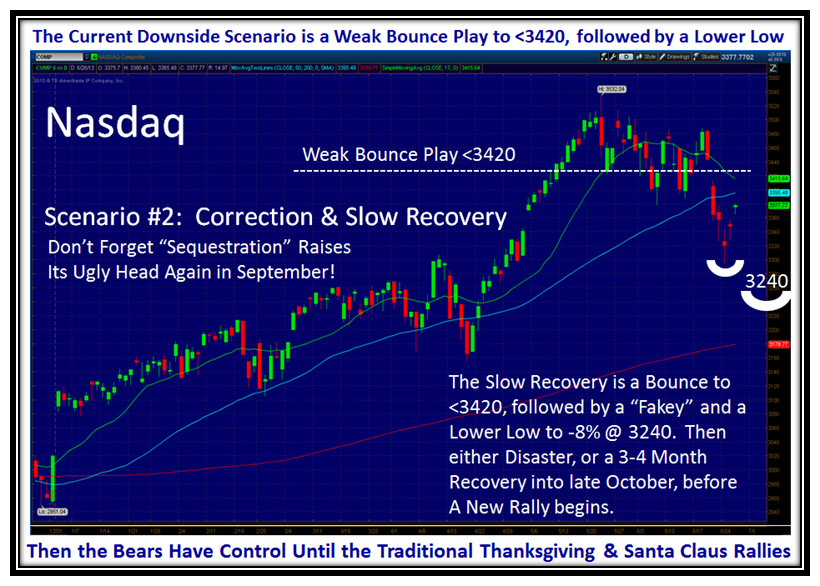
Future: Scenario #2: Correction & Slow Recovery…Bears maintain control until October or later with more to the downside. Key Support will be at -8% down from the high…if broken we will have a Major Correction on our hands:
Caution: Never fall in love with one Scenario. Let the Market guide you, but it is always worthwhile to have “What If Scenarios” so that you can judge and recognize what the Market is telling you. Then let your stomach be your guide as to whether you play or not. News is always an overriding factor in all of this and you need to be on your toes, and don’t forget the big one hanging over our heads is the delayed action on Sequestration due now in September!
Best Regards,
Ian.
Posted in HGS Principles, Market Analysis | Comments Off on Stock Market: Decent Bounce Play, but Still Favors the Bears
The Market Indexes have dropped on average 5.6% from their Highs posted on 5/22/2013, and the $64 question is “Are we in for a Scary Ride downwards or is this just a Minor Correction before we move up again?”
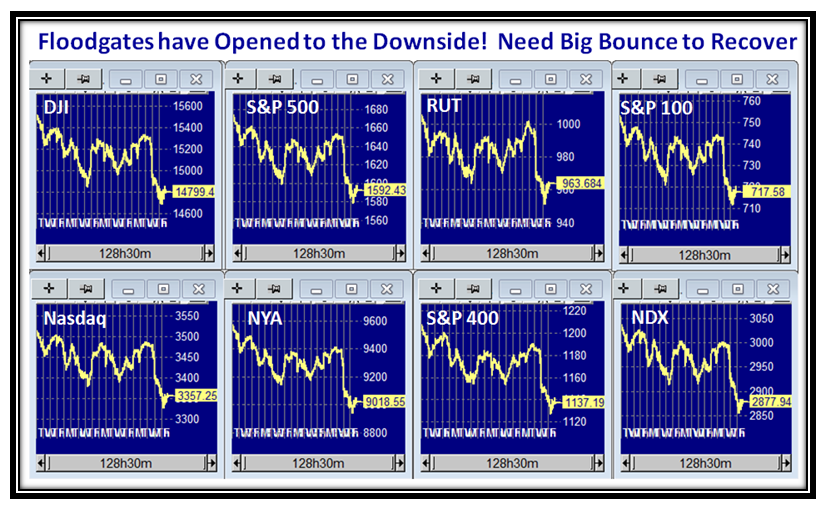
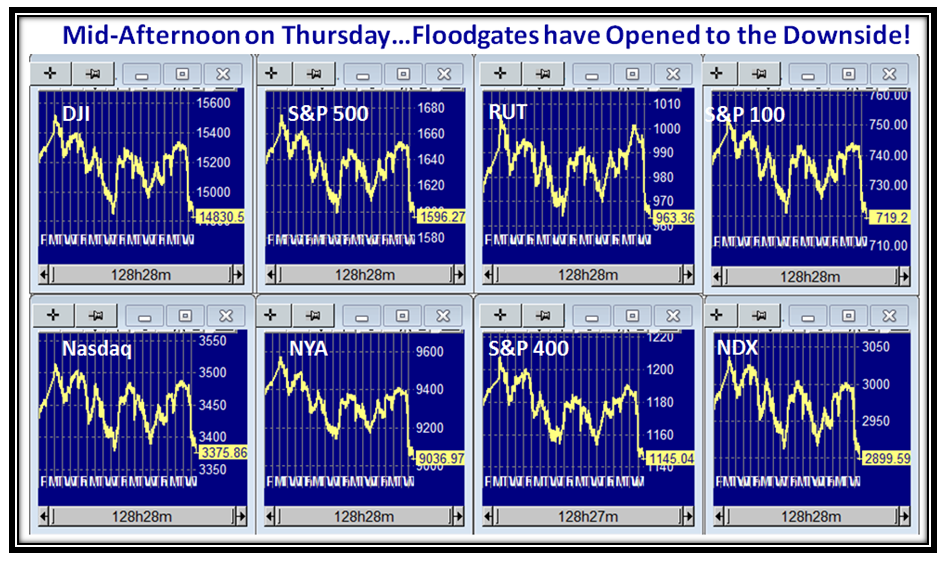
As we would expect, the Floodgates have opened to the downside and recent support has been broken on all Indexes:
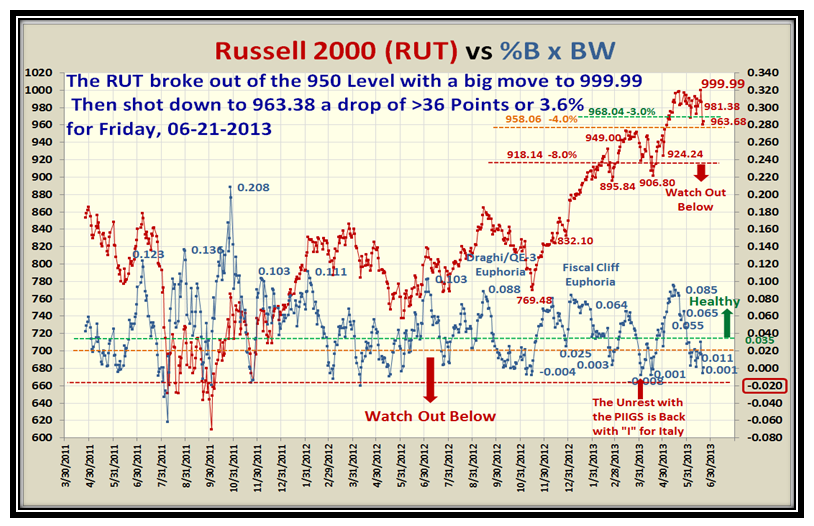
The Russell 2000 (RUT) took a hit but is still holding above 4% from its High:
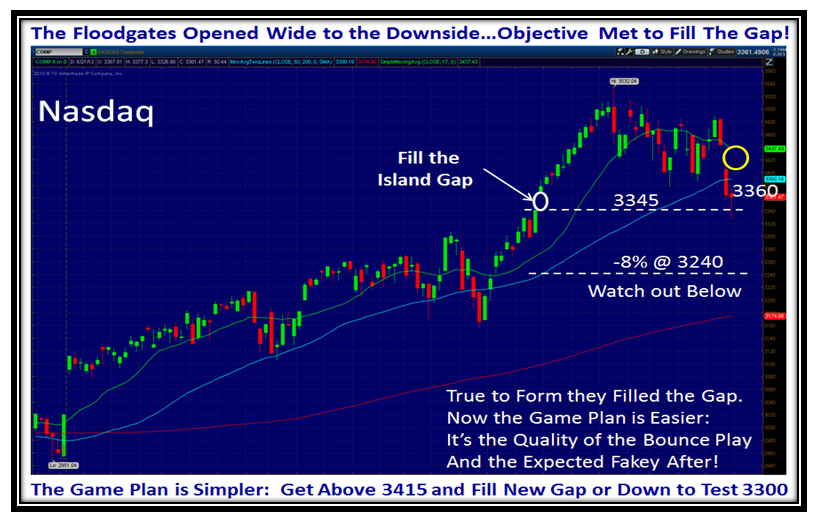
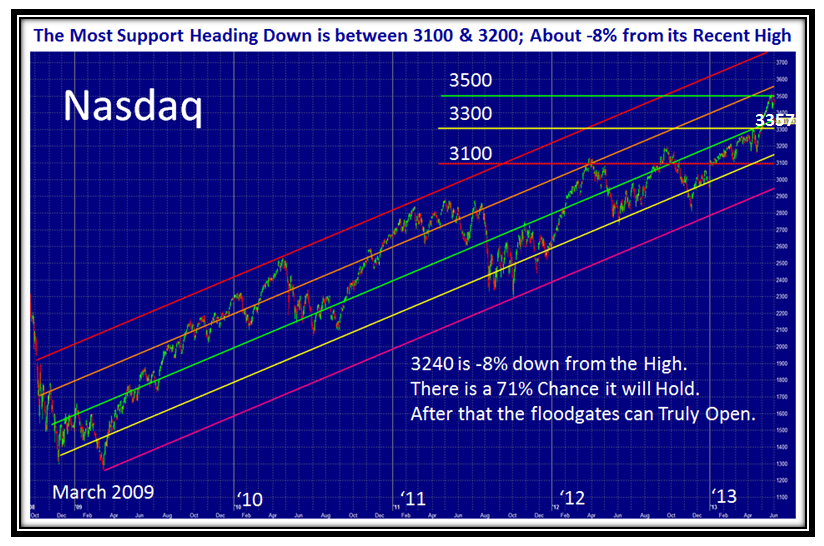
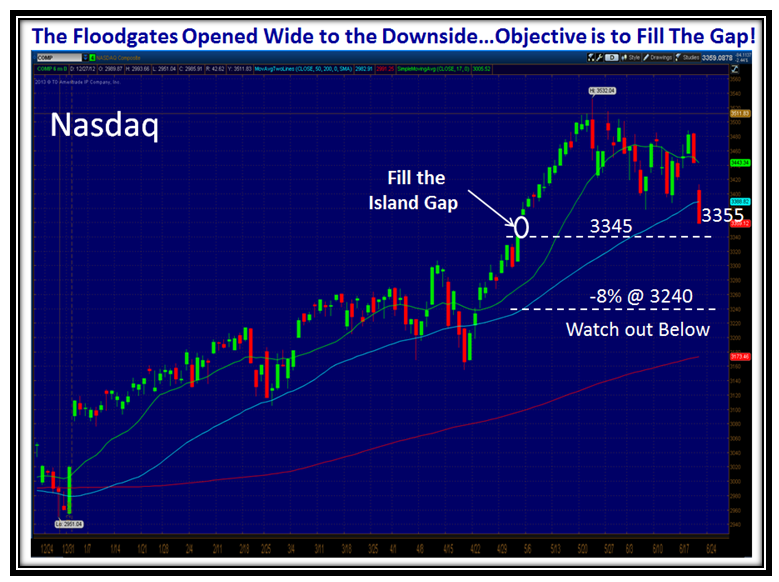
As previously mentioned, the Island Gap was filled and now we have a gap above to fill or we trot down to challenge -8% @ 3240:
Here is a Longer term view for the Nasdaq showing the trend-lines, so there is still cushion before real damage is done:
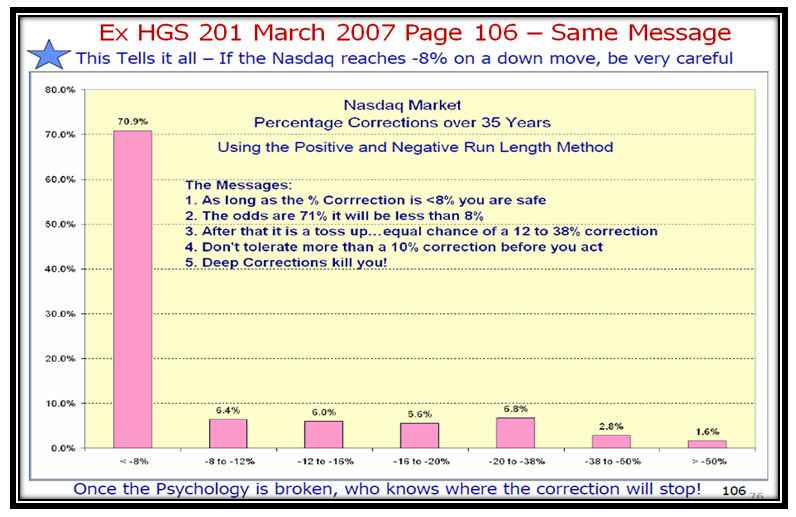
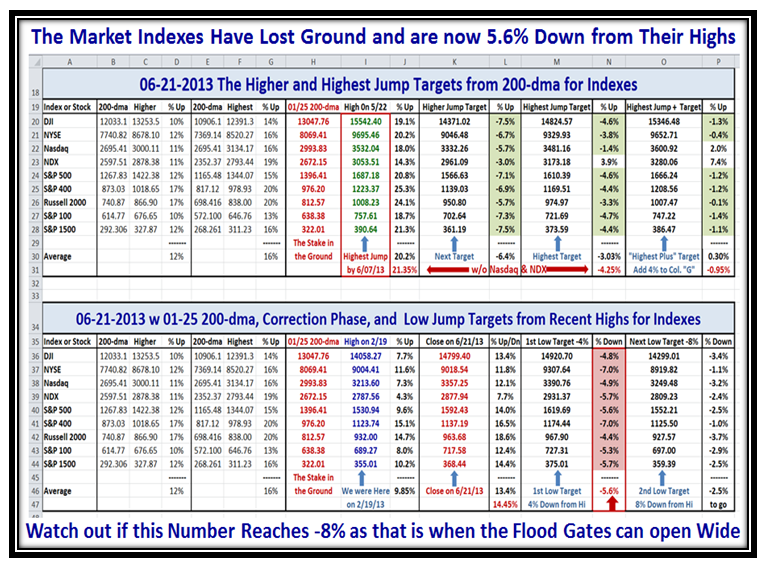
You remember this chart…Below -8% and the Market Indexes can land anywhere, but there is a 71% chance to find support above it:
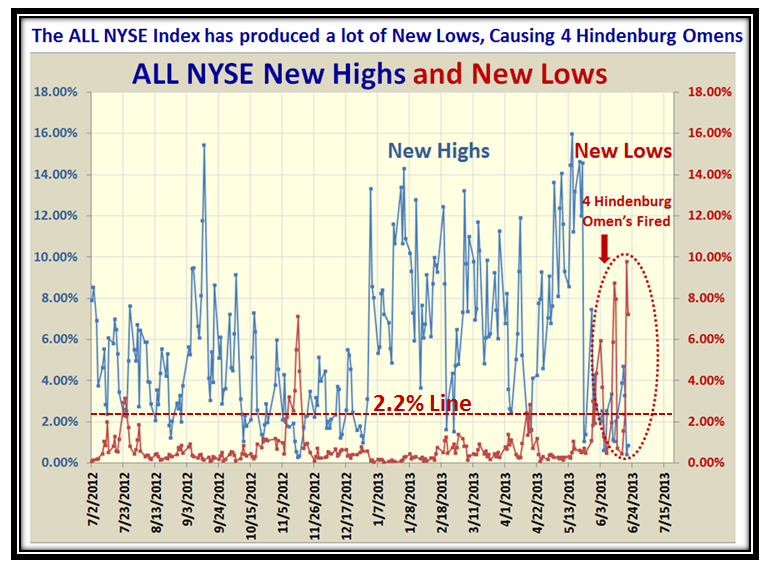
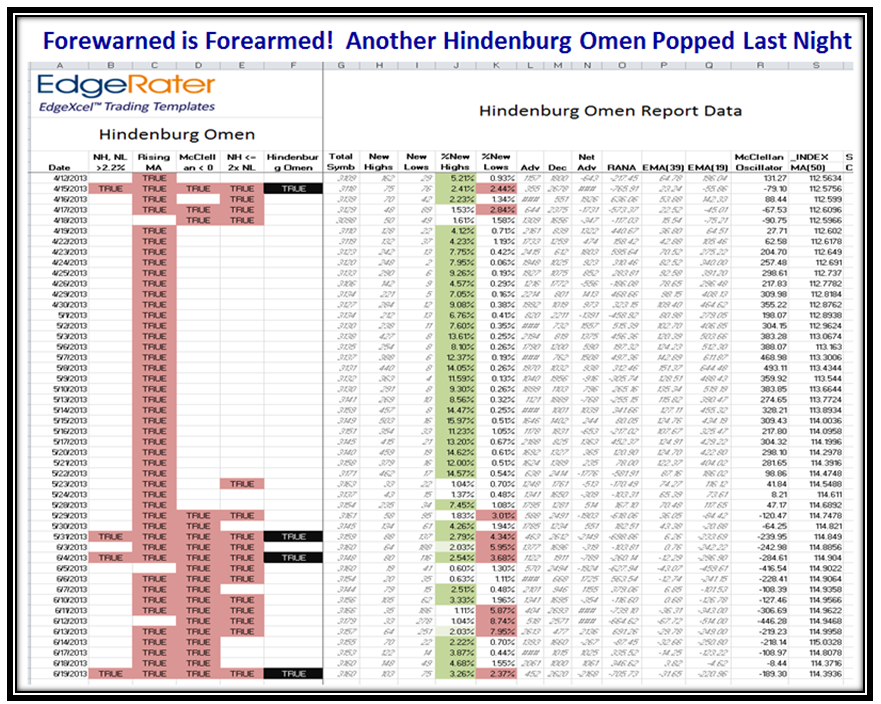
This next chart shows that the # of New Lows fired recently to fulfill the Hindenburg Omen requirements of 2.2% Highs and Lows:
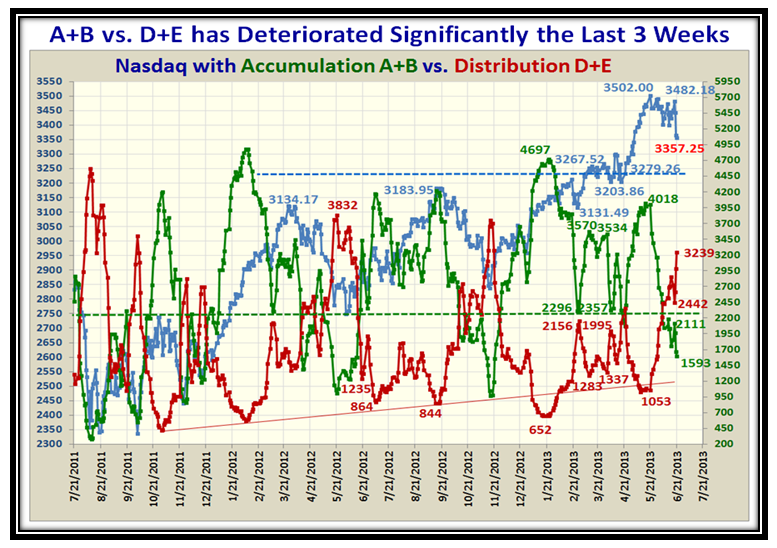
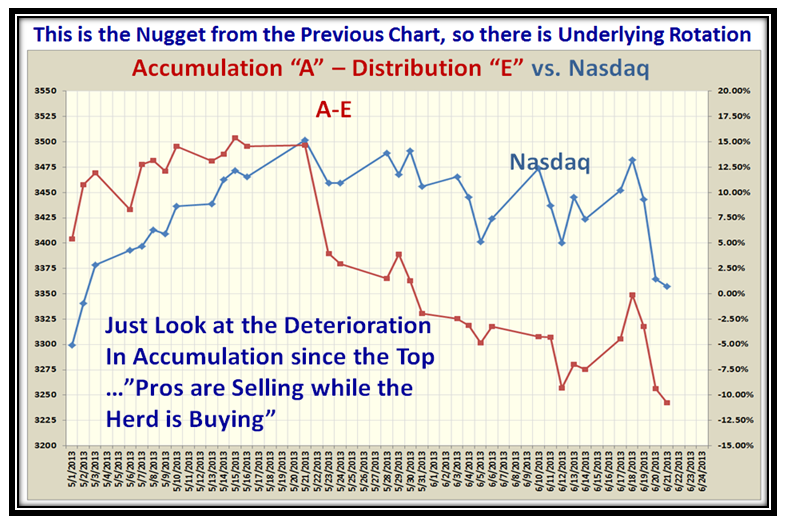
The Internals are awful with A+B now less than D+E by a factor of 2:1:
Worse yet, the “E’s” are swamping the “A’s”, and it will take a strong comeback by the Bulls to right this ship:
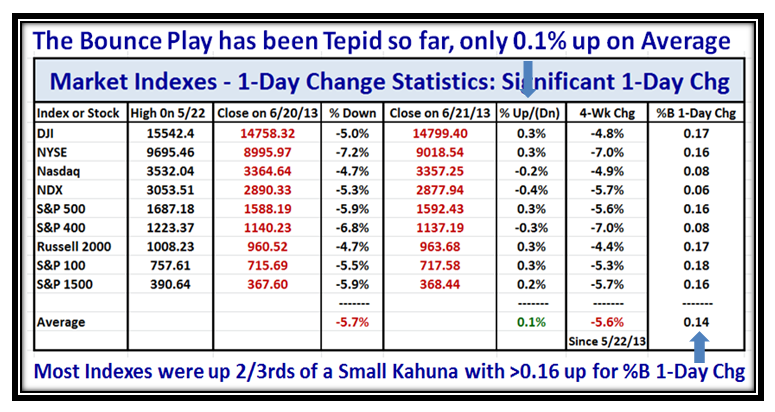
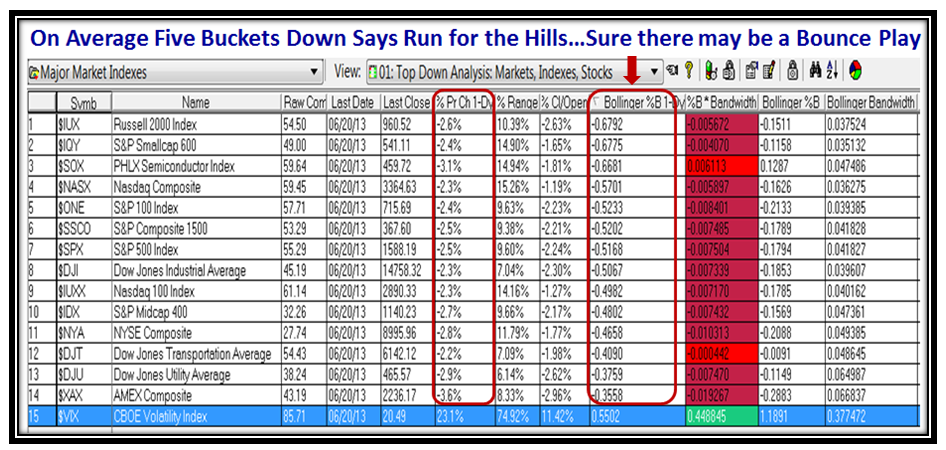
The Spreadsheet shows that the Market Indexes are now down -5.6% on Average from their Highs:
The Bounce Play has been miniscule so far, so we see what transpires this coming week:
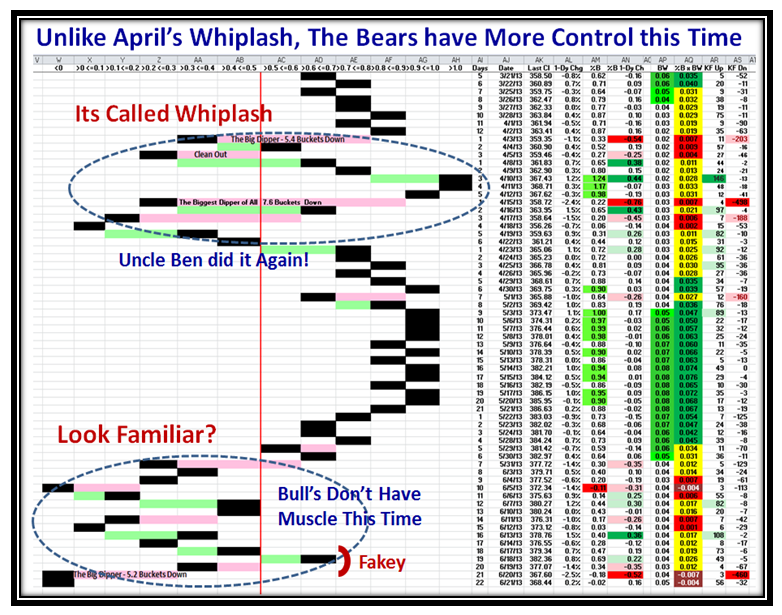
As expected, we got the “Fakey” I warned you about, and now we are back in the doldrums:
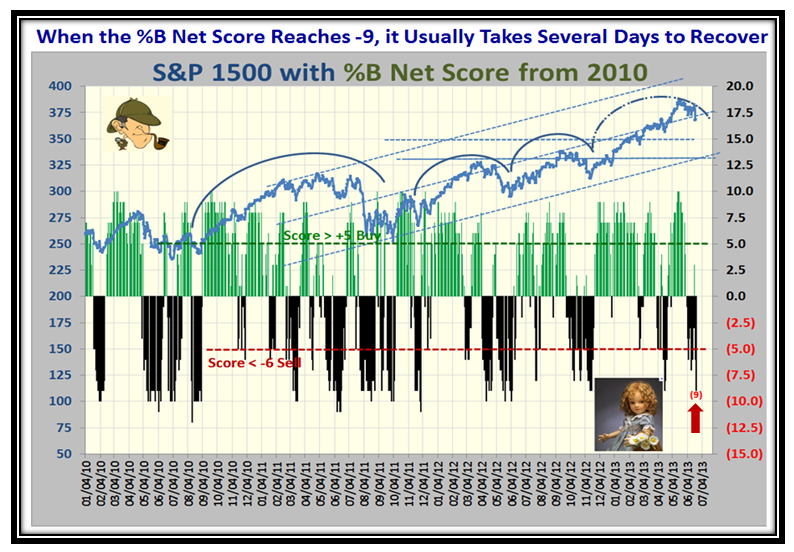
…And last but not least, a (9) shows weakness and it will be a while to gain support to the upside again:
Late Breaking News! Another Hindenburg Omen fired yesterday, and floodgates opened today:
Mid-Afternoon on Thursday Snapshot shows Floodgates have opened to the downside for now:
…And here is the Nasdaq at the Close with the obvious Objective the Big Boys have to fill the Gap to 3345. It’s Triple Witching Options Expiration tomorrow so anything can happen. There is potential support at a nice round number of 3300, but then the fun starts if they break that to the downside.
…And here is the toll taken today…the worst I have seen in Dropped Buckets! Everything is Blood Red:
With Triple Witching Options Expiration tomorrow anything can happen, but the Optimists must be shaking their heads. At least this gives us the clean out we needed so badly. Now wait for the dust to settle, but watch for “Fakey’s” as the Bulls try to regain control.
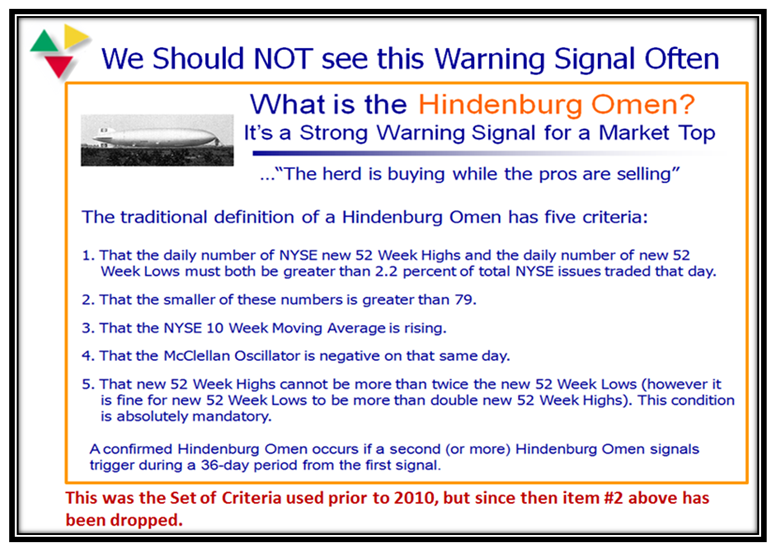
Many Moons ago, particularly back in the time-frame of 2005 and 2007, we had plenty of Hindenburg Omen Signals and of course because of its name, everyone sits up and takes notice when these signals fire. It’s a strong warning signal for a Market Top, and in essence what is happening is that the Herd, which is the likes of you and me, is buying while the pros are selling.
During that timeframe I was fortunate to have Wikipedia pluck one of my blog notes relating to the Hindenburg Omen’s that fired then, and so whenever there is a hint of a sighting my blog gets hits from all over the world to see what more they can glean from my notes on the subject. I appreciate that and here is my updated discussion on the subject to bring you forward one more time on the genesis and history of the whole subject from then to now:
When the Internet goes gaga 24/7 on this good stuff, you would naturally ask “What is all the fuss about?” Its claim to fame is that there has never been a significant Stock Market decline in History that was NOT preceded by a confirmed Hindenburg Omen signal. However, on the other hand, not all signals are going to turn out to be major corrections. In fact, 75% of them are small corrections, and I will show you that in a moment.
But let me first describe what the Criteria are to trigger a Hindenburg Omen Signal of which there are five in all. You will soon see they are cleverly selected to ensure that these signals do not fire except on rare occasions when all must be TRUE on the same day. This is the brilliant work of Jim Miekka who was the originator of this signal and together with Kennedy Gammage came up with the name. You can’t have a spurious single Signal for us to have a confirmed Hindenburg Omen in play. You must have two or more, and invariably you will see there is a cluster at Market Tops. Here they are:
Although the HGSI Hindenburg Omen Indicator has served us well over all of 10 years, times have changed and others have turned to using the ALL NYSE instead of the NYSE Composite, so Chris White, CEO of EdgeRater has worked with me to help keep you up to date. In essence this is the major change in addition to dropping item #2, from what we see in the current literature.
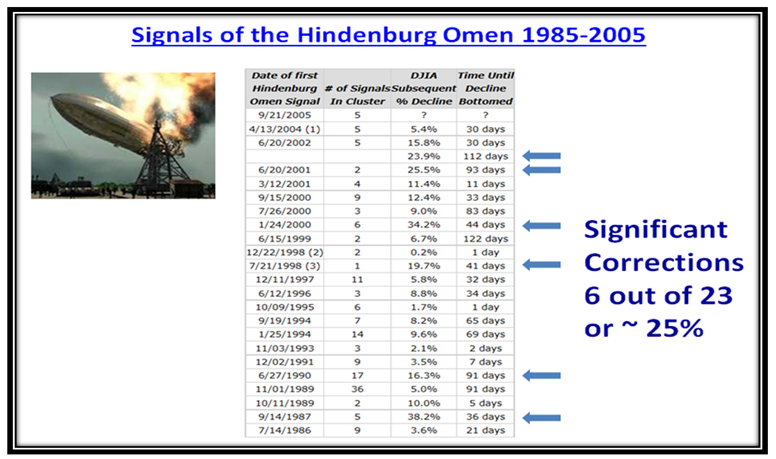
This next slide is the past History from 1985 to 2005, and I have plucked out those that are above 16% which is close enough to a Bear Market Correction of 20% to be considered significant. You will see from the list that these significant corrections amount to 25% of the time. The remaining 75% of the occasions turned out to be essentially small with most of them single digit corrections.
So the bottom line out of all of this is to sit up and take notice when these fire and be on guard until they fizzle out which is 75% of the time…Where have you heard that swan song before? It ties in directly with what I showed you in last month’s Newsletter and on the Blog where Market Corrections are seldom more than -8% from the high, before they find support and rally up again!
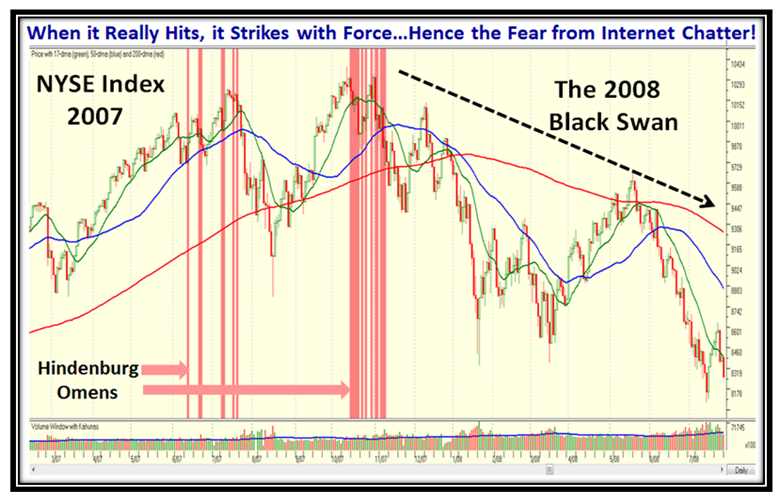
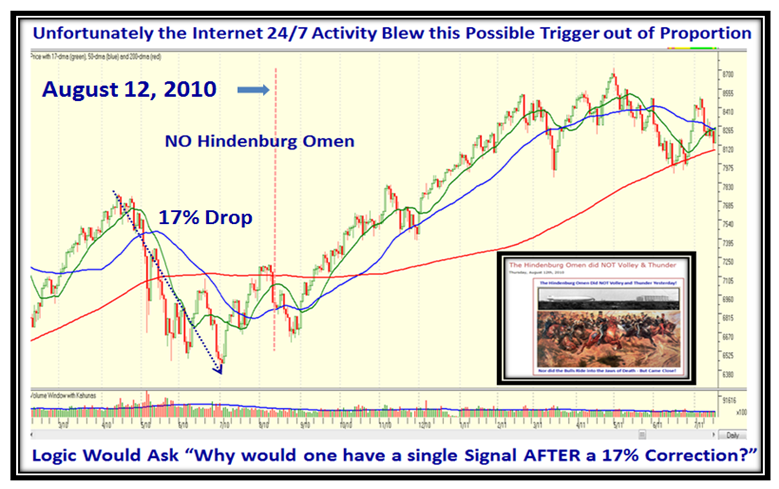
So let’s first see a couple of slides which have been plucked from past Blog Notes for the 2005 to 2008 timeframe, and then one in August 2010 which turned out to be “bogus” even though the Internet went gaga when it occurred. The slides are self-explanatory:
Here is a Screen Shot of the Blog Note Picture I used for the “bogus” sighting back in August 12, 2010:
…And here is why; so never ever take action on a single signal, and even then reason with yourself if it even makes sense, by reviewing such other favorite indicators such as the High Jump, the Eurekas, the Phoenix’ and the Kahunas! This next chart shows that I was correct, since it just made no sense when looking at the chart, period. The stuff to the right was not there at the time, so it was a judgment call:
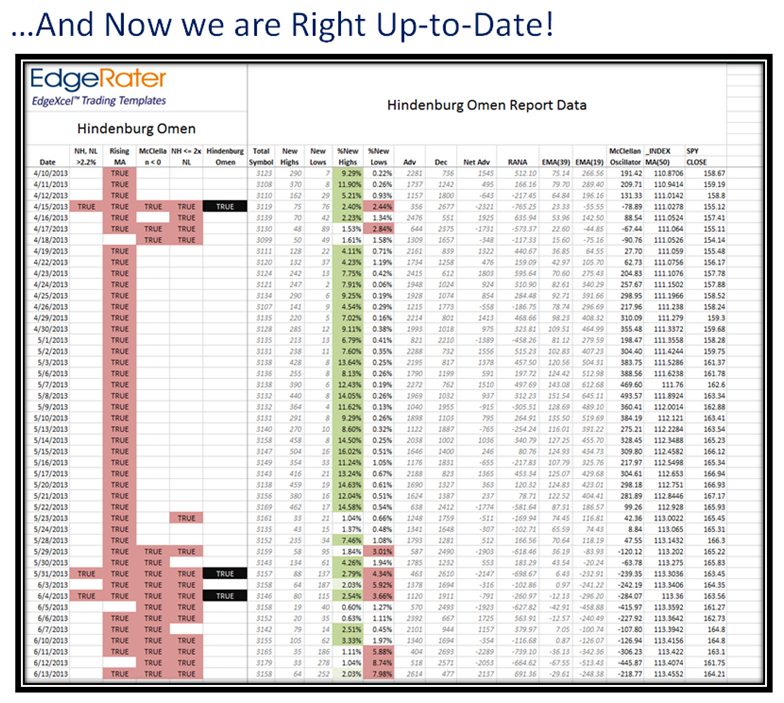
So now we fast forward to this past month, and as I say, it seems that the masses out there are now using the ALL NYSE instead of the NYSE Composite, and with all the work that we have underway in several directions to improve the presentation of the work which we have done over these past 15 years, I was fortunate enough to have Chris give me a lending hand to show how we are hearing 24/7 on the Internet about all this fru-frau of sightings. It seems that it takes Class Stocks, Preferred Stocks, and Warrants in addition to Common Stocks to get these triggers as Chris has ably shown in the video we put together. (See below for the link to U-Tube and how to view it without leaving this Blog)
It goes without saying that my Blog has been lit up with hits from all over the world with 50 from Australia in one day, and I certainly do not want to disappoint them when it is the hot topic of the moment. Needless-to-say, not even a thank you except for a faithful few, but that goes with the territory.
You should immediately see the powerhouse of a job that Chris has done with just this one slide:
There you have it, all you need to know about the Hindenburg Omen but afraid to ask!
Here is the video:
With Best Wishes on Father’s Day to all my Supporters around the world.
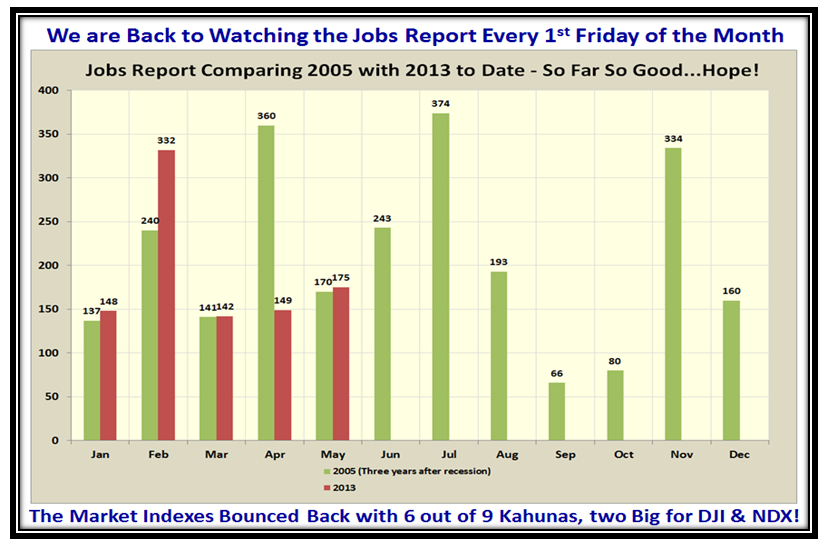
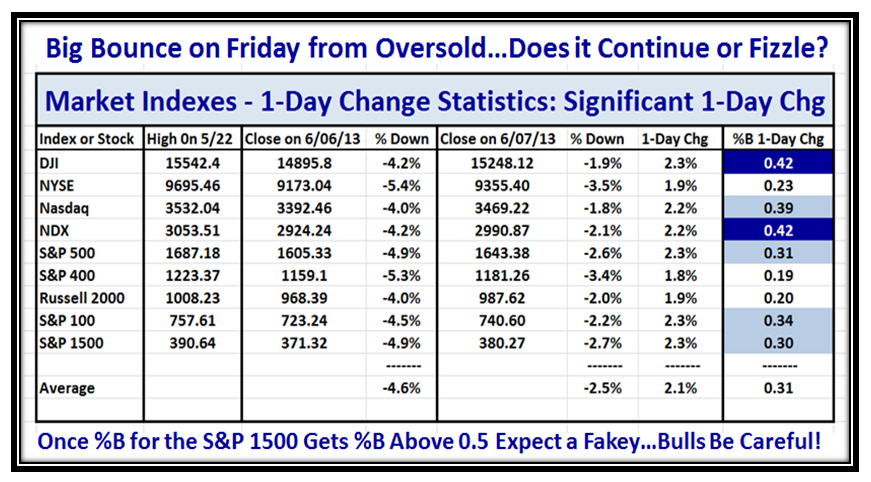
Last week saw the Bears finally seize control and take the Market Indexes down from their Highs by ~ -4.6% only to see a rebound with the Jobs Report which has once again gained attention on the 1st Friday of the Month. This was a significant Bounce Play that regained 2.1% on Friday and chalking up two Big Kahunas up for the DJI and NASDAQ 100 (NDX), and four Small Kahunas for the NASDAQ, S&P 500, S&P 100, and S&P 1500, respectively. I show that picture on the last chart of this Blog Note. So Hope Springs Eternal:
So, let’s take a look at what all the hub-bub was about. You will recall that last year I established that 2005 was the Benchmark Year with which to measure the performance in 2013 to see if we could match or better it as a sign that the economy was at long last recovering. Between friends, I say “so far, so good”, as we are matching the numbers by and large. Nothing to write home about, but none-the-less this Market will latch on to any bit of reasonable news as they interpret it. Who are we to argue, though the Bears once again find themselves running for cover:
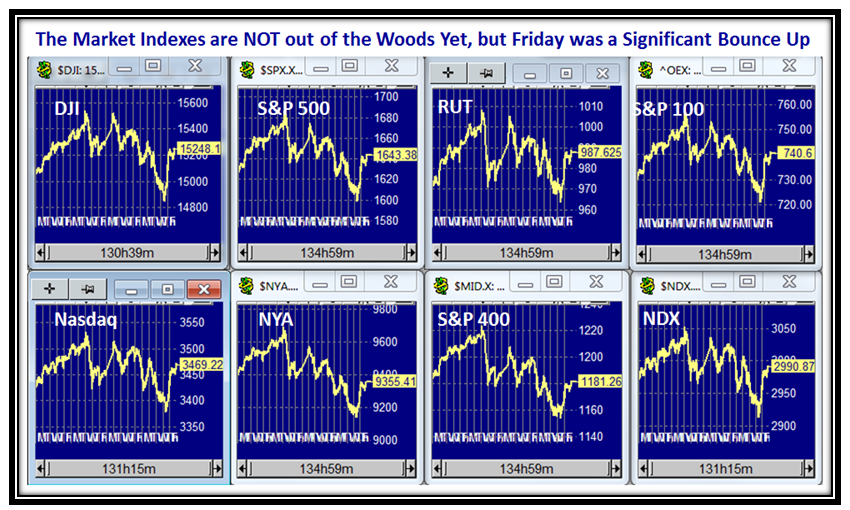
One day does NOT a Rally make, but at least it has stopped the rot setting in for now as seen by the Bounce Back on Friday:
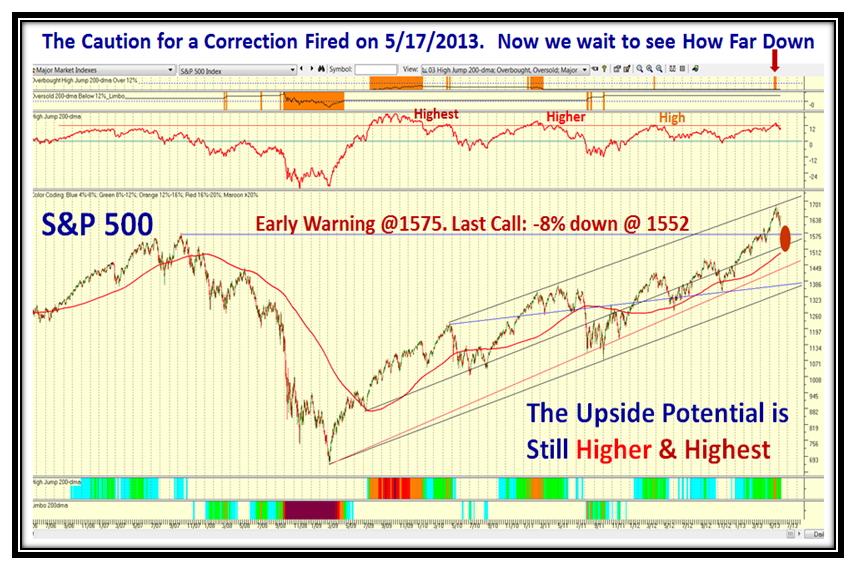
In our approach to Greed and Fear, the Caution Signal fired back on 5/17/2013 right on Target with the Market Top when the S&P 500 reached 12% above the 200-dma, and now the strategy is simple for both the upside and downside scenarios:
Upside: First reach the recent high, avoid a double top and trot on up to reach the Higher Target of +16% from the 200-dma.
Downside: Head back down to -4% from the high target with an early warning @ 1575 and then for -8% down @ 1552.
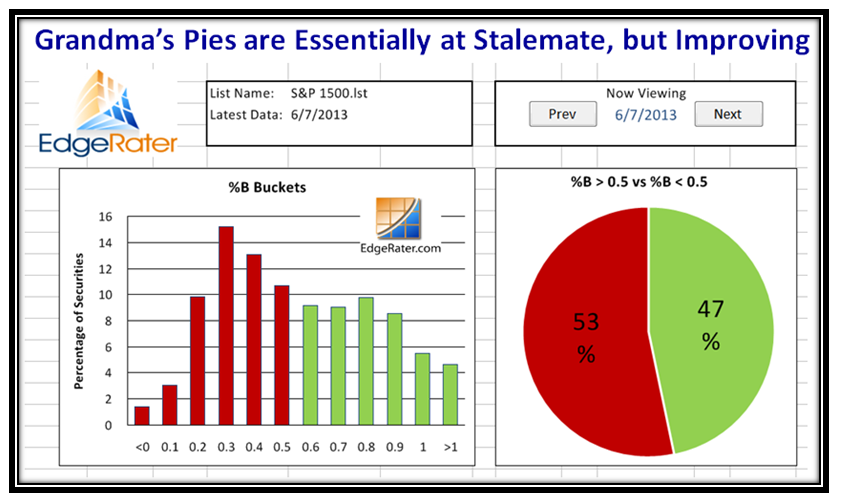
Looking at the internals, we are essentially at Stalemate with Grandma’s Pies sitting at 47%:53% above and below 0.5 %B:
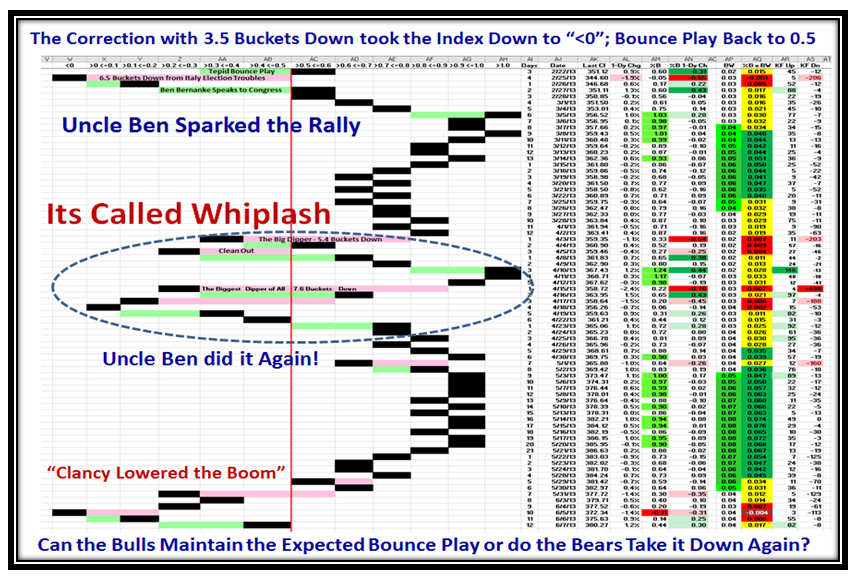
When “Clancy lowered the Boom” with -3.5 Buckets down on 5/31/2013, it led to another down move before Bouncing Back:
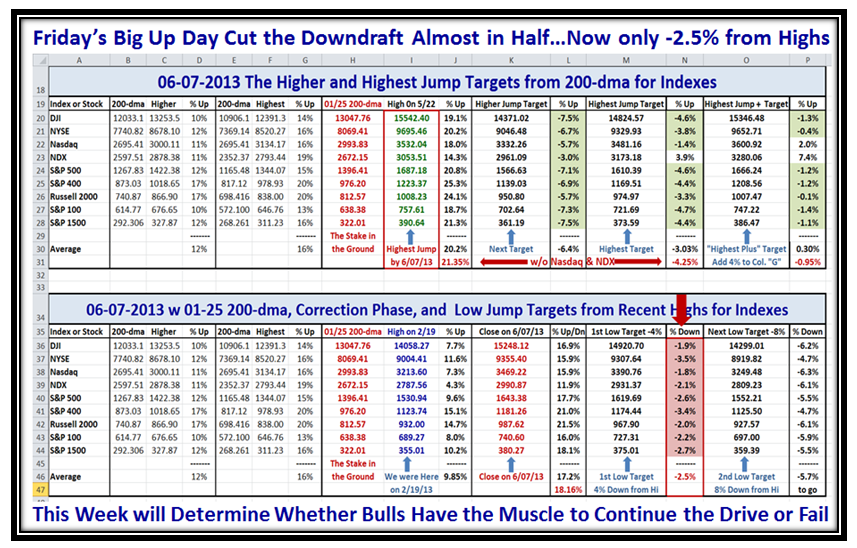
This next spreadsheet has kept us on the right side of the market and shows where we sit as of today, which on average is down -2.5% from the recent highs achieved by the Market Indexes. As a result of Friday’s bounce back the Bulls have a little breathing room, but this coming week will determine who has control, which has been in the Bears favor these past ten days:
…Finally, the chart that sums up the Bounce Play on Friday that gives us Hope Springs Eternal there is still more to the Rally:
 Ian Woodward's Investing Blog