 Ian Woodward's Investing Blog
Stock Market: Hope Springs Eternal!
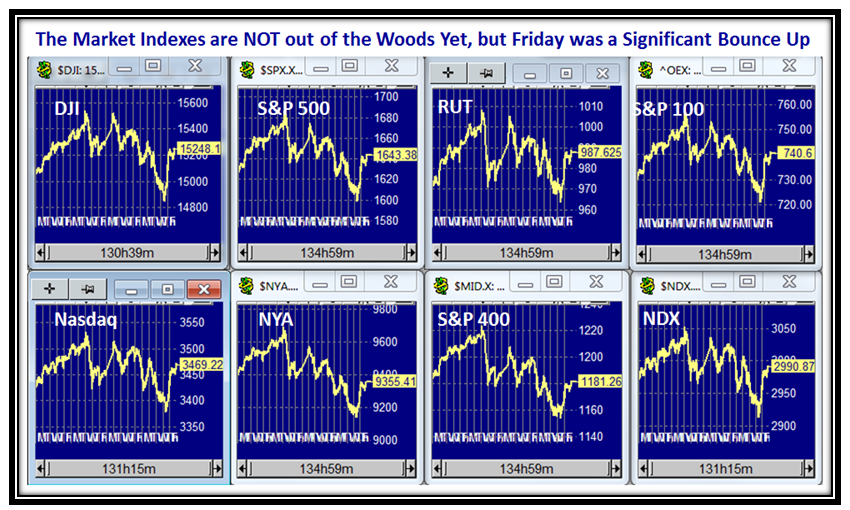
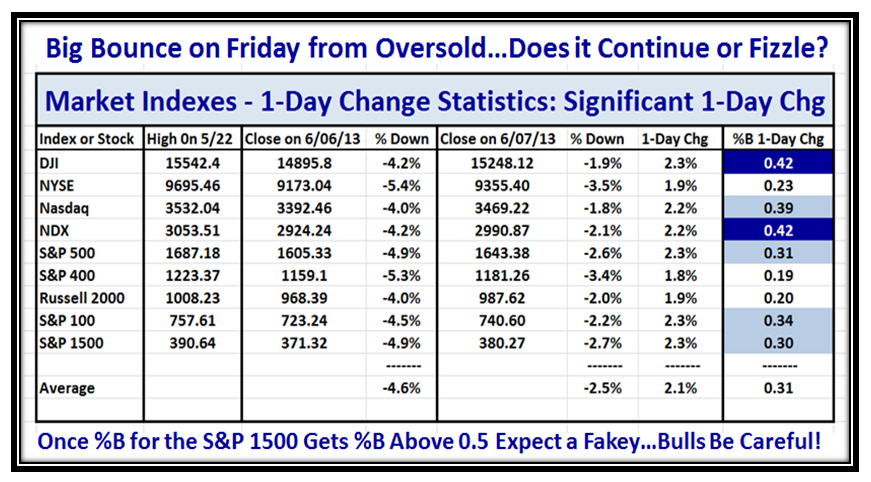
Last week saw the Bears finally seize control and take the Market Indexes down from their Highs by ~ -4.6% only to see a rebound with the Jobs Report which has once again gained attention on the 1st Friday of the Month. This was a significant Bounce Play that regained 2.1% on Friday and chalking up two Big Kahunas up for the DJI and NASDAQ 100 (NDX), and four Small Kahunas for the NASDAQ, S&P 500, S&P 100, and S&P 1500, respectively. I show that picture on the last chart of this Blog Note. So Hope Springs Eternal:

So, let’s take a look at what all the hub-bub was about. You will recall that last year I established that 2005 was the Benchmark Year with which to measure the performance in 2013 to see if we could match or better it as a sign that the economy was at long last recovering. Between friends, I say “so far, so good”, as we are matching the numbers by and large. Nothing to write home about, but none-the-less this Market will latch on to any bit of reasonable news as they interpret it. Who are we to argue, though the Bears once again find themselves running for cover:
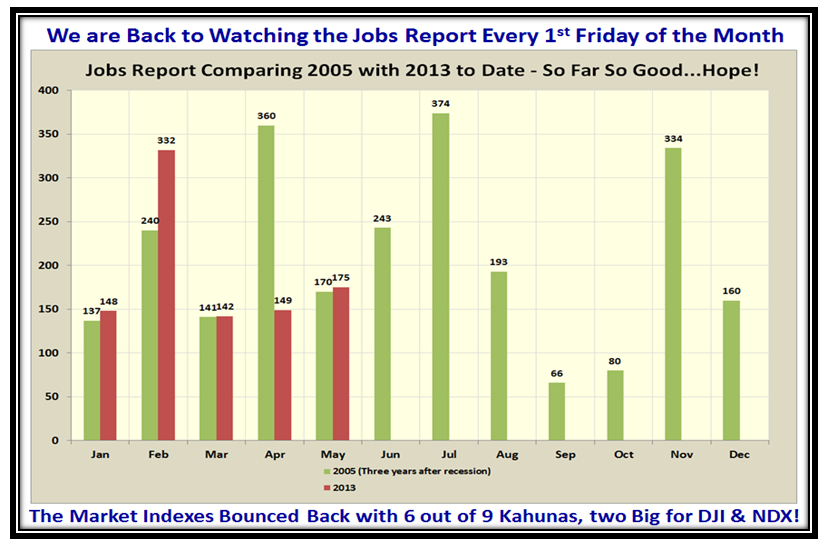
One day does NOT a Rally make, but at least it has stopped the rot setting in for now as seen by the Bounce Back on Friday:
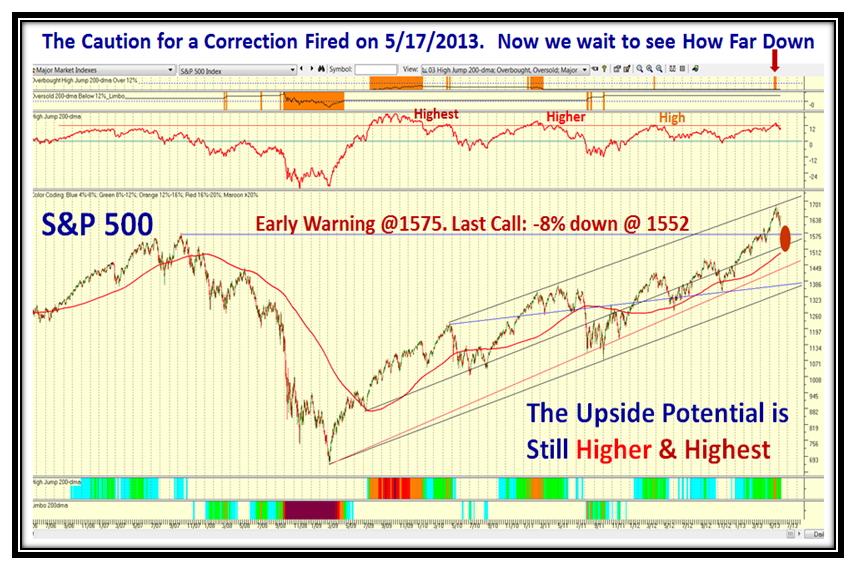
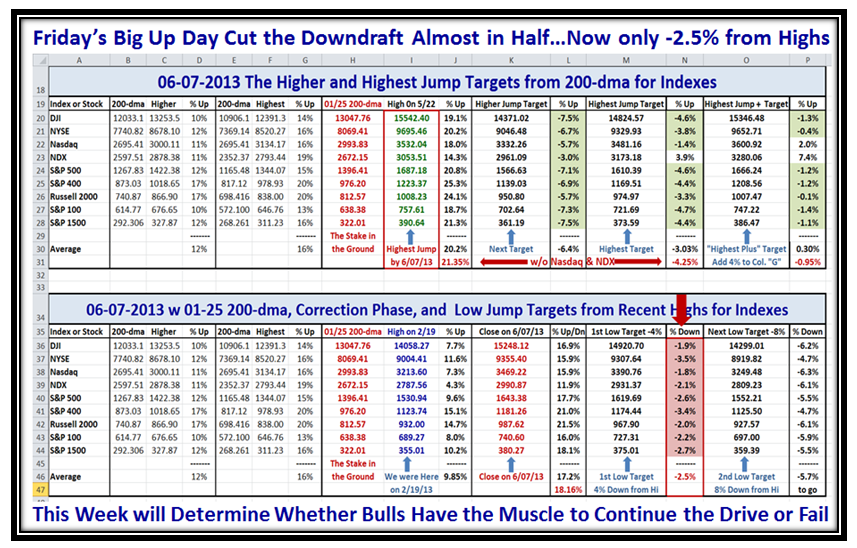
In our approach to Greed and Fear, the Caution Signal fired back on 5/17/2013 right on Target with the Market Top when the S&P 500 reached 12% above the 200-dma, and now the strategy is simple for both the upside and downside scenarios:
Upside: First reach the recent high, avoid a double top and trot on up to reach the Higher Target of +16% from the 200-dma.
Downside: Head back down to -4% from the high target with an early warning @ 1575 and then for -8% down @ 1552.
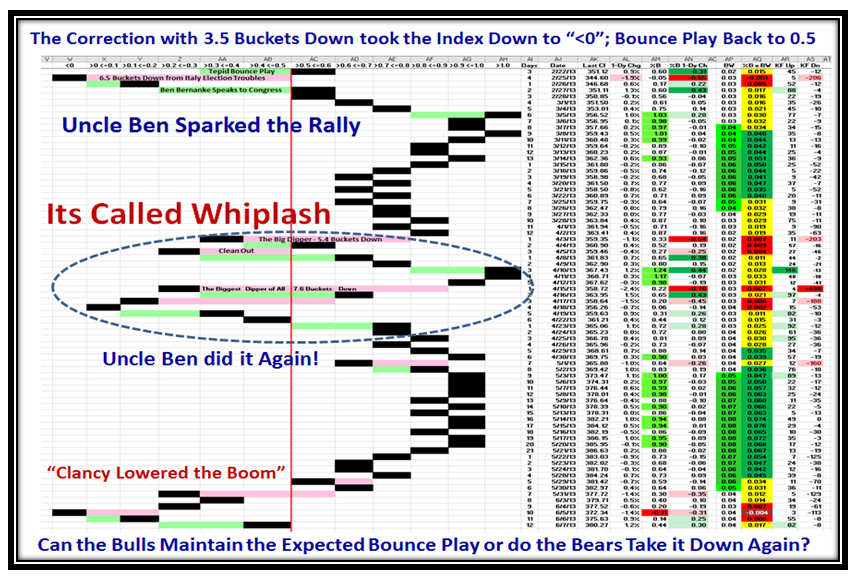
Looking at the internals, we are essentially at Stalemate with Grandma’s Pies sitting at 47%:53% above and below 0.5 %B:
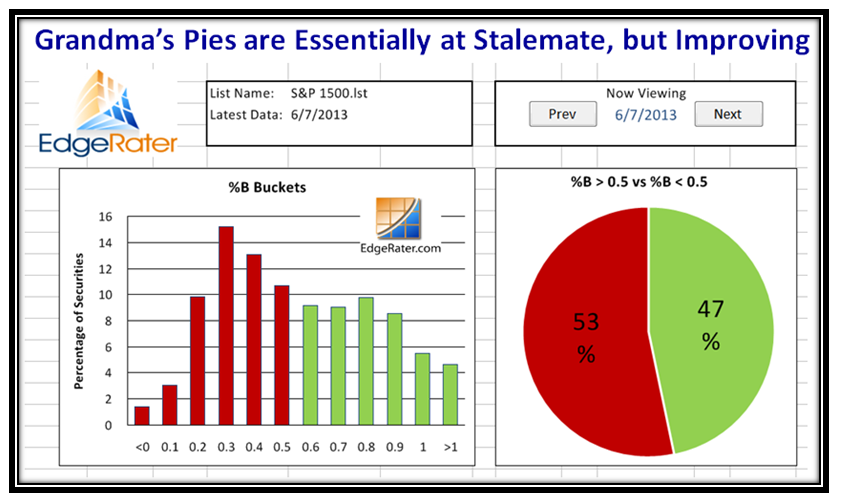
When “Clancy lowered the Boom” with -3.5 Buckets down on 5/31/2013, it led to another down move before Bouncing Back:
This next spreadsheet has kept us on the right side of the market and shows where we sit as of today, which on average is down -2.5% from the recent highs achieved by the Market Indexes. As a result of Friday’s bounce back the Bulls have a little breathing room, but this coming week will determine who has control, which has been in the Bears favor these past ten days:
…Finally, the chart that sums up the Bounce Play on Friday that gives us Hope Springs Eternal there is still more to the Rally:
Enjoy and Best Regards,
Ian.
