Ian Woodward's Investing Blog

Archive for July, 2013

Stock Market: Bite Your Finger Nails

Tuesday, July 23rd, 2013

We are at a point where its time to bite your finger nails, as this Market can go either way:

Fingers Picture

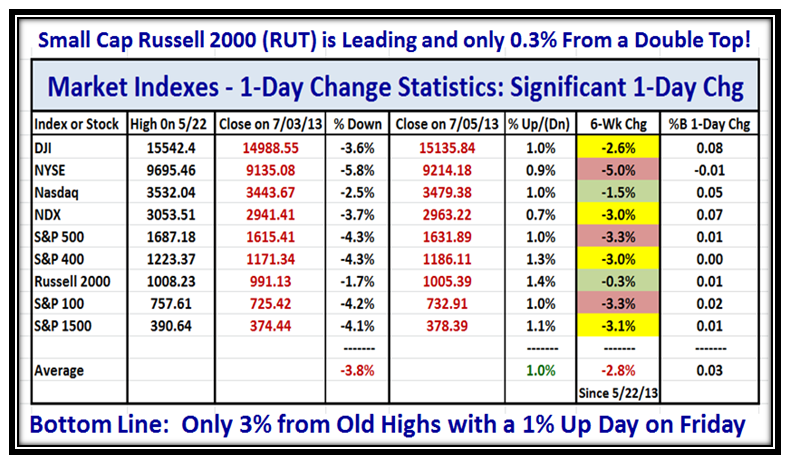
The NASDAQ and NDX are already showing signs of Fatigue, and the others are running out of steam:

Fingers Indexes

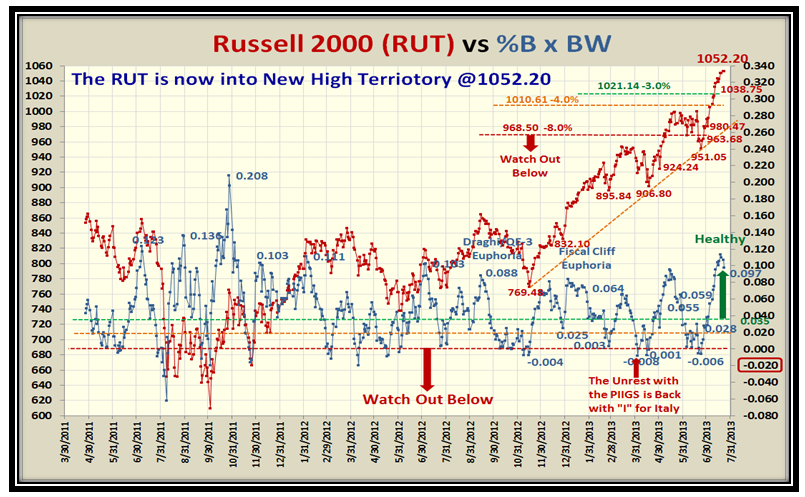
The RUT is still the strongest and now provides plenty of cushion:

Fingers RUT

What helps the Bulls is the complacency on the VIX at the moment:

Fingers VIX

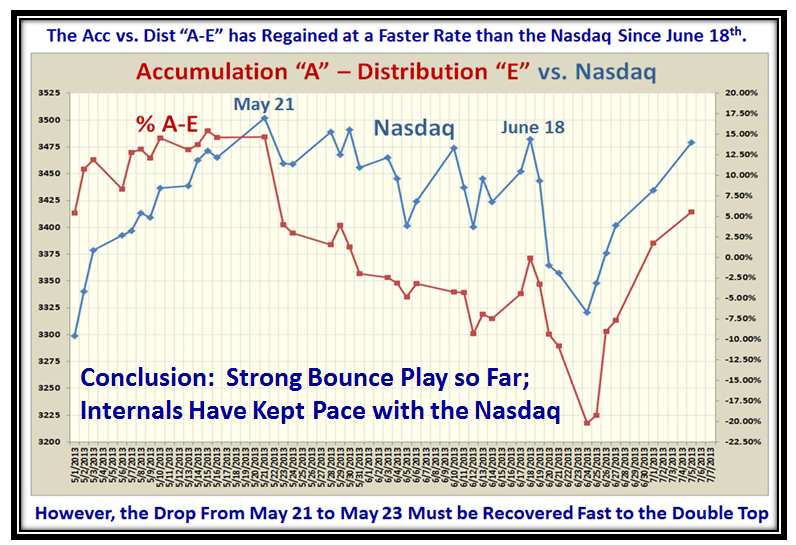
Accumulation vs. Distribution Ratio has improved significantly over the last month and reaching the point to turn around:

Fingers acc

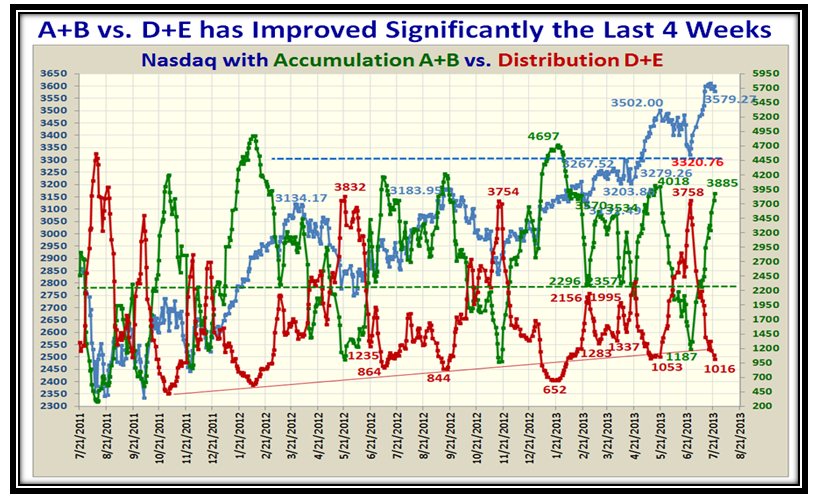
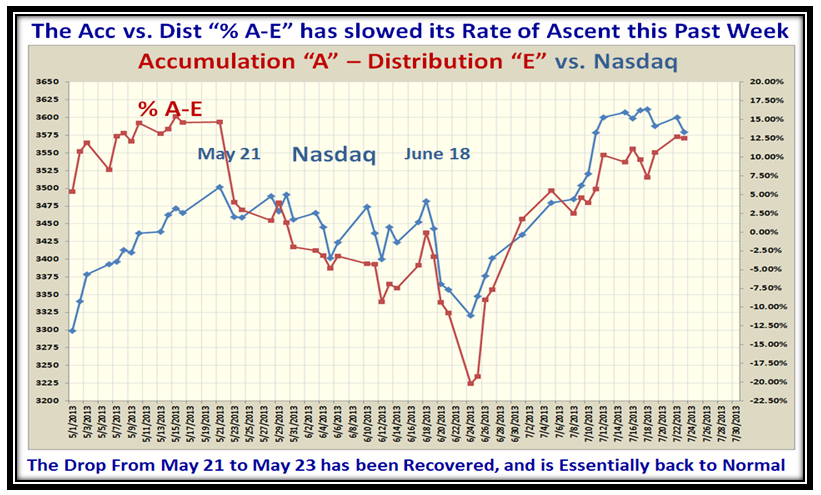
We cannot complain about the strength of the Rally over the last month, which shows that we have recovered:

Fingers acc2

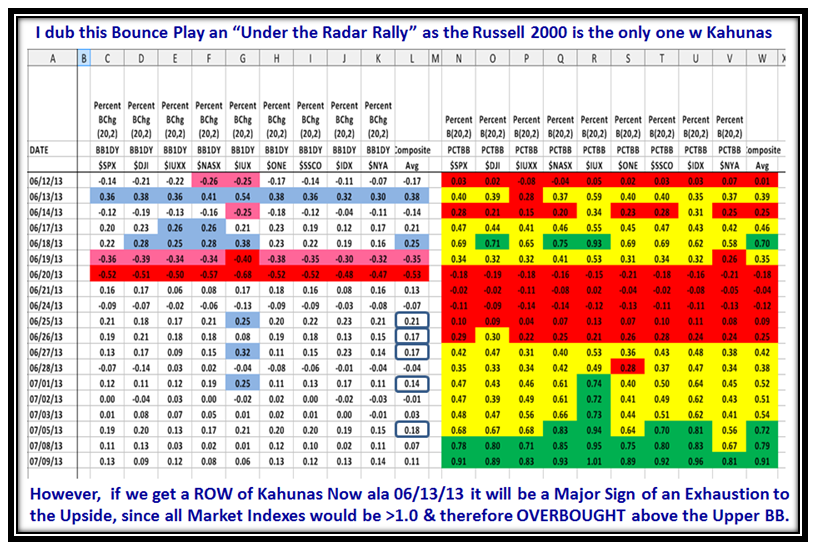
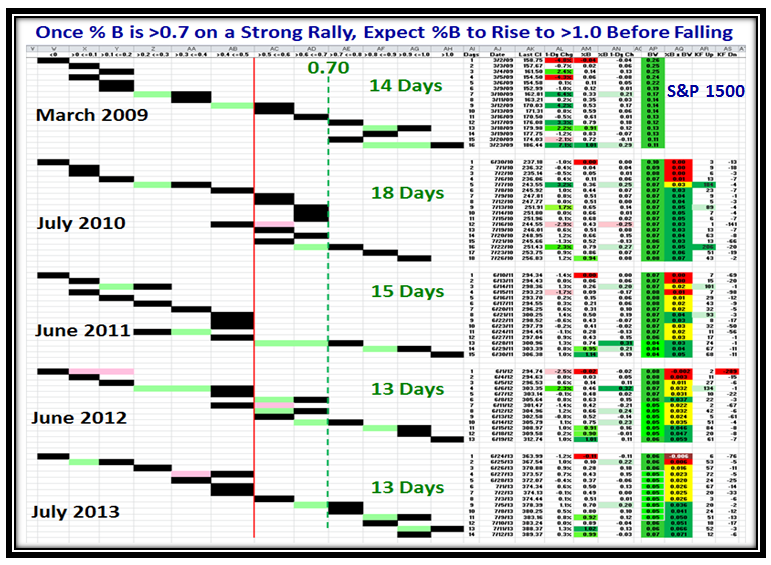
…And to prove this was no ordinary rally, it went from oversold to overbought in just 13 Days:

Fingers pie

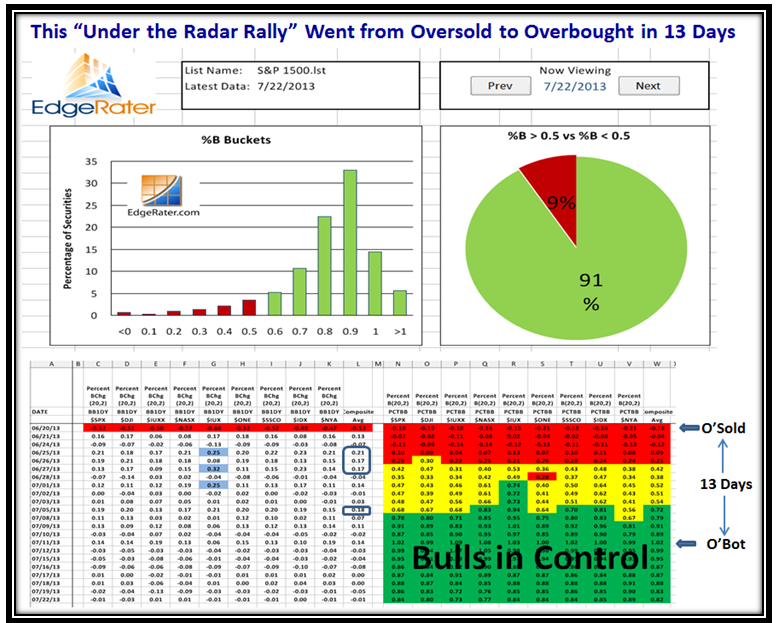
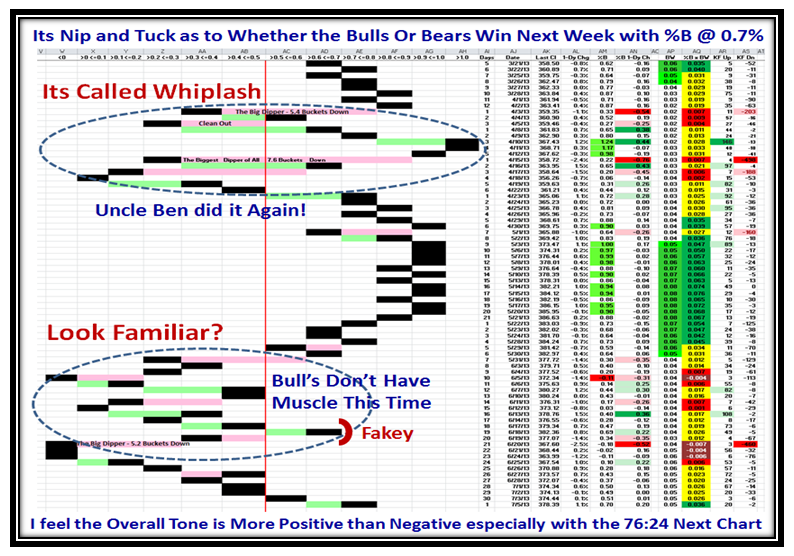
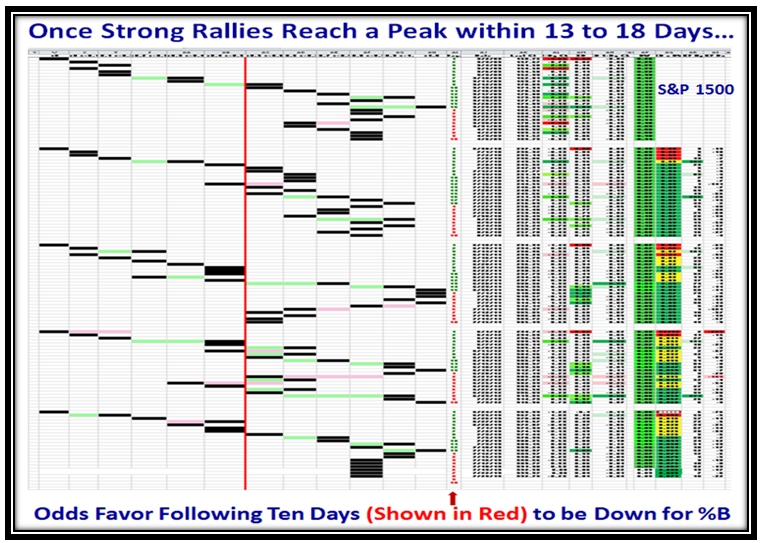
The natural next question is how often has this happened before over the past five years since the start of the Rally in 2009? The answer is that the range is 13 to 18 Days for the best Rallies over five years.  Once past %B of 0.7, expect the move to continue up:

Fingers pat

Then inquiring minds would like to know what are the odds for up or down of %B over the next ten trading days?  Down.  However, the Market Indexes can usually hold up for at least five days, and then trot down or sideways:

Fingers pat2

Stay on your toes, and watch the signs I have taught you of 4% down at a time with -8% from the high to think about vacating.

Best Regards,

Ian.

Stock Market: Game Plan using %B Buckets!

Wednesday, July 10th, 2013

Here is a recent question from Paul R regarding the State of the Union ala Kahunas and Buckets:

Ian any thoughts about the current rally in the market as we haven’t had any Kahunas in the indexes other than the Russelll 2000 since the Eureka on June 26?

That would suggest to me we really don’t have a broad market participation.

Paul R

Hi Paul:  As my younger son Paul would say “You are a Smart Dude”!

Sometimes hard and fast numbers can mislead one, so I had to look under the covers to come up with the answer.  I dub this Bounce Play an “Under the Radar Rally”, as you will see from the chart below.  As you rightly say the RUT is the only beast that has shown Kahunas, as the others have all been slightly below the 0.24 requirement to signal a small Kahuna.  To my eyes, that’s “Close enough for Gov’t work”!

The right hand side of the chart says we do have broad market participation, since %B on Average is at 0.91 and knocking on the door of being very overbought, as it is so close to 1.0, the upper Bollinger Band. We can immediately see that the NYA is the laggard and everyone knows by now that the Small Cap RUT and S&P 600 are the leaders.

Looking ahead, if we get a ROW of Kahunas NOW ala 06/13/13, it will be a Major sign of an Exhaustion Gap to the upside, since all Market Indexes would be >1.0 and therefore OVERBOUGHT above the Upper BB.

Blind Paul

Since we are now at “Double Tops” or higher for most Market Indexes, we should expect a correction sooner than later as I described in my previous blog note , but the alternative is to see an Exhaustion Gap to the upside.

Now the Game Plan is simple, but you had me tossing and turning in bed last night trying to figure out the conundrum!

This stuff is fun!  Italy seems to be getting the hang of it as they were all over my blog note the other day!

Ian

Stock Market: Blind Leading the Blind but Bulls Winning

Sunday, July 7th, 2013

Ten Days ago the Bears were dancing that at long last the floodgates were opening and now we are in a Strong Bounce Play where it appears the Bulls have the upper hand.  The Champions of both sides are full of chatter, but in essence it comes down to the Blind Leading the Blind!

Blind Picture

I am happy to say that of the two Market Scenarios I gave you, Scenario #1: Quick Recovery is winning:

Blind Nasdaq 1

Ten Days later here is where we stand with an impressive cushion of 100 points as we expect no more than a -3% Drop to complete the Inverse Head and Shoulders I predicted.

Blind Nasdaq 2

Here is the standard picture of the eight Market Indexes which shows the progress to a Double Top with the Small Cap Russell 2000 (RUT) leading the way:

Blind Indexes

Fakey’s usually occur for %B <0.7 and the S&P 1500 is right at that reading, so it is a toss up.

Blind Pat

This next picture using Buckets is the most encouraging as the Market seldom dies with 20% in Bucket >1.0:

Blind Pat 2

We see a big improvement in %A-E for Accumulation vs. Distribution, but there is still work to do:

Blind a-e

And last but not least, here is the most encouraging news in six weeks since the top in all the Market Indexes:

Blind Indexes 2

Have a Happy!

Ian.

Copyright © 2007-2010 Ian Woodward
Disclaimer: Commentaries on this Blog are not to be construed as recommendations to buy or sell the market and/or specific securites. The consumer of the information is responsible for their own investment decisions.