Ian Woodward's Investing Blog

Archive for February, 2014

Stock Market: NASDAQ Highest Jump Target is 4350

Wednesday, February 19th, 2014

Those of you who follow my blog faithfully will recall on the December 26th, 2013 Blog I showed you the rationale for the “High, Higher and Highest” Targets using my High Jump Process.  We had just achieved the Higher Jump Target on Christmas Eve of 4155, and then the Market corrected sharply.

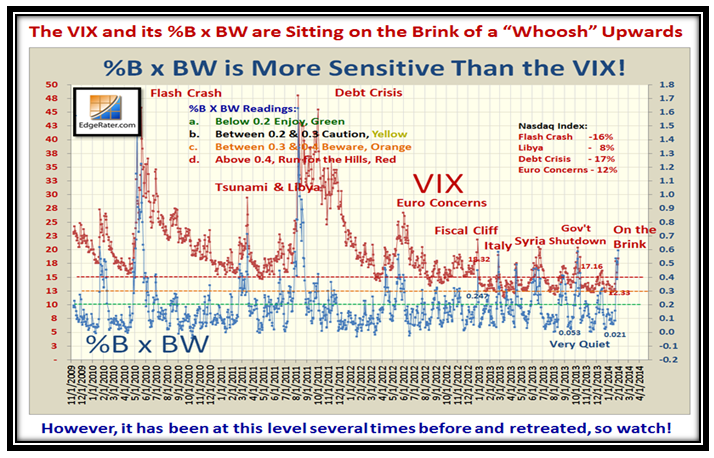
We were on the brink of a more serious correction ten days ago, when the “Janet Yellen Halo Effect” took place with the NASDAQ rising ten days in a row!  So the Market is rising into New High Territory, and I felt it would be wise to dust off those old targets for your perusal.

Yellen Picture

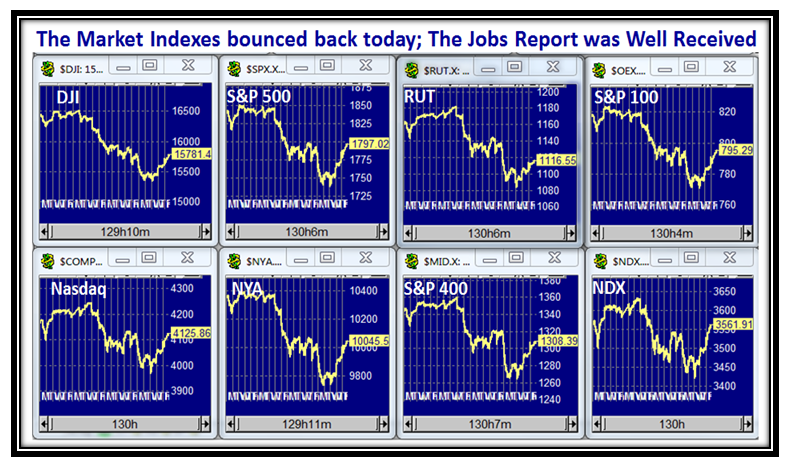
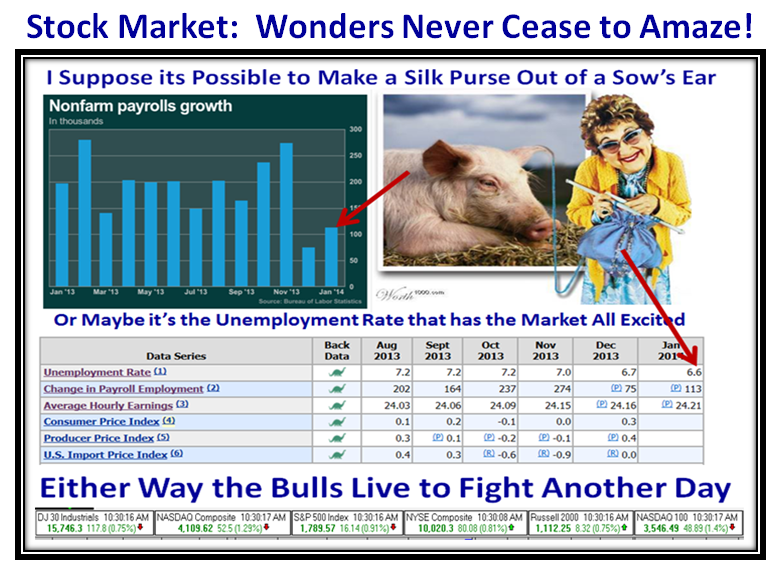
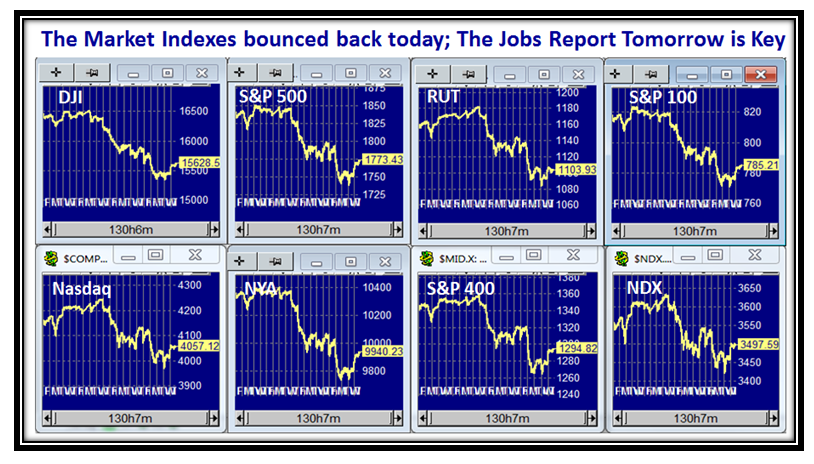
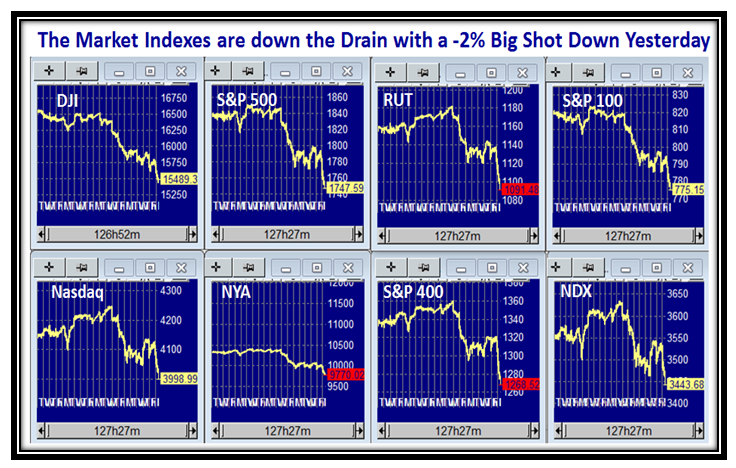
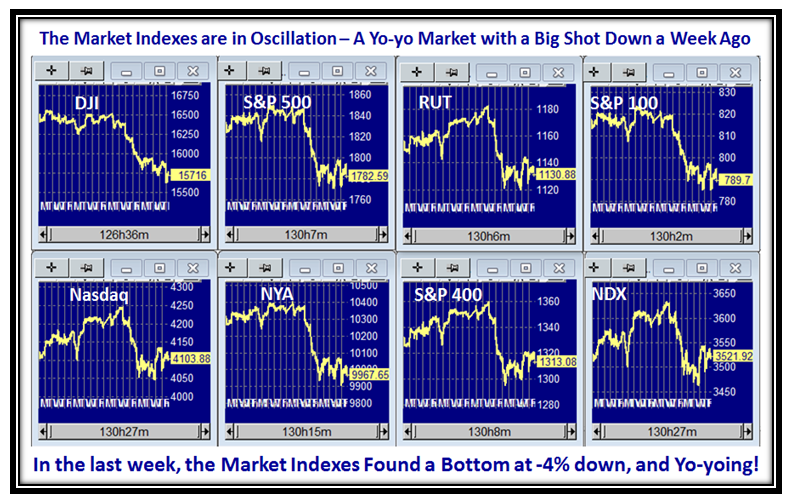
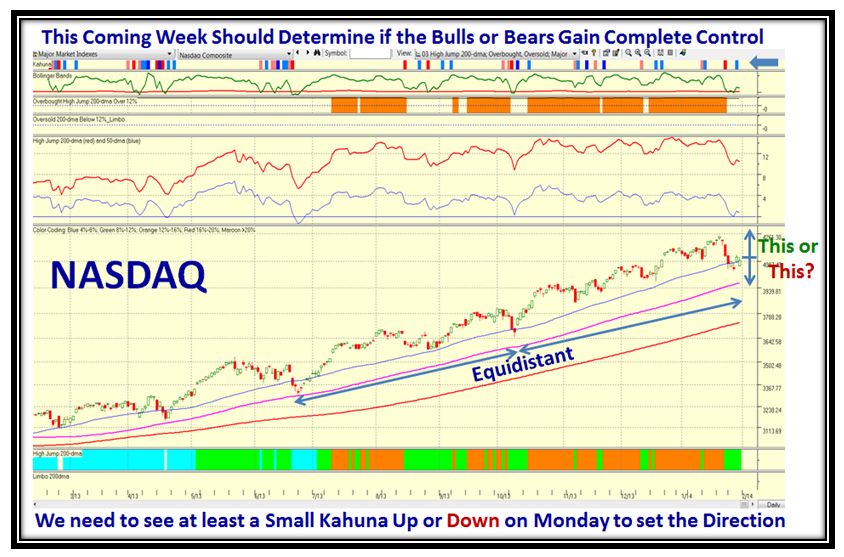
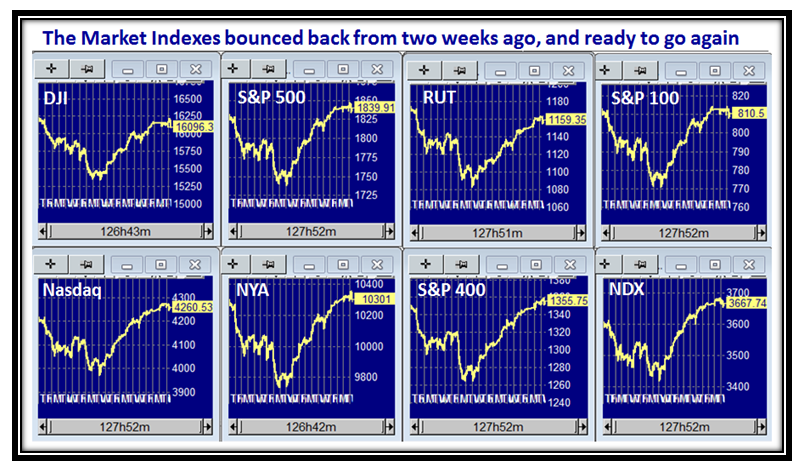
The Market Indexes are down a little bit today as I write this blog but you can see at a glance that the snapshot shows we are now back to “Double Top” territory with the potential for going higher:

Yellen Indexes

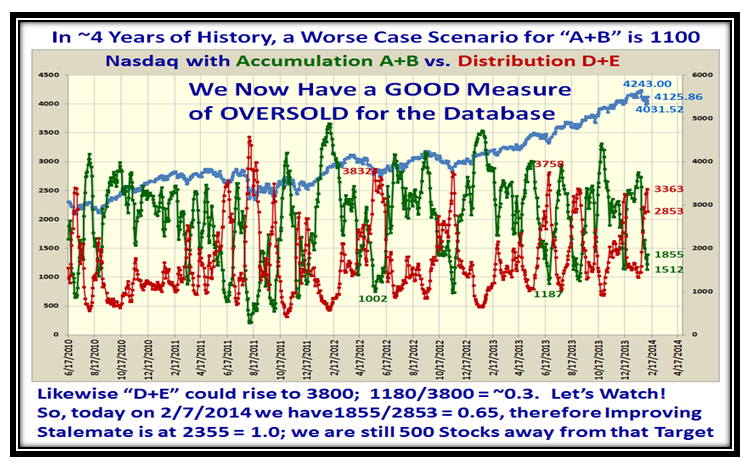
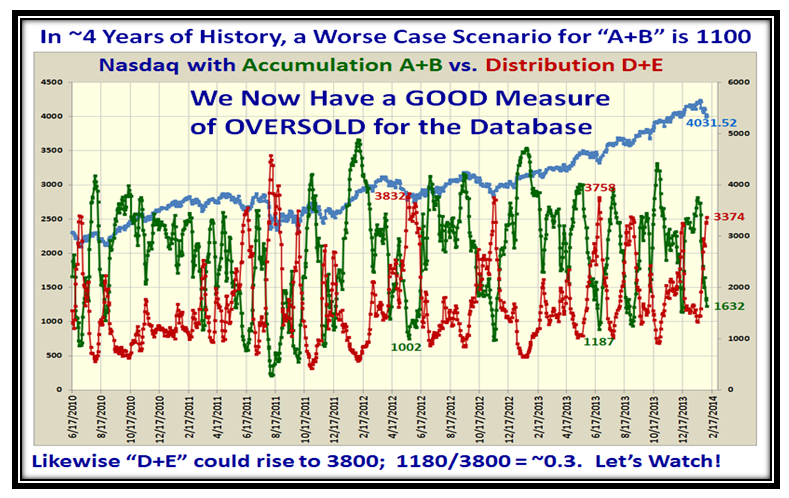
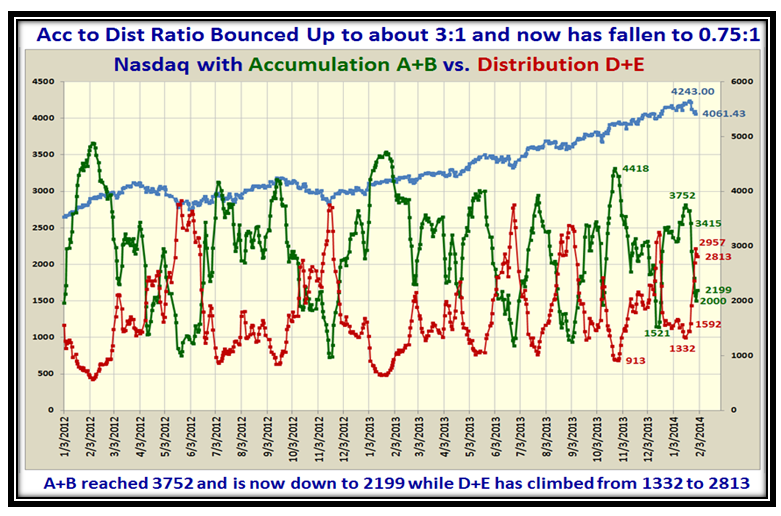
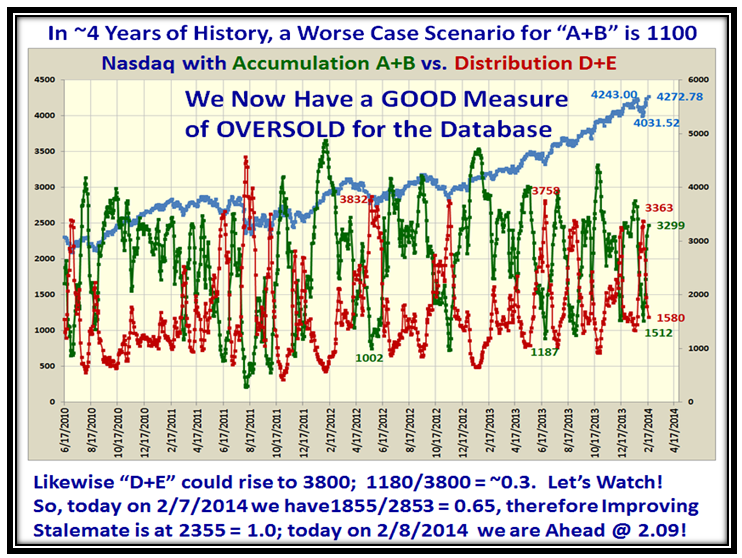
Likewise, the Acc/Dist Ratio has snapped back from being oversold to a respectable ~2:1 Ratio, so things are looking up for the Bulls once again:

Yellen abcde

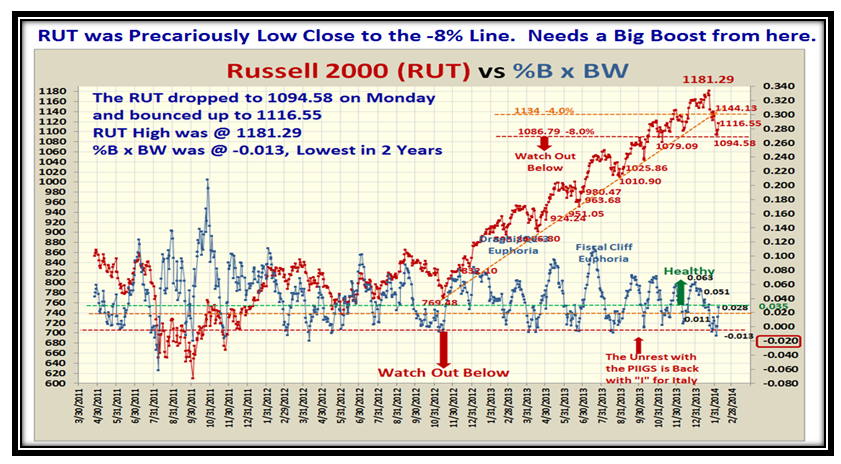
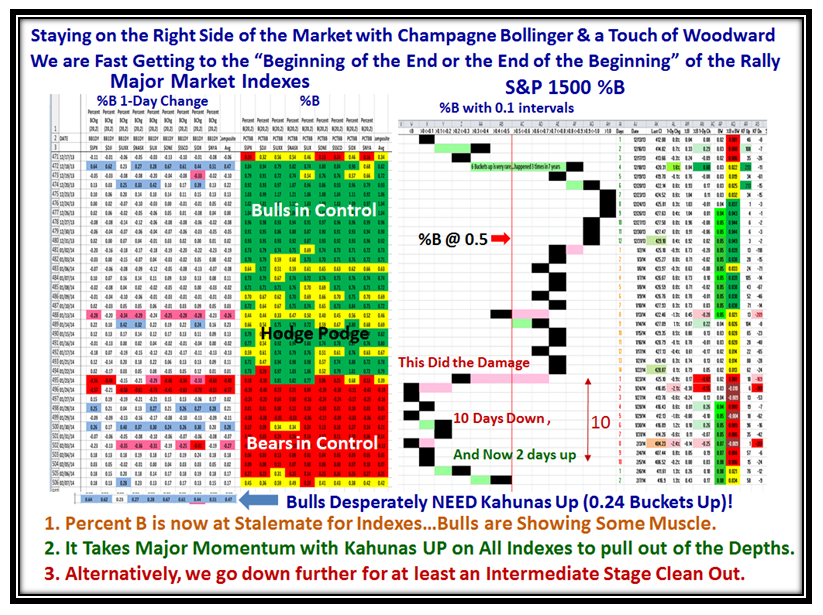
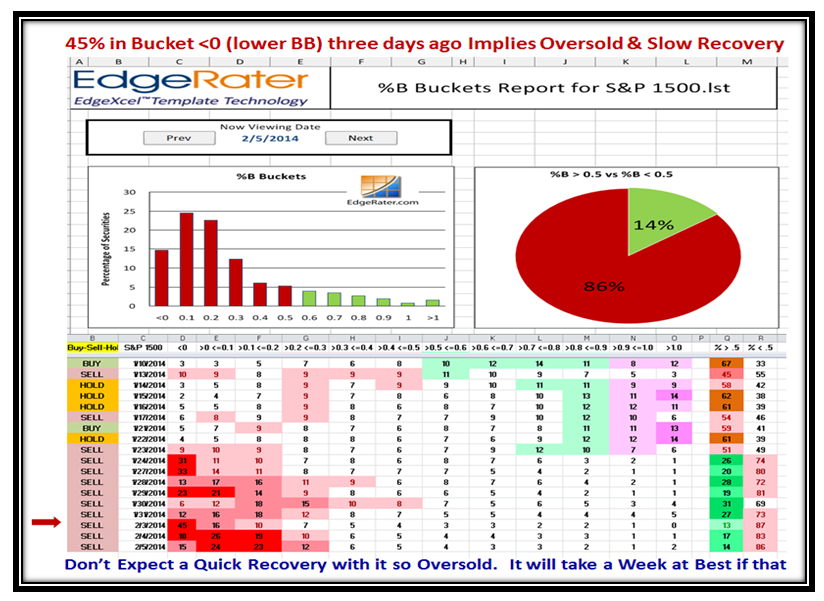
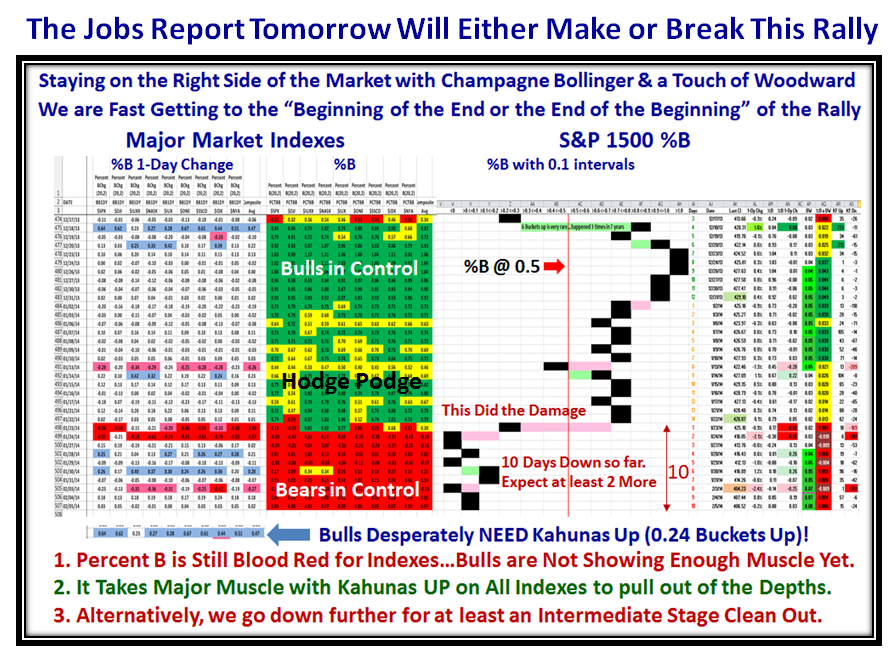
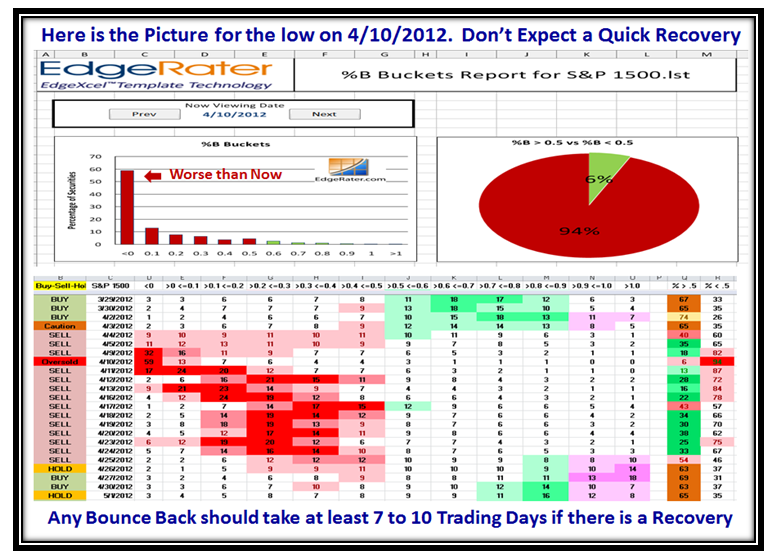
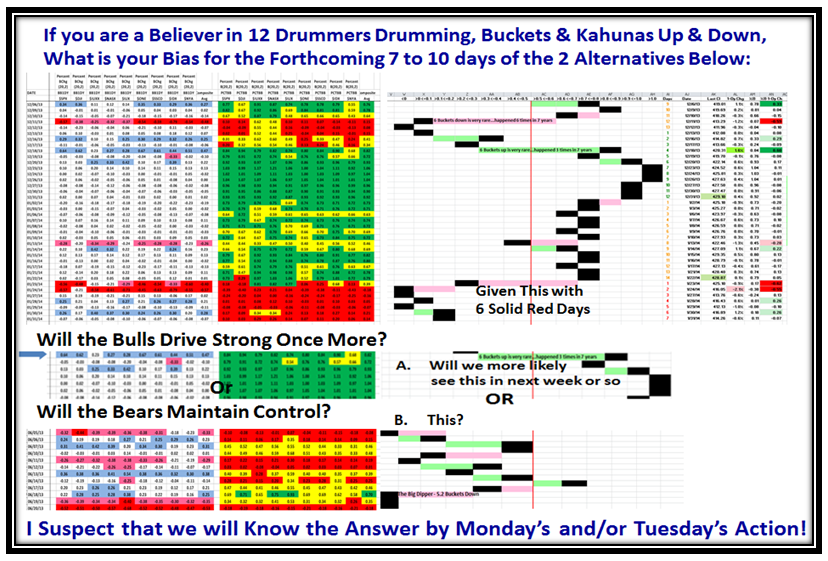
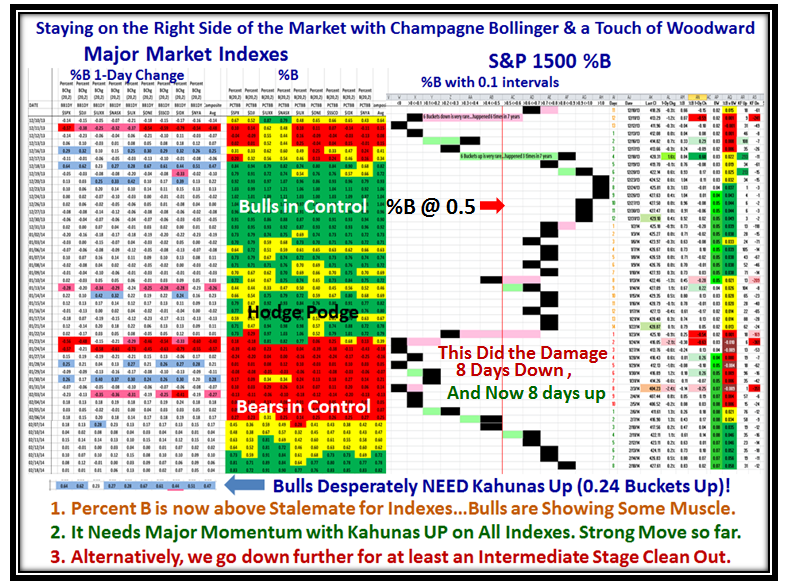
With that preamble in setting the stage for an upside move it pays to look at our favorite chart to get one more confirmation before we look at the High Jump Targets for the NASDAQ.  It is the current picture of the S&P 1500 with its buckets compared to the Major Market Indexes with their %B, and %B 1-Day Change:

Yellen Pat

Now let’s get to the meat of this Blog relating to the Next High Jump Target.  For your convenience the next two slides are plucked from the December 26th Blog which you should go back and review by selecting that timeframe from past blogs on the right hand side of the first page.

Yellen HJ1

Yellen HJ2

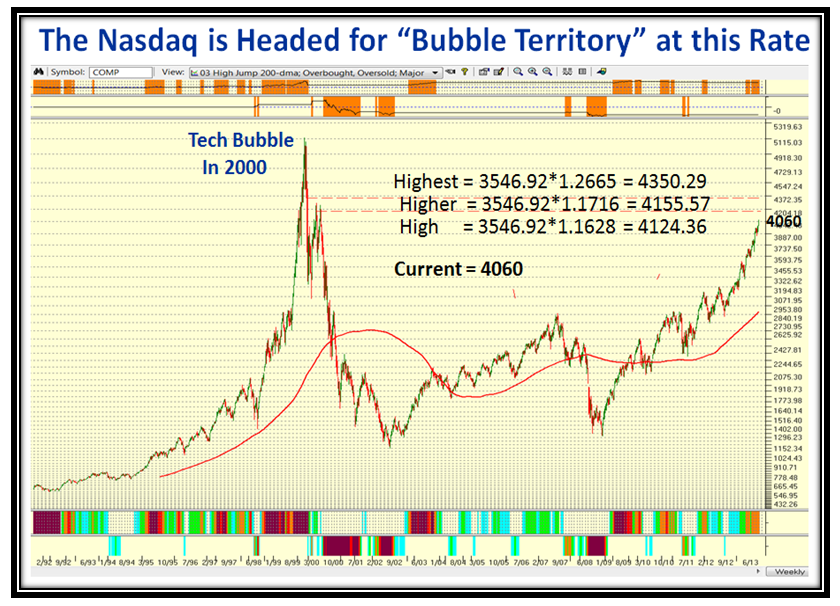
Those two charts served us well over the Santa Claus Rally period and we achieved the “Higher” Target then.  The temptation is to apply the same technique to NOW, but my advice is not to do that, as one would then be compounding the “Greed Factor”.  Far better to stick with the old Targets from back then and set one’s sights on the Highest Jump Target of 4350 from that previous exercise.  If and when we pass that Target we can set new Stakes in the Ground, and measuring rods.  So rolling forward two months from then we get:

Yellen HJ3

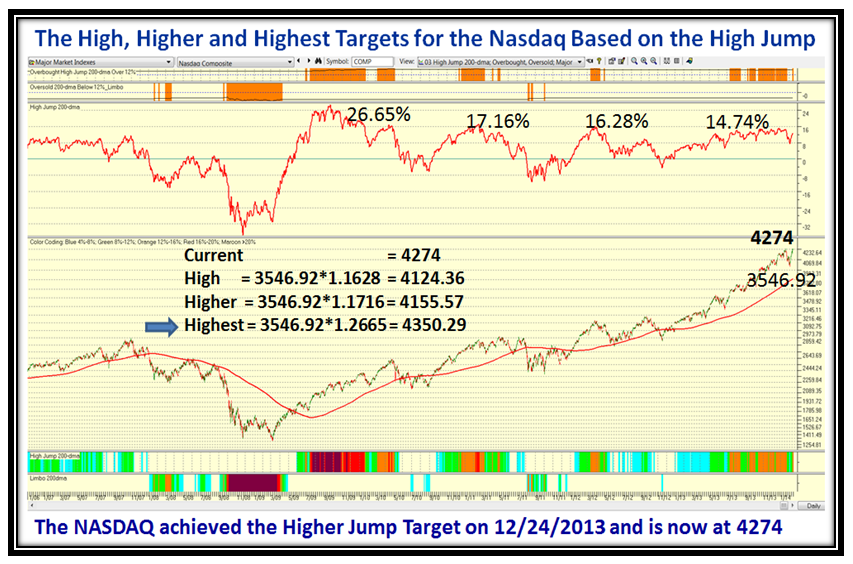
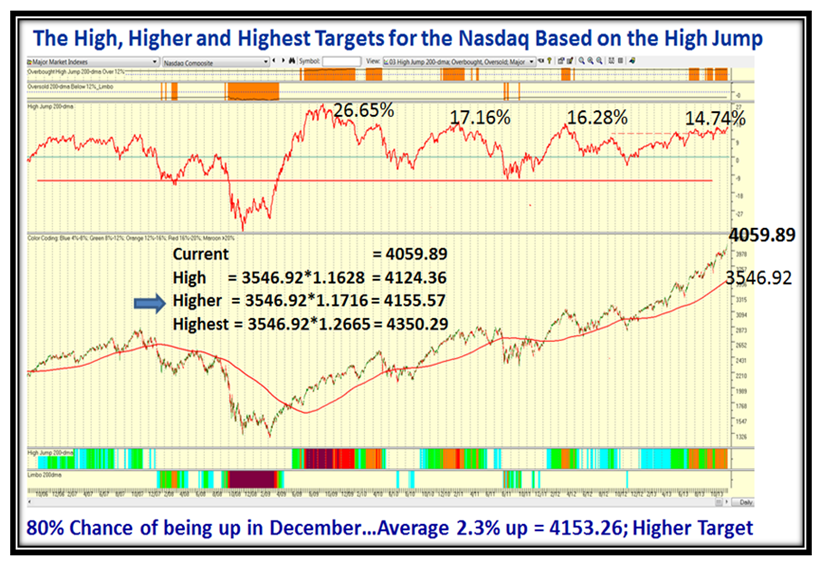
Yesterday along the way I captured this screen shot above when the NASDAQ was at 4274, and I direct your attention to the flatness of the High Jump since the December 24th Timeframe where it had not surpassed the 14.74% mark on the High Jump.  Going forward we need to see that broken to the upside and aiming for 16.28%.  That would be a clue that we are approaching 4350.  The second thing if we are lucky is that this next move is a climax run blow off and that we see an “Eureka” appear which would be a sign of a late stage exuberance for a climax run!  At that point we are well into “Greed” and so watch out below.

Yellen HJ4

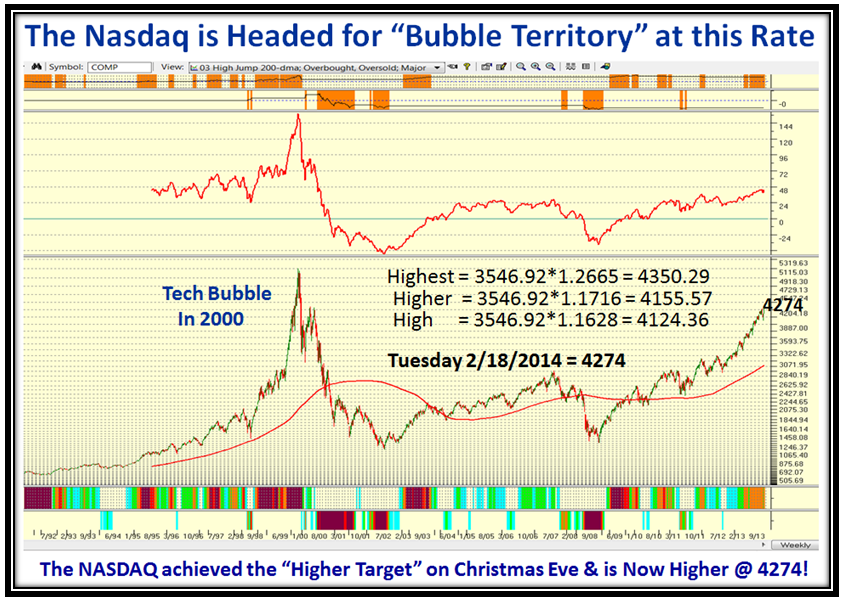
On this chart the Clue is the Weekly High Jump, which needs to spurt up to “72” before we get too excited, and if we are lucky that all of this should happen, then mark my words we will not only have met the 4350 Target but also be ready for a pratfall, which we have fortunately not had as of yet!

I am not a Soothsayer, but I have faith in the High Jump Tool which has served us well over these past 20 Years, and we shall see if it proves itself one more time.  Can the NASDAQ go higher than 4350?…yes, of course.  But let’s get there first is my point, if we are to go higher from here.  If not then you certainly know what to look for on the downside with -4% from the high and then -8% as the measuring rods!

Best Regards,

Ian.

Stock Market: Liked the January Jobs Report!

Sunday, February 9th, 2014

Here is Part 2 of the Blog Note on the Jobs Report with a tip of the hat to John Bollinger, aka jb:

Bollinger Picture2

The Bulls earned a reprieve with a strong rebound and follow through to the previous day:

Bollinger Indexes 2

The Russell 2000 (RUT) also bounced back, but is not out of the woods as yet:

Bollinger RUT

Now for my fun…who would have “thunk it”…Wonders never cease to amaze on the reaction to the Jobs Report:

Bollinger Jobs

The Acc:Dist ratio is still oversold at 0.65, and we need another 500 stocks in A+B to even get to Stalemate:

Bollinger abcde2

The Bulls have salvaged the Rally in the last two days, but now comes the real test to see if they can move higher:

Bollinger Pat2

Written while enjoying the Golf at Pebble Beach and the Ski-Jumping at the Olympics.  Give me your feedback!

Ian

Stock Market: The Jobs Report Tomorrow is Key

Thursday, February 6th, 2014

Those who know me well understand the respect I have for my good friend and neighbor John Bollinger for what I have gleaned from his Bollinger Bands over the years, and the fun I have had in using Bucketology, Grandma’s Pies and Kahunas Up and Down to keep you and me on the right side of the Market.

The last time I tipped my hat to him was on October 29, 2011 in these blog notes, so it’s time to do it again:

Bollinger Picture2

The Market Indexes all had a respectable 1% Bounce today.  The Jobs Report tomorrow will determine if the Bounce continues or we fall back into the abyss:

Bollinger Indexes

This next chart of accumulation vs. distribution shows that the Market is well oversold and gives us a measure of how much further it should go before there is a significant Rally:

Bollinger abcde

Here is the picture since we had that 45% of the S&P 1500 below the Lower BB on 2/3/2014:

Bollinger Pie

I know this next chart is a trifle busy, especially for newbies, but it sums up the current situation and tells you precisely what are the alternatives for the Bulls and the Bears going forward.  Net-net, the Jobs Report tomorrow had better be excellent to drive Kahunas up on all the Indexes as shown to get the Bulls to Rally and out of the control of the Bears:

Bollinger Pat

Good luck and good hunting,

Ian.

Stock Market: Garden Variety Pull Back or Worse to Come?

Tuesday, February 4th, 2014

Some pundits rightly say that we have had a Garden Variety Pullback so far, with an approximate 6% down from the Market Index Highs, but the Bigger Question is “Will it end around here or is there more to come?”  Which leads me to my usual picture of Custer’s Last Stand at times like these:

Custer Picture

The following picture of the Market Indexes a couple of days ago shows the strong shot across the bow to give the Bears complete control at that stage:

Custer Indexes

…And here is the damage done to the small caps Russell 2000 Stocks which has broken the sacred line:

Custer RUT

Here is a Measure of the Degree of Oversold in the S&P 1500 which has not been seen since April 2012!

Custer Pie

…And here is what it looked like around April 10 2012, which was one of the worst Oversold we have seen:

Custer Pie 2

The bottom line is that 12 Drummers Drumming, Grandma’s Pies, Bucketology, gives us ADVANCE clues of what to expect and the direction the wind is blowing:

Custer Nasdaq

Keep your powder dry and good luck,

Ian.

Stock Market: Gunfight at the OK Corral?

Saturday, February 1st, 2014

This past week we saw the chinks in the Bulls’ Armor, and with the Market Indexes all down ~ -4% from their highs, we are at the point now where things have come to a head between the Bulls and the Bears, and this blog note should show you the two Alternatives as to what is required for one or the other to win control:

Gunfight Picture

There have been signs of deterioration in the Rally this past few weeks as I have signaled in my recent blog notes and all Market Indexes dropped from the sky to sit below the Lower Bollinger Band for four of the last six trading days.

We are now oversold and can either muster a strong follow through to the bounce play we had on Thursday of this past week or we fall into the abyss and head down to the -8% level from the Market Indexes Highs. Sure, there are other alternatives, but the following charts will show you these two as the key alternatives:

Gunfight Indexes

…And here is the Russell 2000 (RUT) which is again threatening the Trend-line of the past year:

Gunfight RUT

Now let’s turn to the Internals of the Market with the Accumulation vs. Distribution picture, which again confirms that the overall bias is distribution:

Gunfight acc

The VIX has shot up precariously in the last few days where it is now at a dangerous level for a possible Whoosh, though in the same breath you can see that on the last five occasions it has always retreated:

Gunfight VIX

So, with all of the above as the good fodder to whet your appetite, let’s see if we can put the clues together to arrive at the two core strategies  for the Bulls and the Bears for this coming week.  In the top portion of the chart you will see that there has been a splatter of “Red” at the bottom for all the Market Indexes, but more importantly four of the six days they were BELOW the Lower Bollinger Band.  That said, you also know that it is unusual for this to stay this way and with the move shown in Blue on the bottom left on Thursday we had the bounce from an oversold state, which took the Indexes back above the Lower BB.

For the Bulls to capitalize on Thursday’s move they need to drive early this week with another series of Blue Kahunas upwards on Monday or Tuesday at the Latest, which is shown in the middle of the chart.  On the other hand, if the Bears are to maintain control they need to drive a set of negative Kahunas as shown in the lowest part of the chart.

Gunfight Pat

To wind this up let me also show you a chart of the Nasdaq which also shows the symmetry of the situation and the ripeness for either a new move upwards or a fall from the skies for a decent correction, which is overdue:

Gunfight Nasdaq

Good luck to you all and happy hunting.

Ian

Copyright © 2007-2010 Ian Woodward
Disclaimer: Commentaries on this Blog are not to be construed as recommendations to buy or sell the market and/or specific securites. The consumer of the information is responsible for their own investment decisions.