Ian Woodward's Investing Blog

Archive for April, 2014

This Stock Market is in Code Red!

Sunday, April 6th, 2014

I suggested in my last Blog Note that a mediocre Jobs Report would send the Stock Market into a tizzy and head down, and that is what happened with most Market Indexes down 4 Buckets.  Another day like Friday and the Bears will have full control, and you and I will worry about being trampled at the exits, and saying “Coulda, Shoulda, Woulda!

Code Red Picture

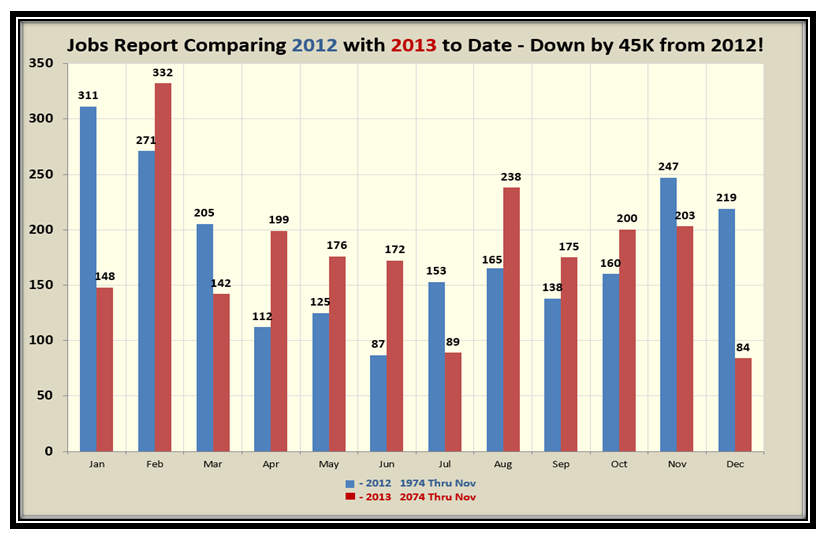
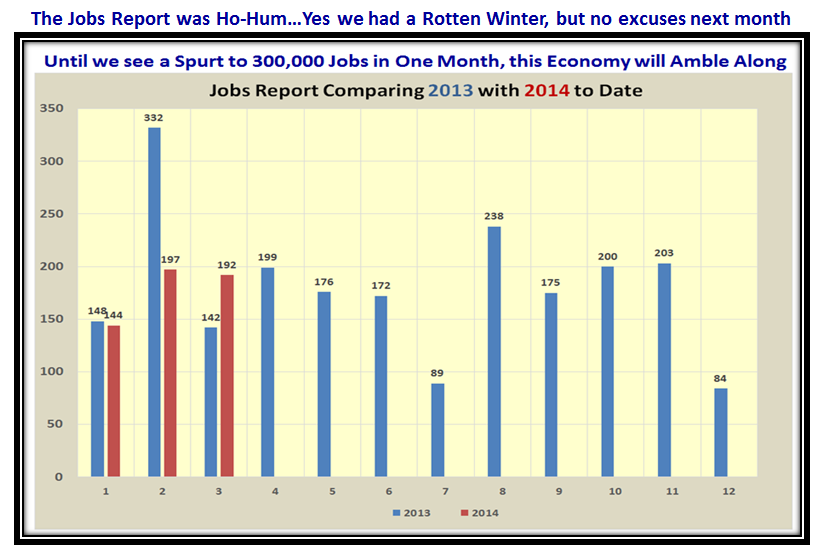
We have had fifteen months of ambling along with the Jobs Report numbers, and unlike last month where the Market felt they were good, we got a trouncing for being essentially at Stalemate.  Here are the numbers for 2013 vs. 2012 and then the first three months of this year compared to last year:

Code Red Jobs1

Code Red Jobs2

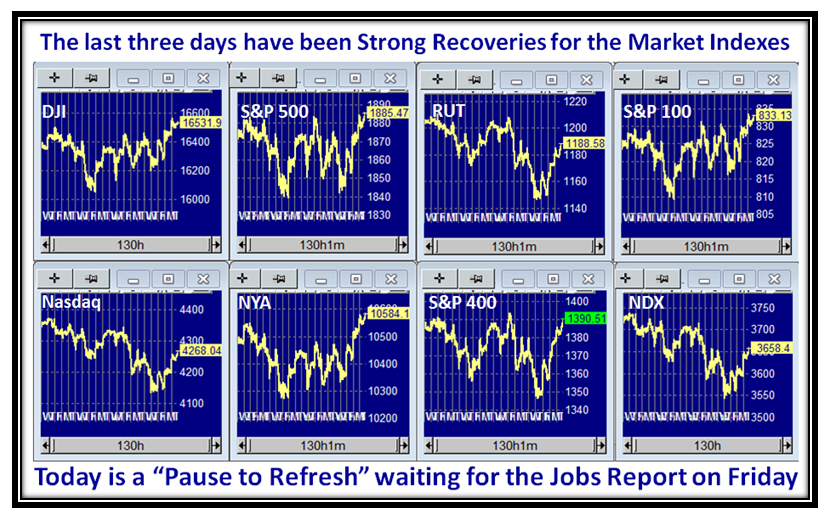
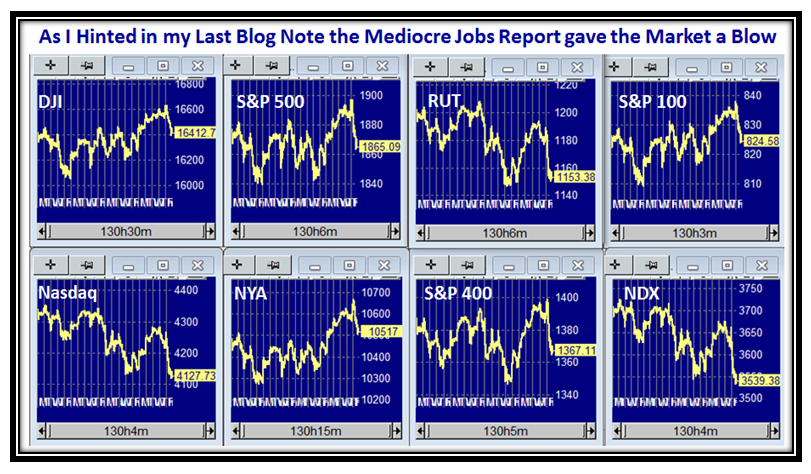
Here is the picture of the Market Indexes over the past month, which shows they have been struggling:

Code Red Indexes

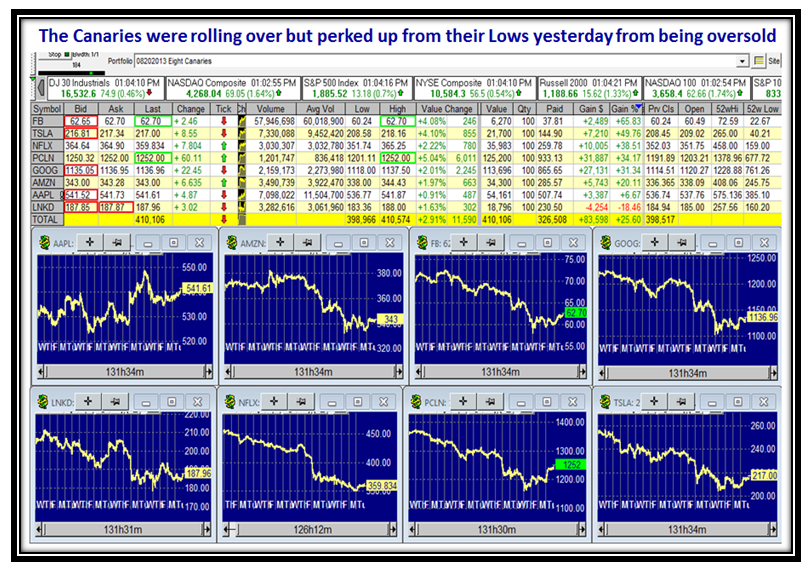
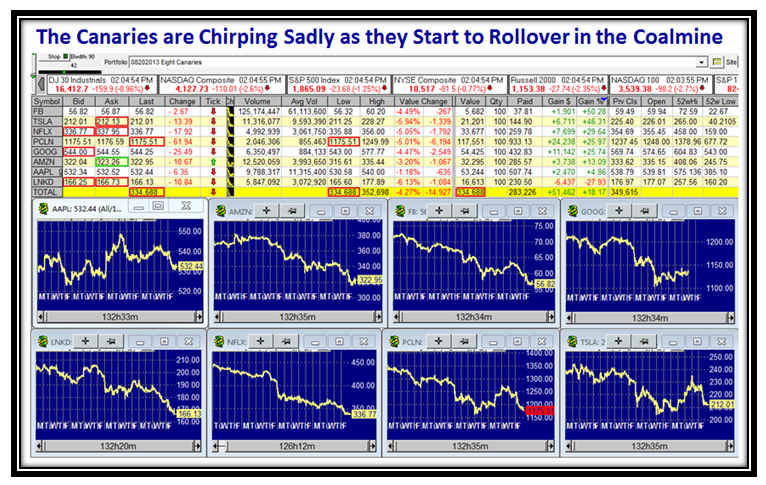
Needless-to-say the Canaries took a beating and are rolling over from their highs of a month ago:

Code Red Canaries

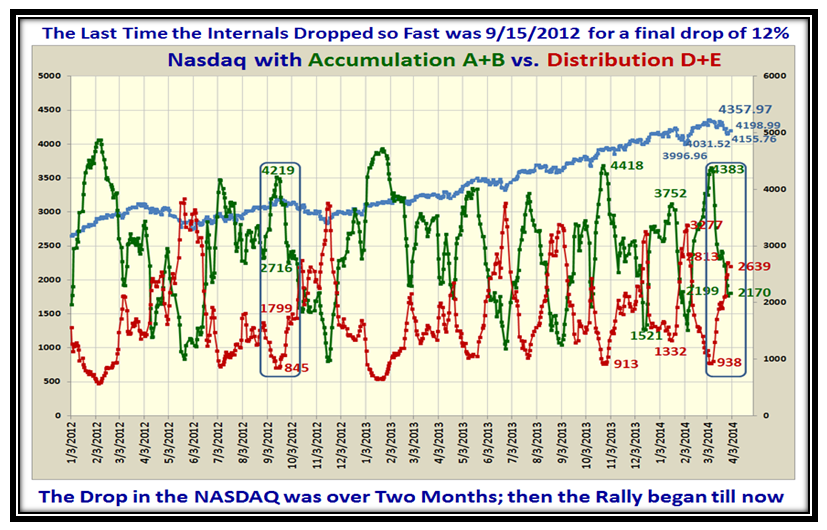
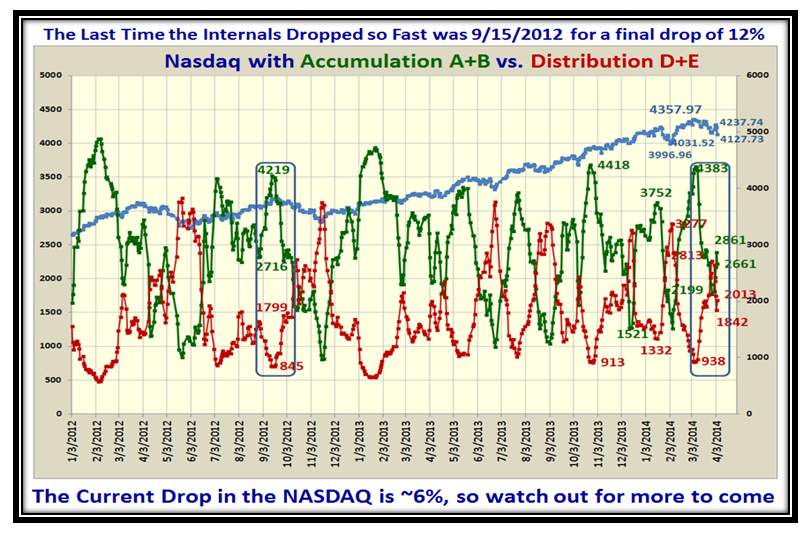
The Accumulation vs. Distribution Ratio bounced up to 2861 vs. 1842 and has slid back to 2661 vs. 2013:

Code Red abcde

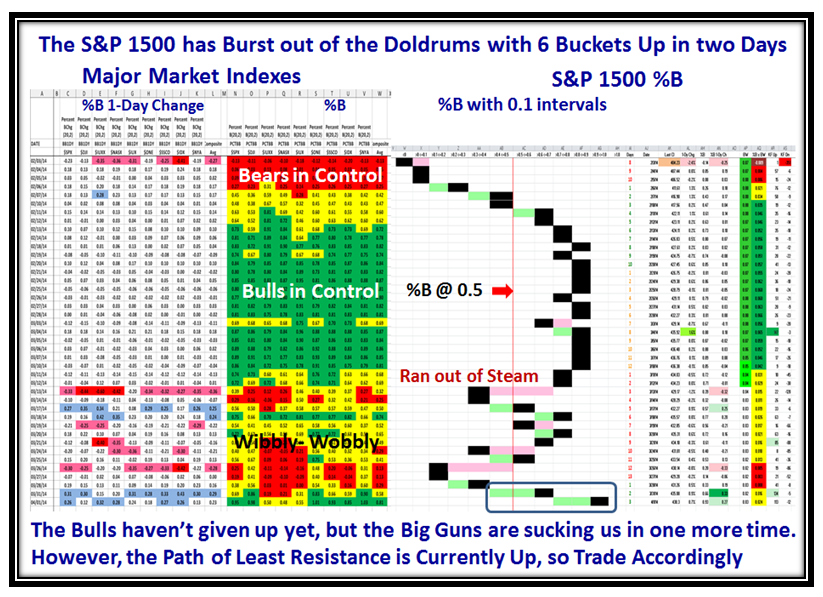
After the 4 Bucket down day on Friday, the path of least resistance is down once again:

Code Red Pat

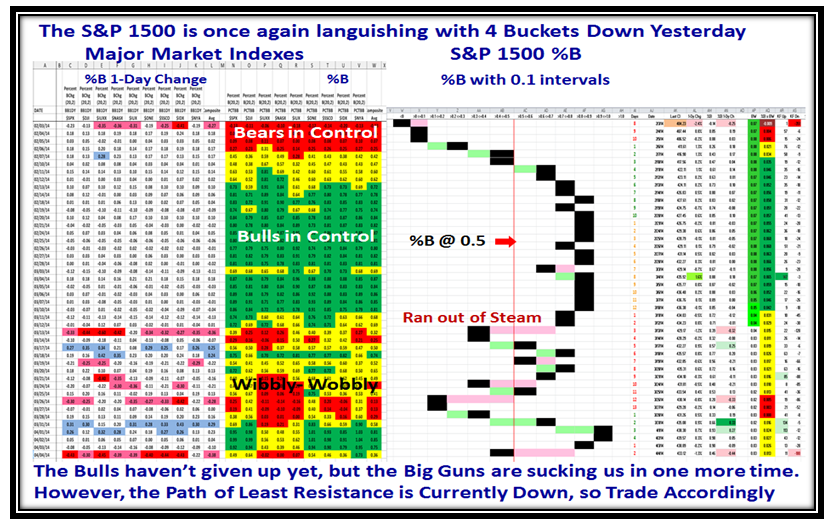
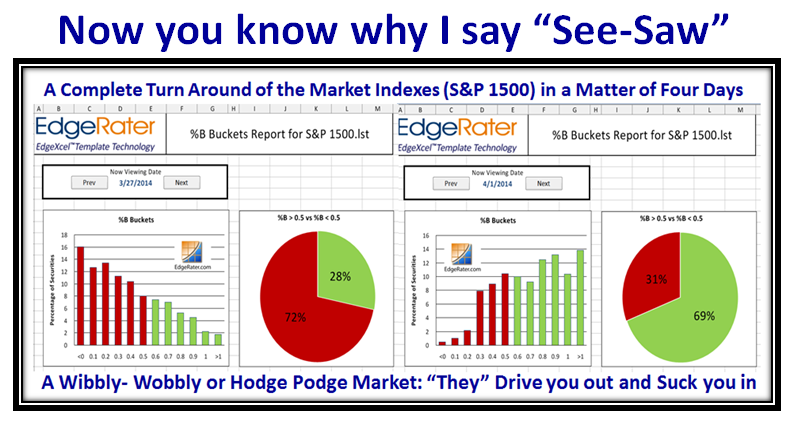
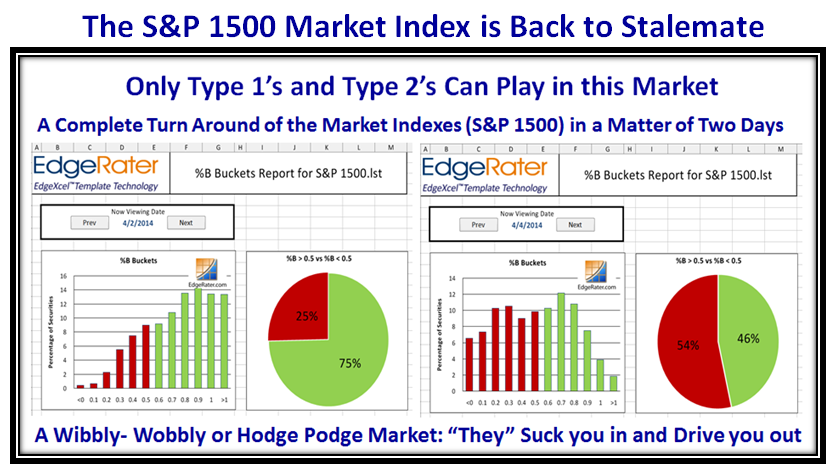
…And Grandma’s Pies show the instability with the S&P 1500 back to Stalemate in 2 days:

Code Red Pies

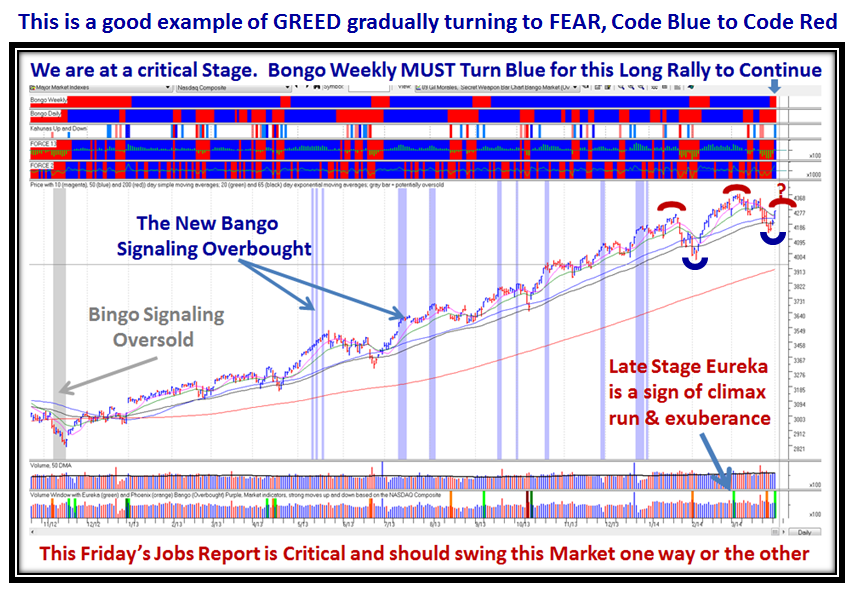
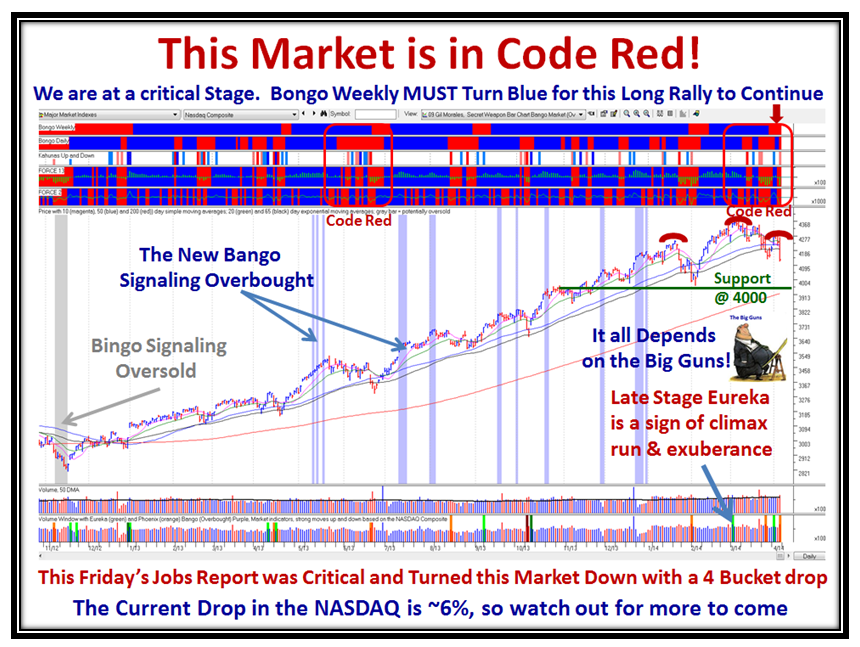
Here is the chart that summarizes it all and shows you why the Market is currently in Code Red!

Code Red Gil

Have a Happy!

Ian.

Stock Market: See-Saw and a Climax Run Market

Wednesday, April 2nd, 2014

I am back from an exhilarating and exhausting three day seminar at Sunny Palos Verdes, and Ron and I thank all of you our supporters for a rollicking good time.  The Newbies now know how to read my blog and the winky-winkies I give from time to time.  The first Picture chart usually spills the beans of what I think:

See-saw Picture

Unlike last Month where the Stock Market reaction to the mediocre Jobs Report was surprisingly good, this month’s report due on Friday should give us a better indication of the health of the economy here in the USA.

See-saw Indexes

Here is the performance of the Canaries which have essentially rolled over from their highs, but are still hanging in there:

See-saw Canaries

The Russell 2000 (RUT) suffered about a 5% loss from its high, but true to form turned up once again.  Before it breaks that trend-line hard is when we should all run for the hills and that should be when 1000 is broken to the downside:

See-saw RUT

We are now at that Critical Juncture I warned about of at least a 12% Correction since the Acc:Dist ratio is below 1.0 (Stalemate) and now we wait to see if there is a gigantic recovery in the Internals of the Market or it gently fades away:

See-saw abcde

Grandma’s Pies says it all…a complete turn around of 6 Buckets up in a matter of four days.  Now What?

See-saw Pies

The Path of Least Resistance is up, so play it that way until you get another Knee-jerk down.  Counting today, we are now into Day 4 of Twelve Drummers Drumming, so keep a beady eye on that count:

See-saw Pat

Here is nice new chart to digest, which shows the critical signals we have had in the past few weeks that tells the story:

See-saw Code Blue

Well, that’s it for today.  Keep your powder dry and your nest egg whole is job 1!  Write a comment to give me feedback.

Best Regards,

Ian

Copyright © 2007-2010 Ian Woodward
Disclaimer: Commentaries on this Blog are not to be construed as recommendations to buy or sell the market and/or specific securites. The consumer of the information is responsible for their own investment decisions.