Ian Woodward's Investing Blog

Archive for June, 2014

Stock Market: Protect and Grow Our Nest Eggs
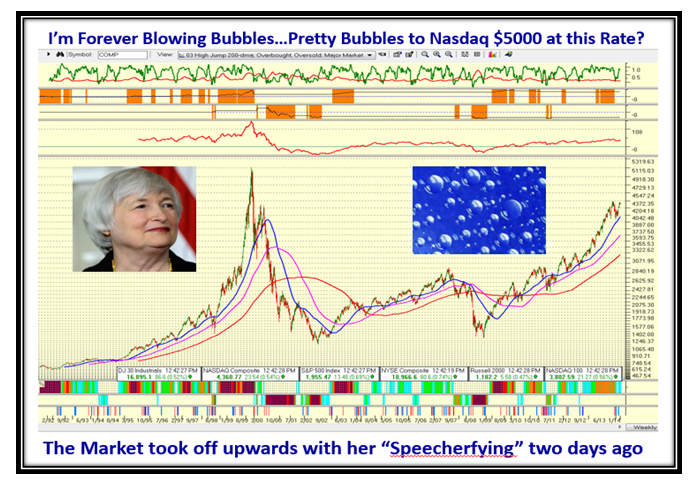
Thursday, June 26th, 2014

At times like these, I like to remind my supporters that my aim with this blog is to Provide Insight at Market Extremes of Fear and Greed to Protect and Grow our Nest Eggs.  We are now at an Extreme which can go up further but it is time to take stock of where we are and to show you how I manage such times:

Greed Picture

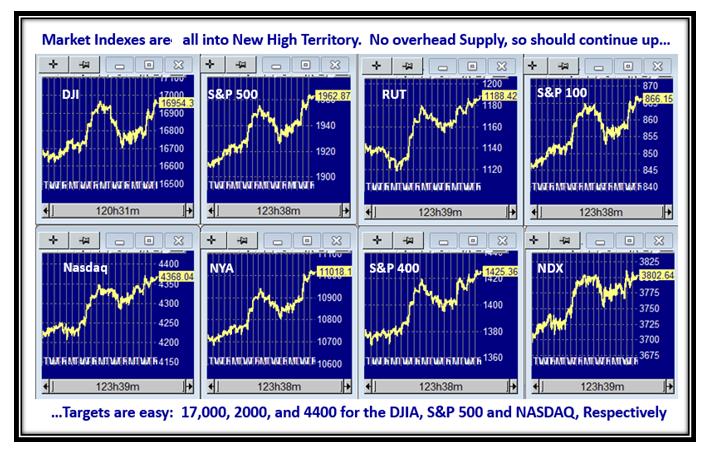
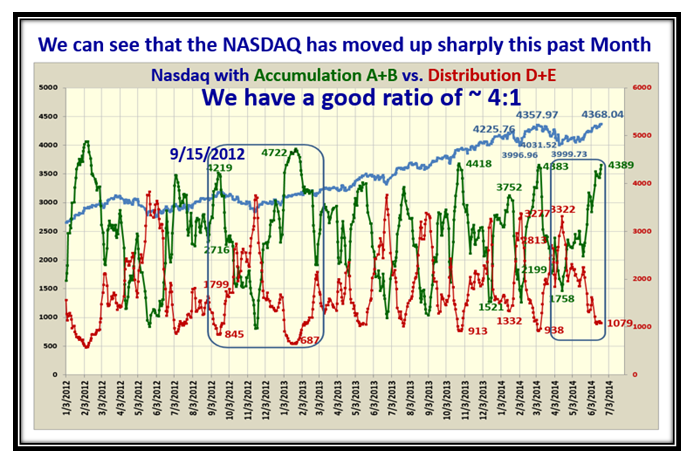
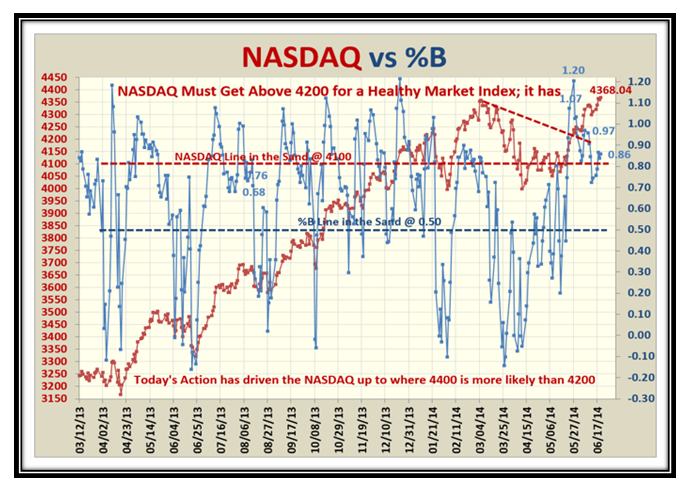
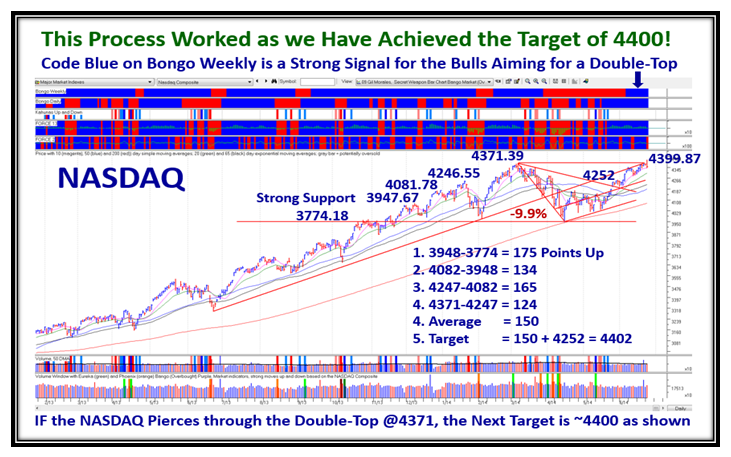
An earlier Blog Note gave you the target for the next step up in the NASDAQ of 4400, and by jove we did it:

Greed Nasdaq

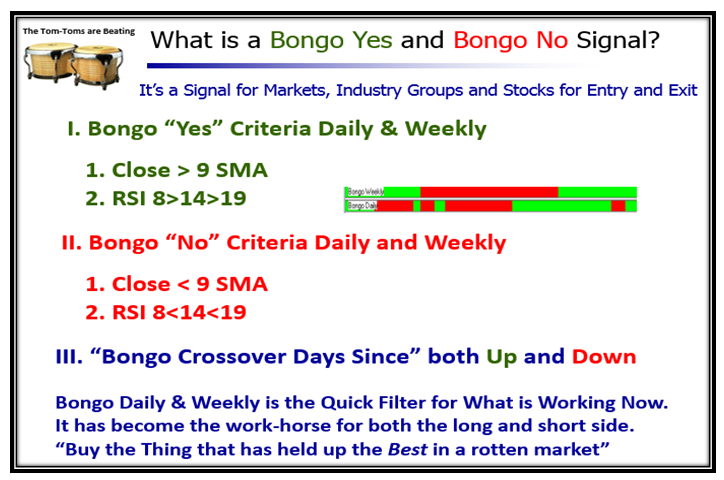
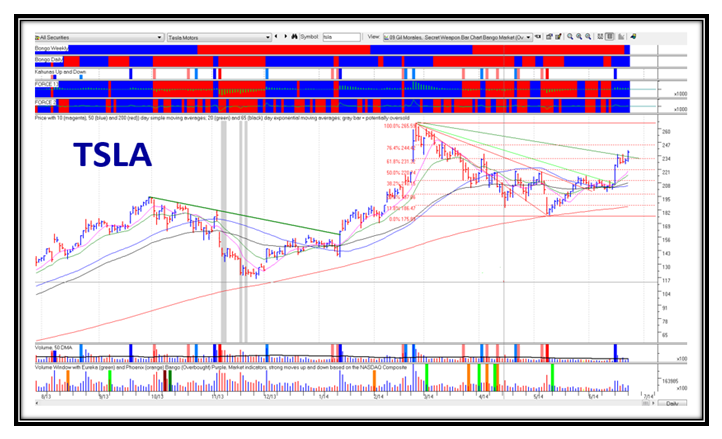
For those of you who are not familiar with the term “Bongo Weekly or Daily” here are the definitions:

Greed Bongo

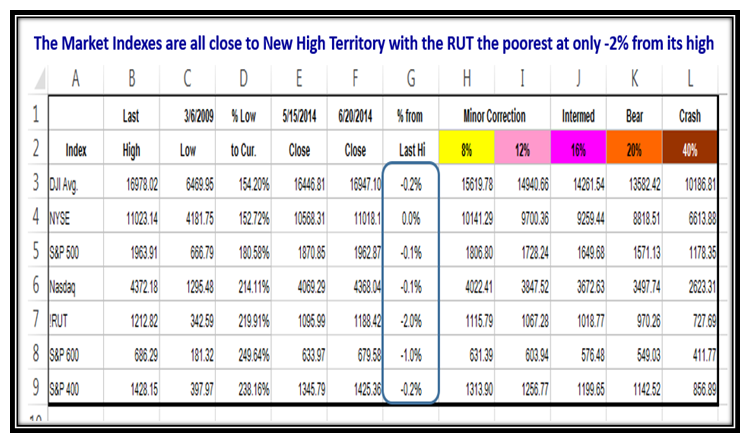
This next chart is worth its weight in gold, as it shows the percentages for various types of Corrections:

Greed Indexes

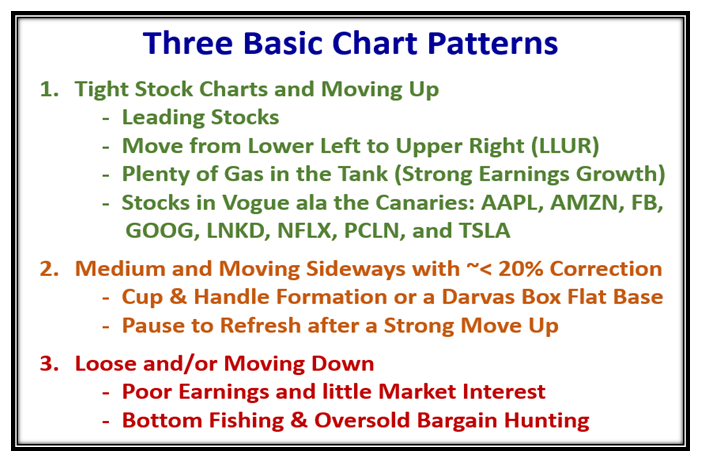
To simplify chart patterns, I work essentially with three basic types as shown below:

Greed Charts

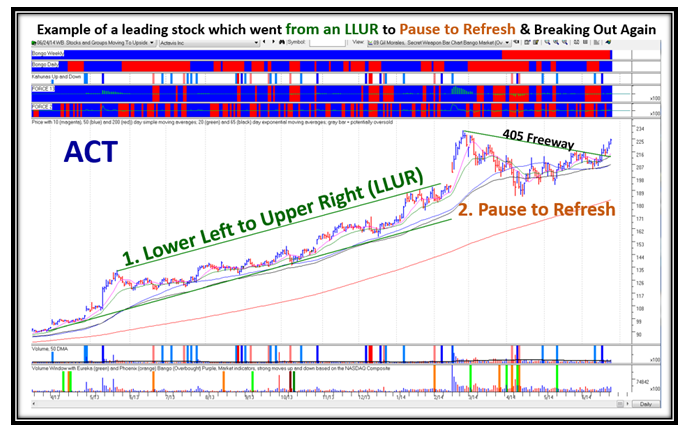
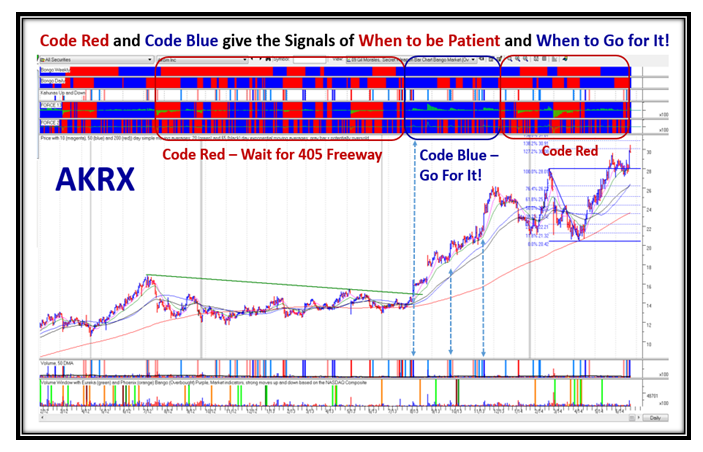
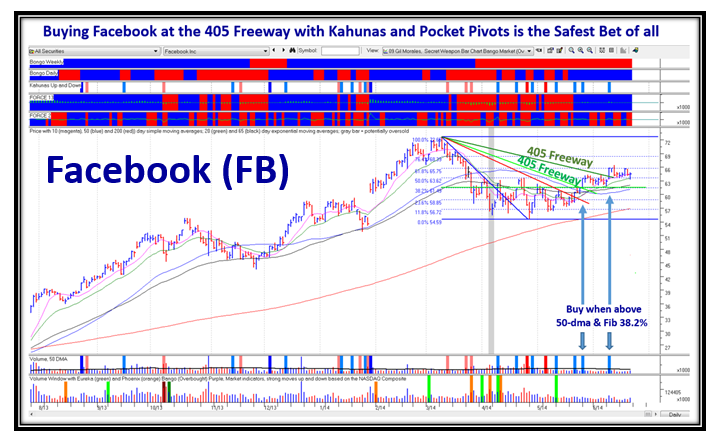
Here are four examples showing entry points based on Code Blue as shown below:

Greed ACT

Greed AKRX

Greed FB

Greed TSLA

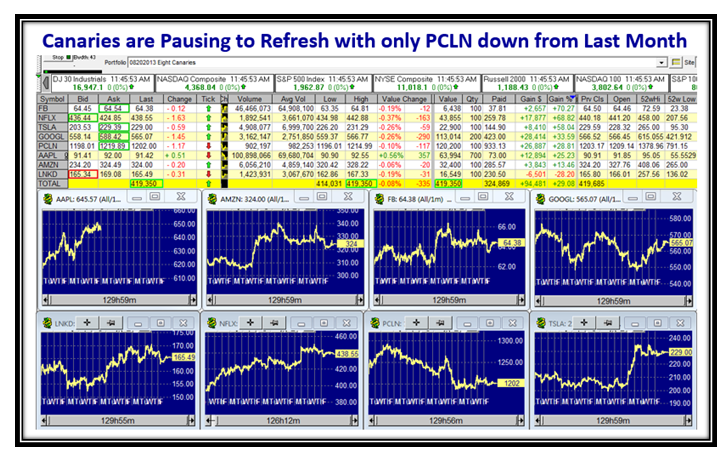
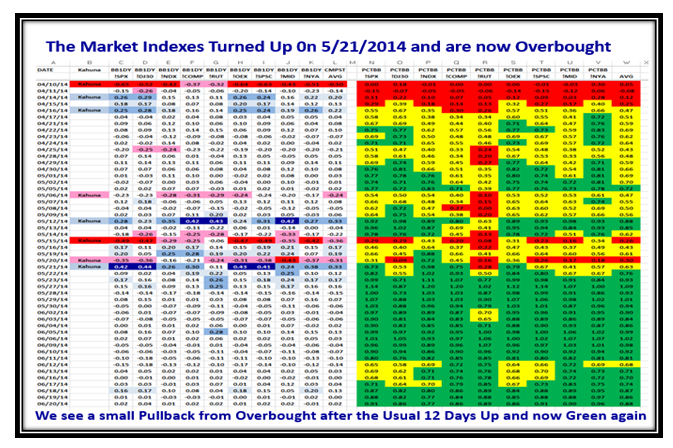
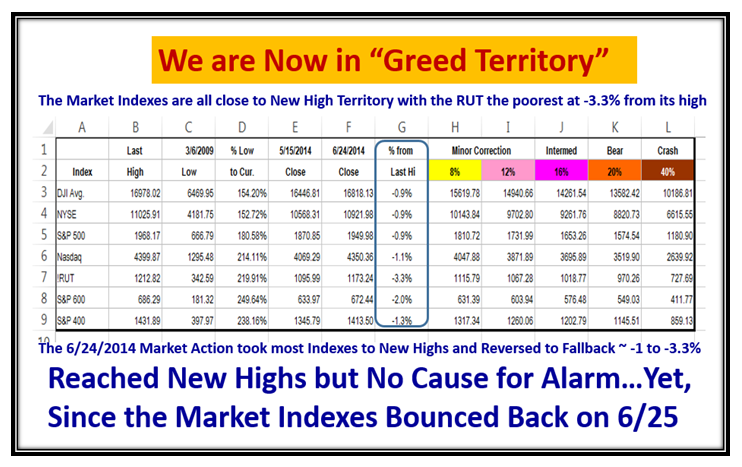
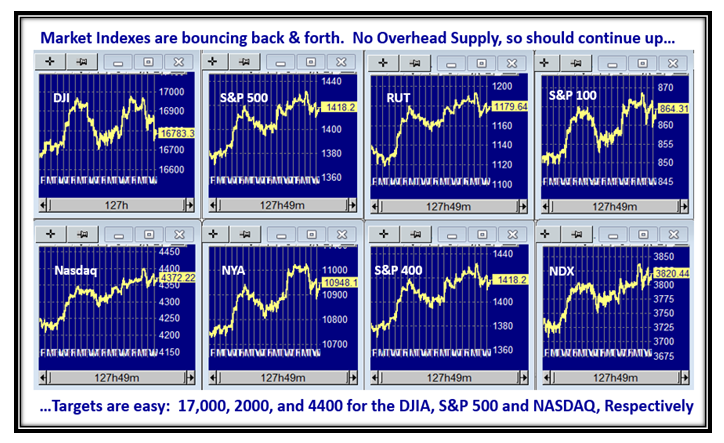
The Market Indexes have been a bit jittery these last few days both up and down, and here is a snapshot I took earlier in the day before the market closed:

Greed Indexes2

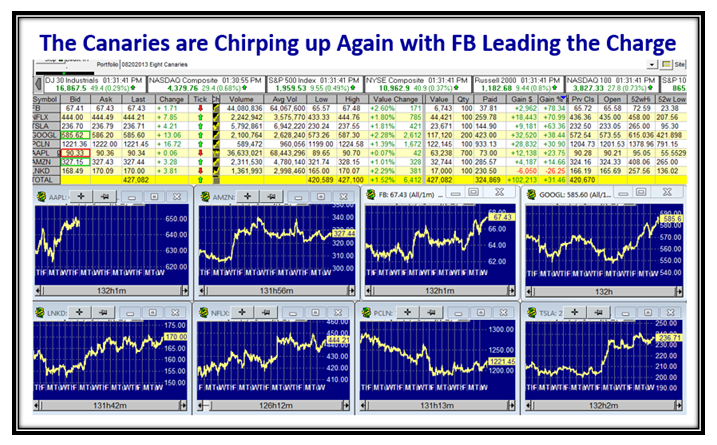
The Canaries were chirping up strongly yesterday and here is that snapshot…down a bit today.

Greed Canaries

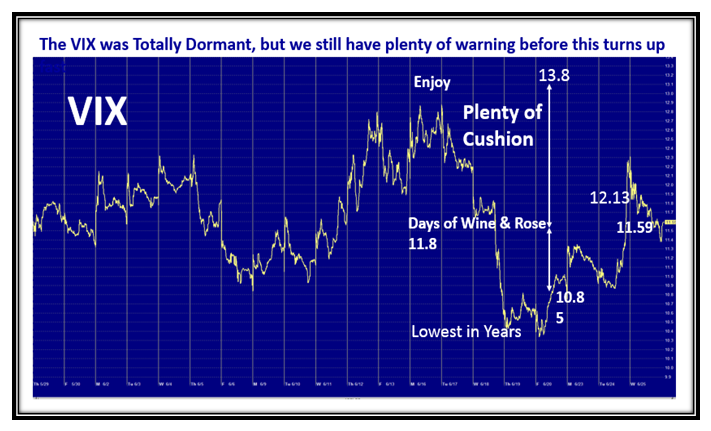
The VIX is still behaving quiet and we have plenty of Cushion:

Greed VIX

The A+B : D+E Ratio peaked at 4.1 and has backtracked these last three days, but still strong:

Greed abcde

One of these days the markets will take a whacking, but for now they are still striving and struggling to go higher and as I showed you we are now well into Greed Territory, so play things close to your chest with tight stops.

Best Regards,

Ian.

Stock Market: Will Soon Be Reaching “Bubble” Territory

Saturday, June 21st, 2014

I just couldn’t resist showing you how the Market behaved as Ms. Janet Yellen was pontificating to the Senate despite all the turbulence around us with concerns of the situation in Iraq uppermost on our minds:

Bubble Picture

The Market Indexes have all reached double tops, so we either pull back again or burst out upwards next week:

Bubble Indexes

The Canaries have behaved relatively well during this period, but pausing to refresh at the moment with PCLN lagging:

Bubble Canaries

This next chart is worth its weight in gold and summarizes where the Markets stand relative to the New Highs they have just made and when you need to have taken some form of action if they all drop violently towards -8% Corrections:

Bubble Big Foot

As we would expect the Accumulation: Distribution ratio of A+B:D+E has now reached a comfortable 4:1. so good cushion:

Bubble abcde

The Markets have settled down again with %B for the Indexes all in Green Territory, with only a minor correction last week:

Bubble Indexes2

Likewise the picture of the behavior of the S&P 1500 looks equally good as we once again rise towards Overbought territory:

Bubble Pat

Grandma’s Pies Confirm the see-saw action of two months ago and the current strong performance of the last few weeks:

Bubble Pies

We are a long way from being at the lows of %B with a reading of 0.86, but when the rot sets in, it trots down fast:

Bubble Nasdaq

…And here is a similar picture for the S&P 1500…the value is in the Consistency of the Tops and Bottoms, so we can act:

BubbleS&P1500

Now for the Jobs Report of a week ago, where at least they are encouraging with the past four months above 200,000/mo:

BubbleJobs 1

…And here is the comparison to last year.  Since the next two months for last year are low, there is hope!

BubbleJobs 2

I trust all of this was worth waiting for?!  Enjoy.

Ian.

Copyright © 2007-2010 Ian Woodward
Disclaimer: Commentaries on this Blog are not to be construed as recommendations to buy or sell the market and/or specific securites. The consumer of the information is responsible for their own investment decisions.