Stock Market: The Bubble Continues Upwards and Onwards
The Stock Market remains strong and continues to move upwards and onwards. Yes, we had a pull back today with a pause to refresh, but there does not seem to be any signs of fatigue:
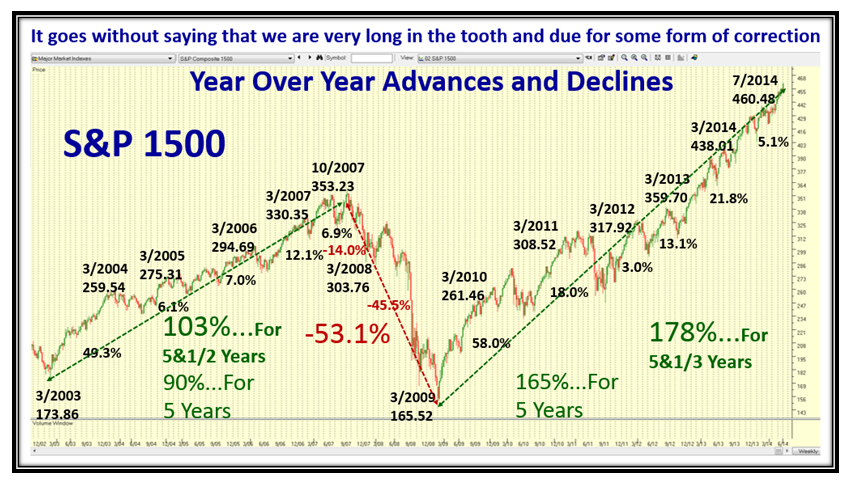
Looking back over the history of the S&P 1500 since March 2003, it became evident for the purpose of our needs that measuring from March to March rather than the usual Calendar Year gives us a handy picture, since both Key Market Lows were in March of 2003 and 2009, and most highs before a correction have also been in March! Anyway, the numbers are nicely summarized for you:
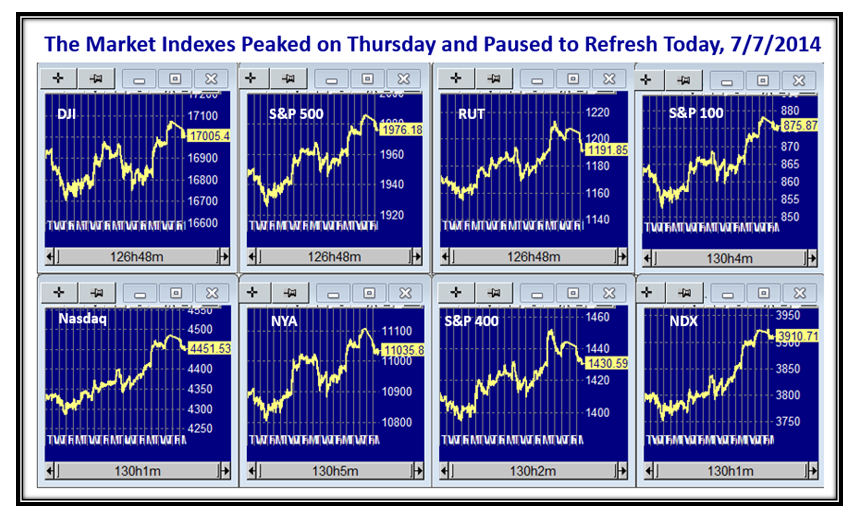
It doesn’t take two minutes to see that we are very extended, but play along with one eye on the exits and tight stops. We had a pullback today, but until we see a 2% drop in one day will there be any sign that there is a start to the correction in earnest:
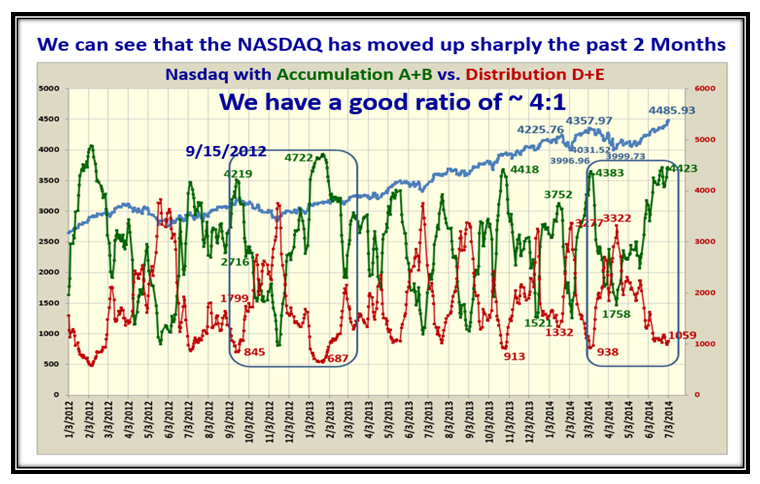
The Acc/Dist Ratio remains strong at 4:1, but is showing signs of peaking and is at Historical highs:
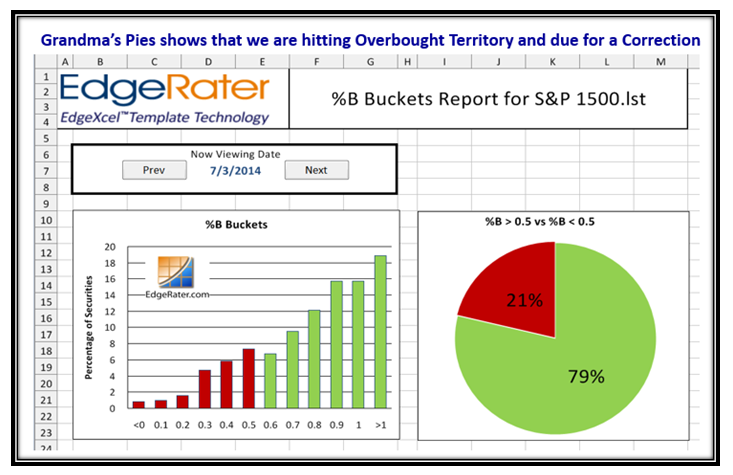
Grandma’s Pies also confirms we are in overbought territory, and it was expected we were on borrowed time for a pullback:
We have had a long run of five weeks where the bulls have led the way, and today we had a pullback as we would expect:
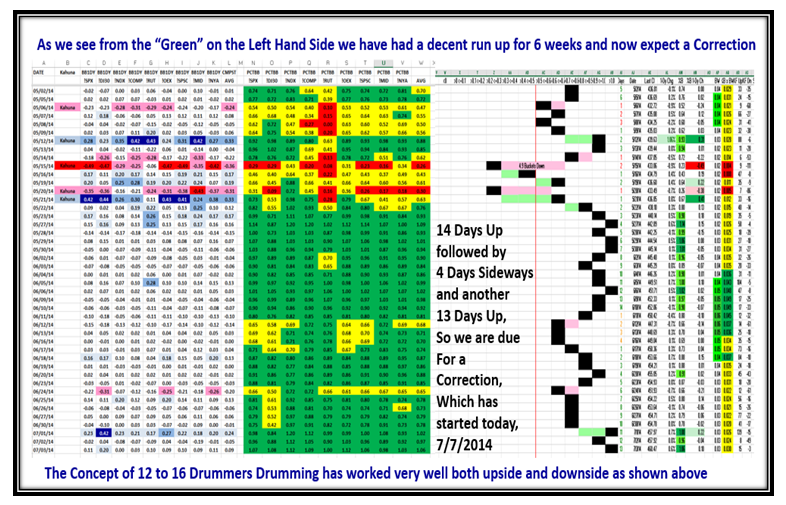
Here’s a new chart for you to digest which demonstrates that the normal cycle for %B up, down or sideways is between 12 and 16 days:
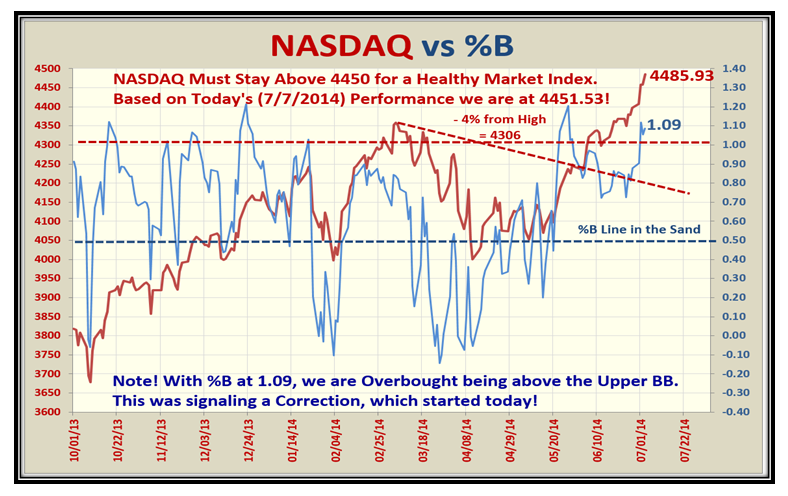
The NASDAQ almost reached its next target of 4500 before the pullback today which held at 4451.53:
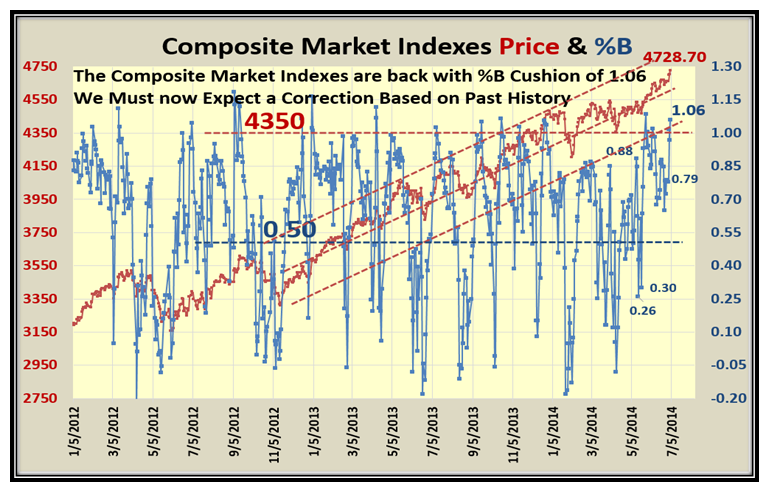
This next slide shows the same parameters but this time for the Composite of ALL eight Market Indexes which also shows that %B is above the Upper Bollinger Band at 1.06. We can also see that this is the area where things peak and we are due to correct:
Now for a change in topic…the Jobs Report which is looking a lot better of late, and maybe a sign of a Better Economy to come:
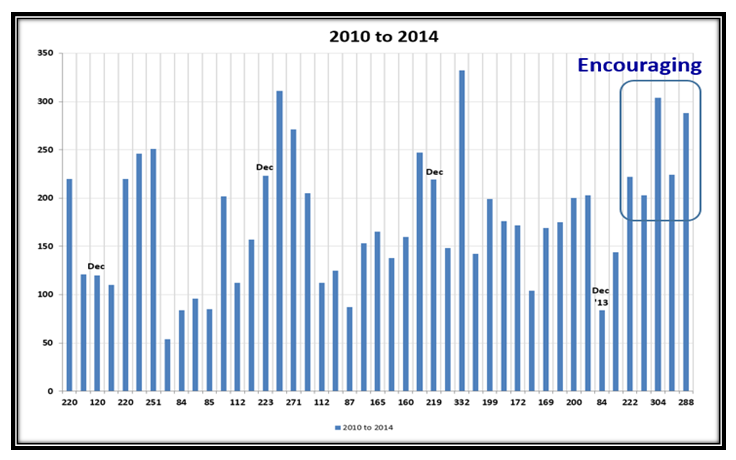
…And here is the History for the monthly Jobs Report since October 2010, which shows the recent reports are encouraging:
Good luck and Best Regards,
Ian
 Ian Woodward's Investing Blog
