Stock Market: Rounded Top Action for the Festive Season
After a long Rally for Thanksgiving, the Stock Market has been a nightmare to trade in, up down and round about!
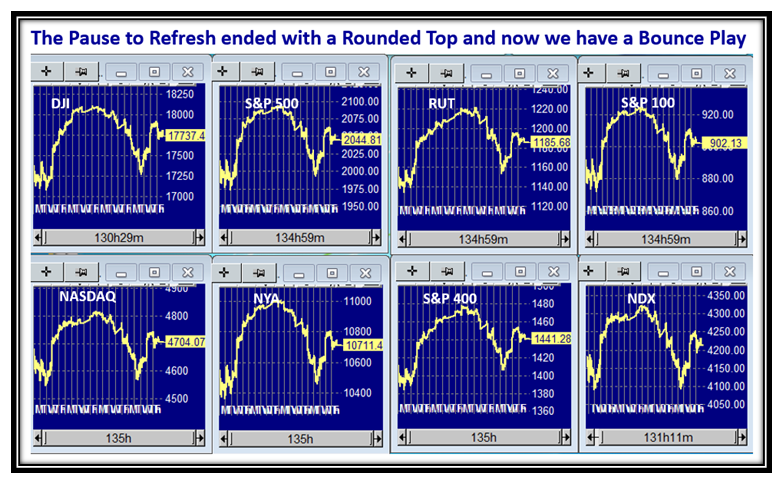
…And to prove it, here is the action of the Major Market Indexes over the last 20 Days:
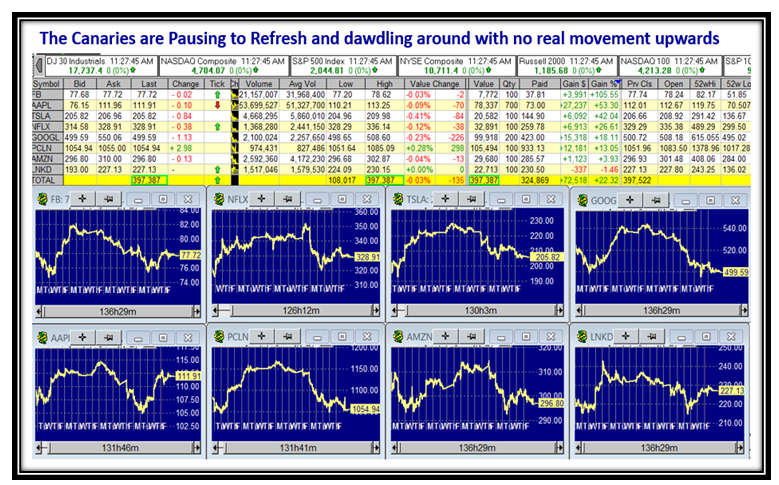
Likewise, the Canaries have been trotting around doing nothing spectacular:
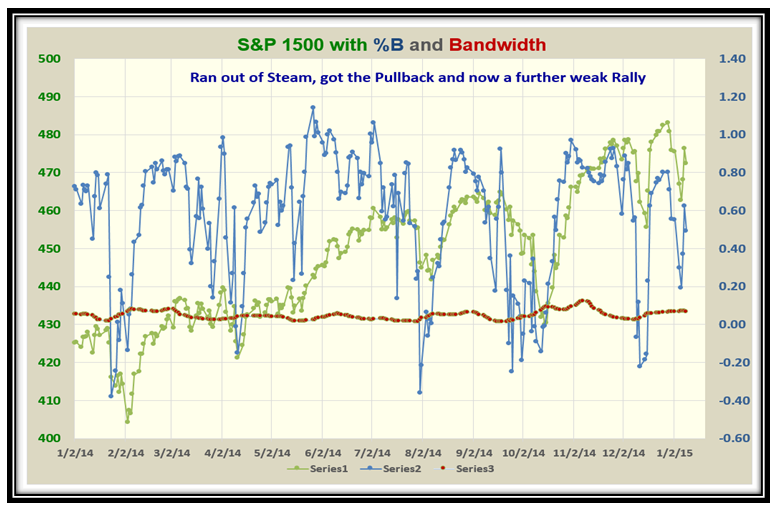
The S&P 1500 %B shot up with the Thanksgiving period and then has wobbled around with a weak Rally:
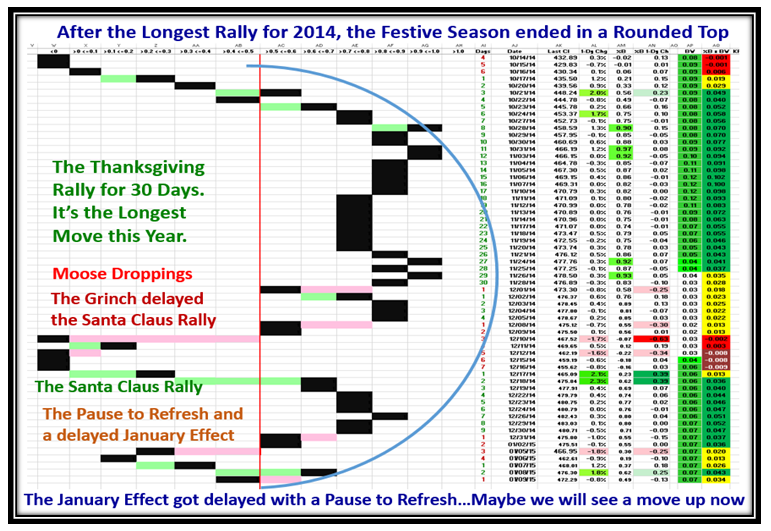
This next chart demonstrates the various phases we have suffered after the strong period prior to Thanksgiving:
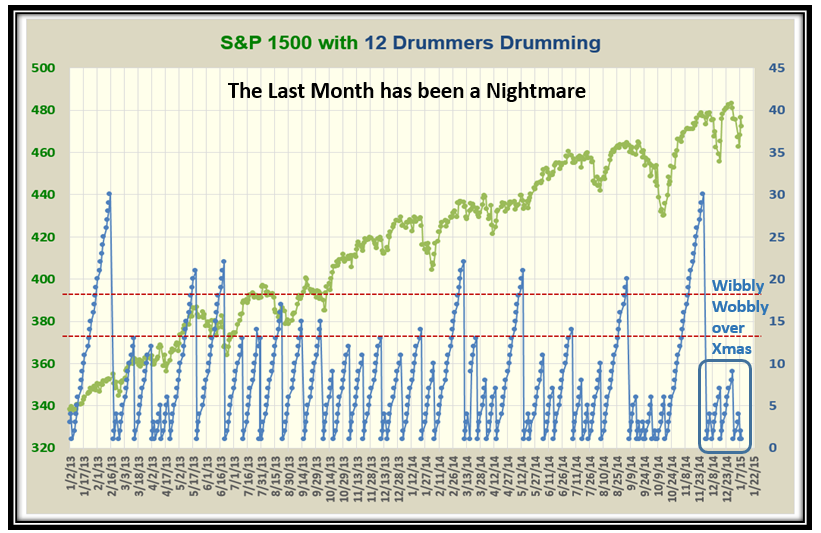
The Twelve Drummers Drumming chart shows the periods of up, down and sideways very well, and we see recent turmoil:
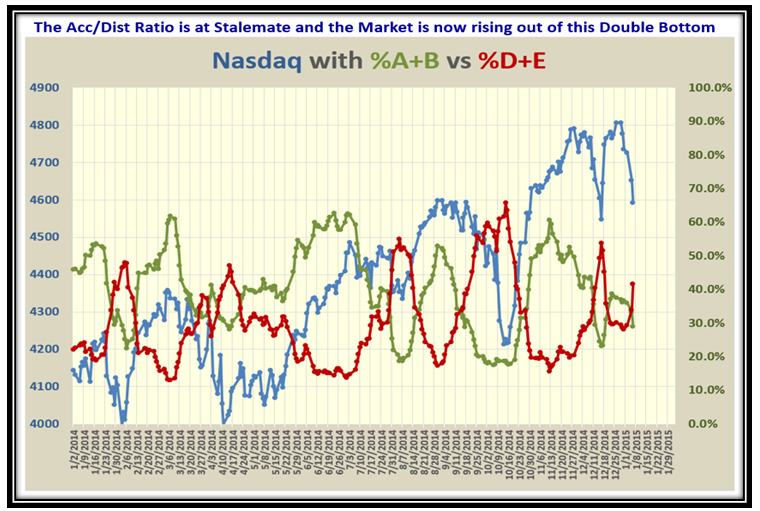
This chart shows clearly the Stalemate we are in with %A+B below %D+E stocks under Accumulation/Distribution:
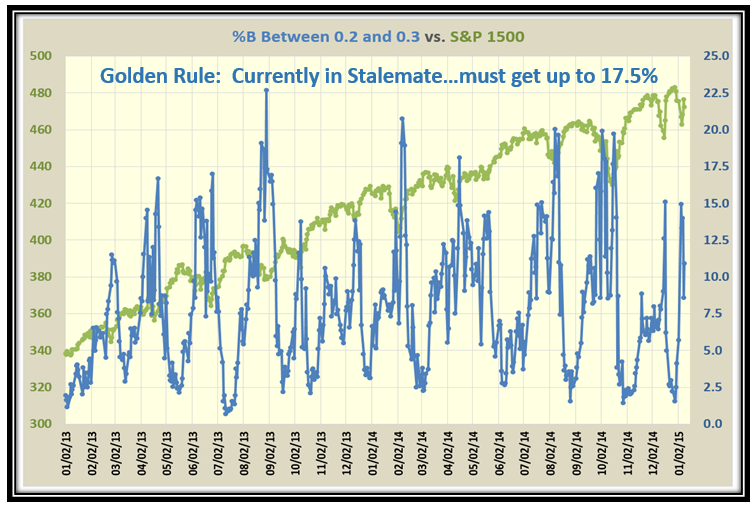
As I have taught you in previous recent charts, the biggest clue as to when the Market has completed correction is when the % of Stocks in Bucket 0.2 to 0.3 is >17.5%. We are currently at ~11.0% so we are not there yet and we need to be patient…hence, the market can go in either direction starting next week:
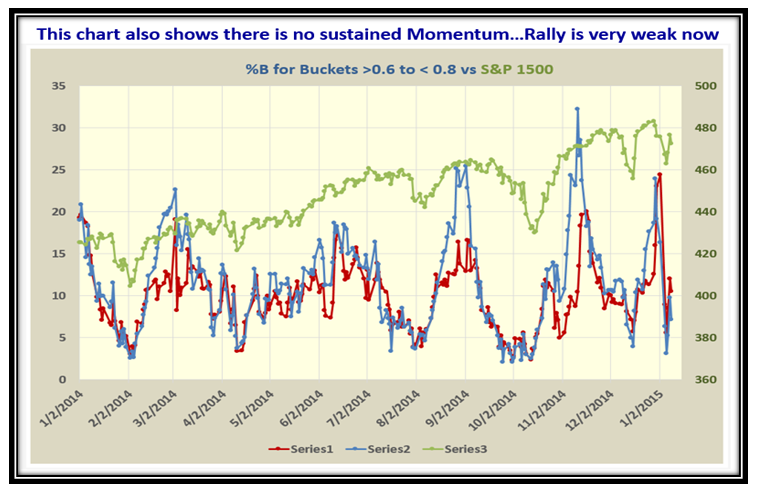
…And, as you would expect, when we examine a higher Range of %B, such as Buckets >0.6 and <0.8, the Rally is very weak:
Net-Net, the January Effect was delayed and essentially fizzled, so we shall see if the Small Cap stocks pick up from here. Be patient and remember the stake in the ground at this point in time between the Bulls vs. Bears is Stalemate:
Happy New Year!
Ian.
 Ian Woodward's Investing Blog