 Ian Woodward's Investing Blog
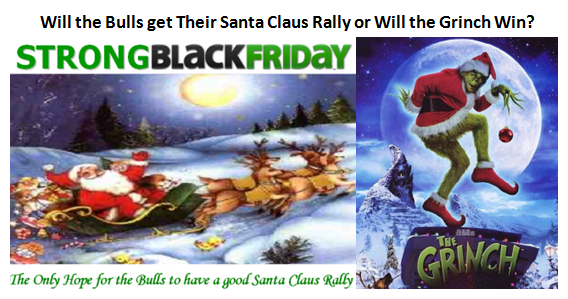
Santa Claus Rally Or Will The Grinch Win?
Last week it looked as if nothing could stop a Santa Claus Rally with a 12% climb out of the doldrums, which was the best bounce in 34 years. This week is the Grinch’s turn with a 5 to 6% drop in the Indexes and the announcement by the National Bureau of Economic Research (NBER) that we were officially in a Recession since December of 2007.
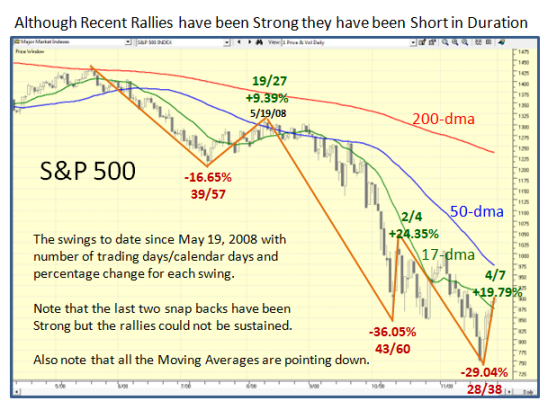
The next chart shows the swings that have occurred since May 19, 2008 on the S&P 500. While the last two rallies have been strong bounce plays, the duration of the rallies have been miniscule. We need a sustained rally of a few weeks for us to have a bona fide Santa Claus Rally which together with the “January Effect” could take us into the New Year. So far, all we have had are snap backs from short covering and an oversold market, with bottom fishers trying their best to call a bottom.
The latest bad news to put the kibosh on a decent rally so far is the annoucement by the NBER that we are officially in a recession, and the threatening bad news of a rotten jobs report to come. On the other hand, the Black Good Friday delivered a 3% improvement over last year in the shopping spree by consumers to at least give the retailers’ some hope of a decent outlook for the rest of the season. Also, let us not forget that the price of Gas at the pump is now cut in half and in most places just below $2.00 a gallon.
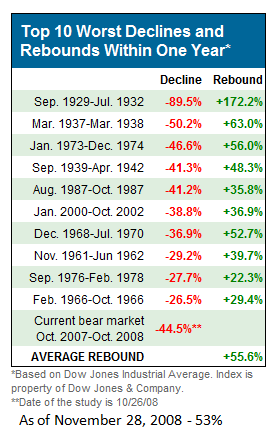
For posterity sake, the snapshot below shows the Ten Worst Declines and Rebounds in One Year, so to look on the cheery side of things, we can but “Hope”!
For the near Term Game Plan, the Targets are simple. I showed you before that the inter-day bounces for the S&P 500 is of the order of 40 to 50 points…between friends. On the chart below, I have mostly used 40 points but also tied the lines of demarcation to important past events. I show an ugly, bent out of shape Cup and Handle where the bottom of the handle at 840 is the last vestige of support for the Bulls.
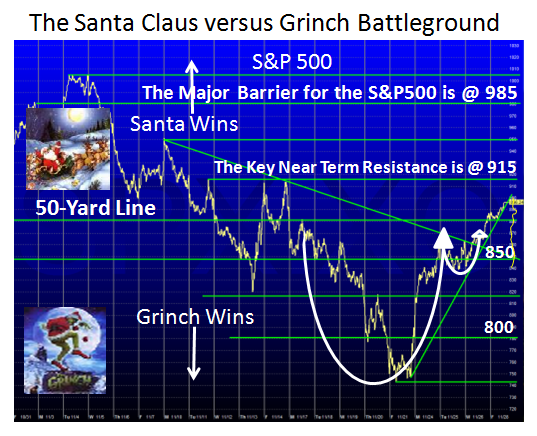
The Lines in the Sand are simple to remember:
1. 850 or thereabouts must hold or the party is over
2. Anything below 800, the Grinch wins and we fold our tent for a Santa Claus Rally
3. The S&P 500 must break through near term resistance at 915 and then deliver the goods above 985, or call it 1000 as that is an easier number to remember. Note that would mean a 35% Rally from the bottom.
The bottom line lesson is “Plan your Work, and Work your Plan”.
Types 1 and 2 Short-term Traders…enjoy
Type 3 Swing Traders…wait a bit
Type 4 Buy and Hold…”Go to Sleep, Go to Sleep, close your big bloodshot eyes!”
My Grandsons enjoyed me singing that to them over the Thanksgiving Holiday, when tucking them into bed.
Best Regards, Ian.
