Ian Woodward's Investing Blog

Author Archive

The Different Flavors of Grandma’s Pies

Wednesday, May 4th, 2011

We have a Major Improvement in the HGSI Software with its Spectrum Analysis Pie Chart Tool.  Let me give you a sneak preview of the kinds of things we can now slice and dice which I label Grandma’s Pies:

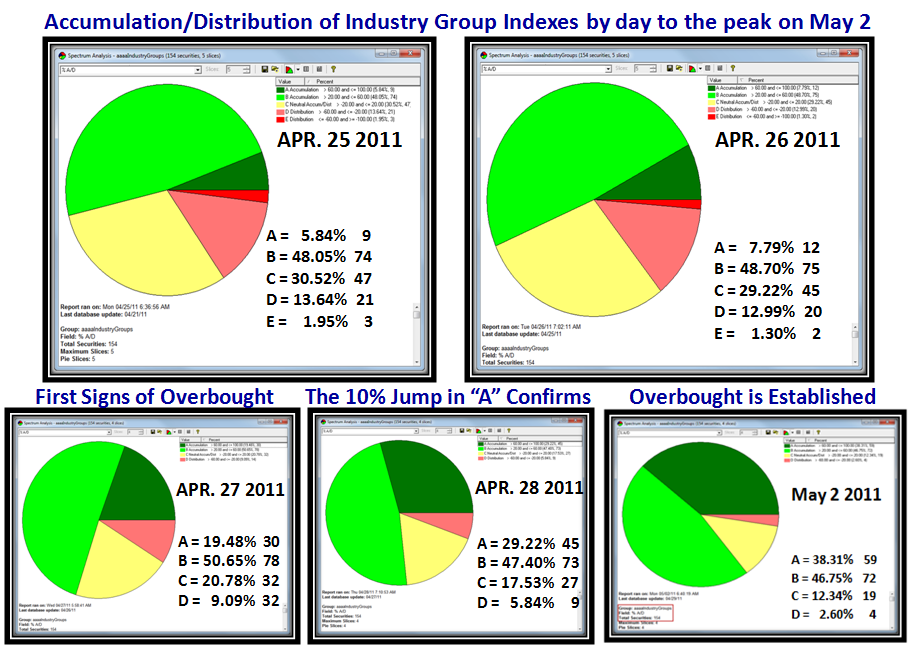
Let me show you some new Slices we can use to understand the Internals of the Market.  The first one is the Acc/Dist Function relating to the Market Indexes.  As you well know there are five different slices, which I refer to as Knowing your ABCDEs:

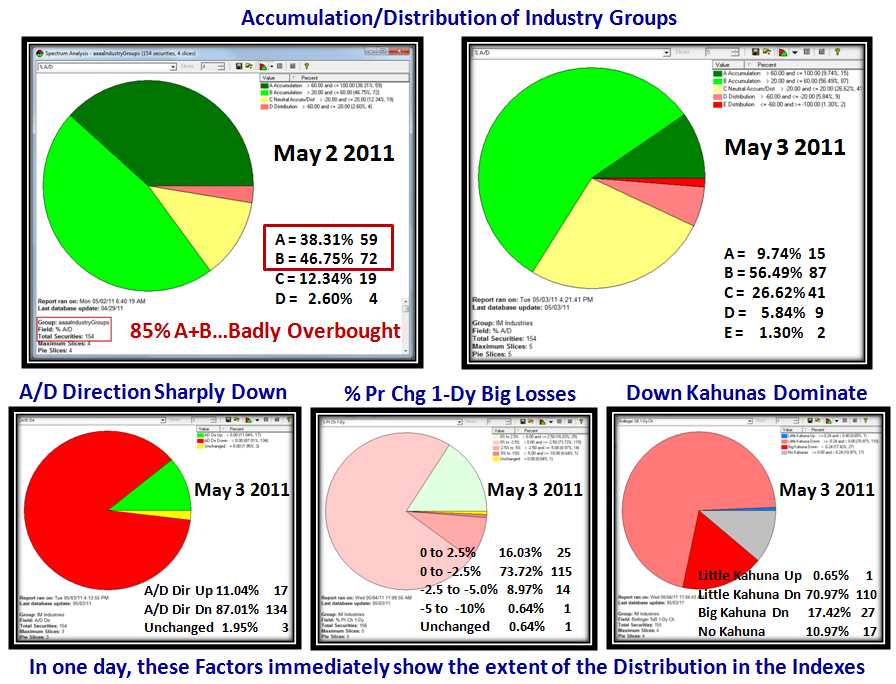
It doesn’t take a minute to see that the Market Indexes had first shown a climax run on Apr 27th. and was truly Overbought by May 2, 2011.  85% of the Market Indexes were either “A” or “B”.  But it didn’t take long to confirm that we were headed sharply down in the Internals of the Market as it was just a day later that we could use three new slices to confirm that, i.e., the Acc/Dist Direction, the % Price Chg 1-Day, and the Kahunas both up and down that registered that day:

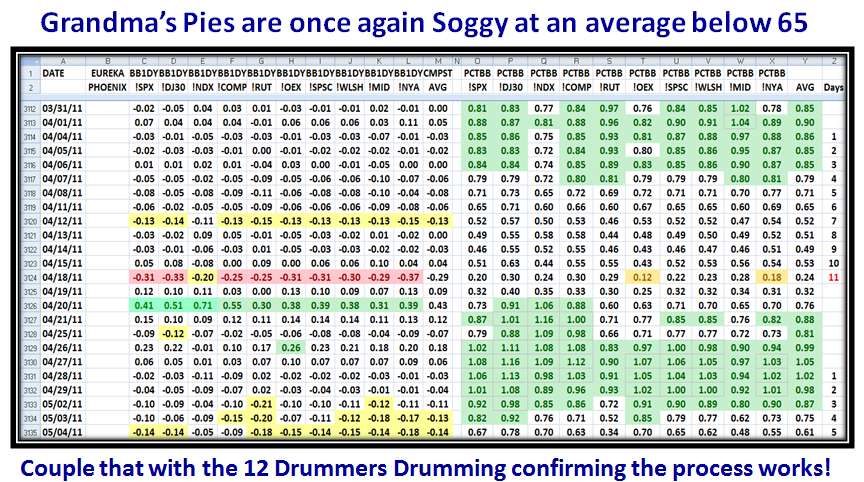
The numbers and pictures speak for themselves and leave no doubt that the Market had turned, and we had only one more day to wait to establish that the market had moved from being Under Pressure to a Market Correction.  How much remains to be seen.  We have our old faithful view to see the pattern evolve from the Market Indexes reaching a Peak only to be followed by up to 12 Days before we see a deterioration.  We are now in the fifth day:

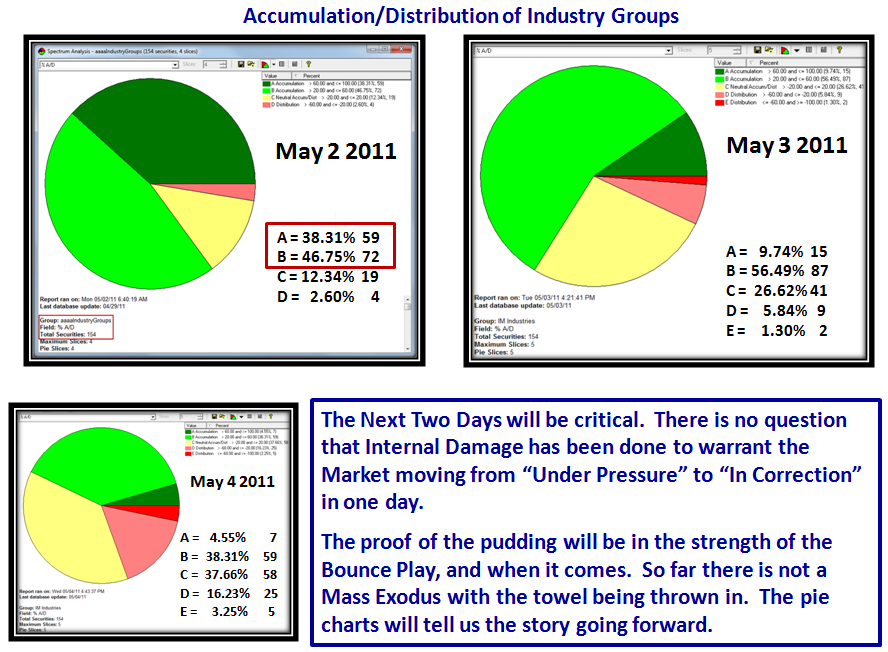
The next two days will be critical.  So far there is not a Mass Exodus with the towel being thrown in.  The pie charts will tell us the story going forward. The proof of  the pudding will be in the eating with the strength of the Bounce Play, and when it comes.  

Stay tuned and it won’t be long before you can do this for yourselves.  Ron and I will keep you updated.

Best Regards, Ian.

Play While the Sun Shines

Thursday, April 28th, 2011

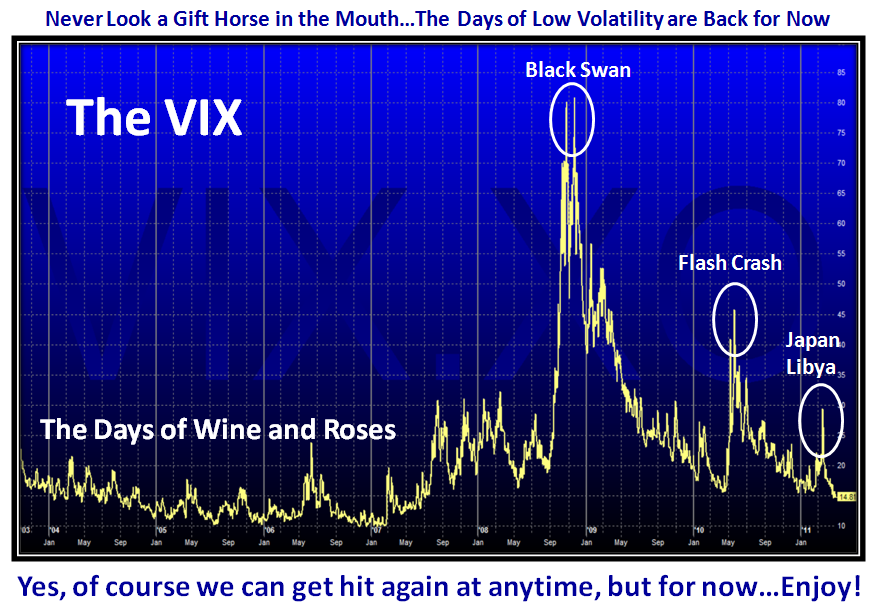
The saying goes “Never Look a Gift Horse in the Mouth!”  Play While the Sun Shines:


The Days of Low Volatility are back for now.  Yes, of course we can get hit again at anytime, but for now…Enjoy!


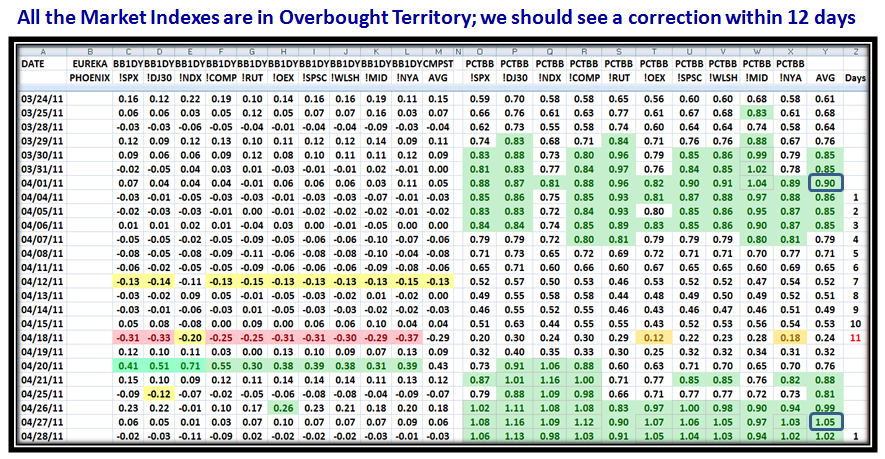
We have a strong breakout and all Market Indexes are in Overbought Territory. we should expect a correction within 12 days:


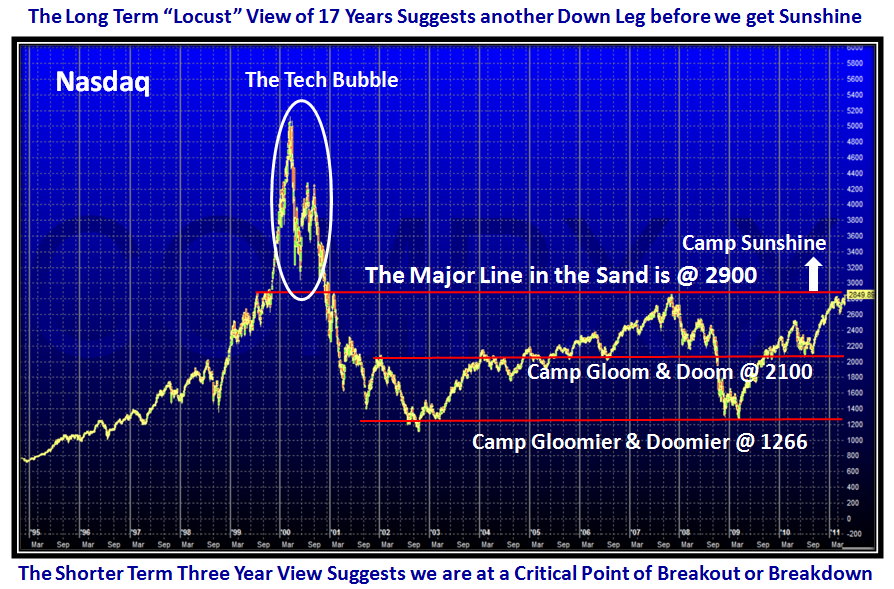
Step back and look at the long term picture…the Gloom and Doom say we have seven years to go and are due for a correction:


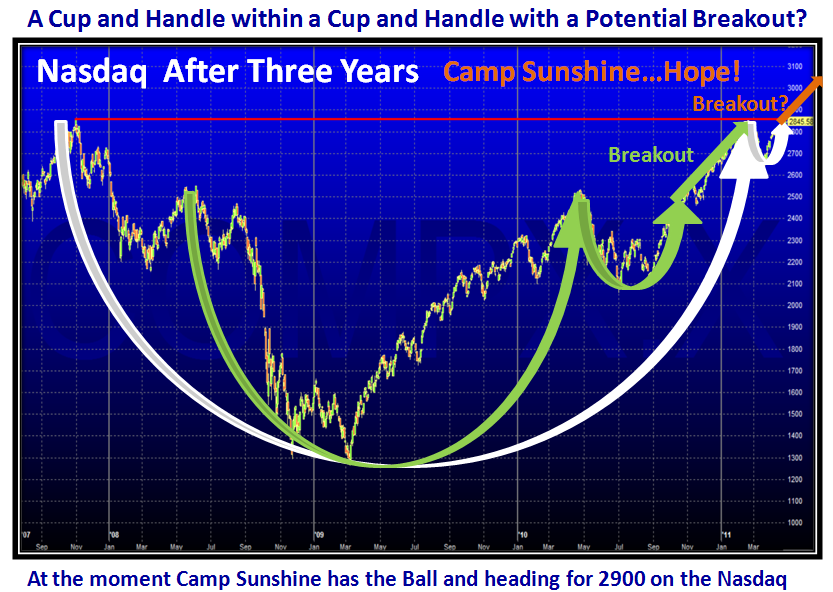
But the Three Year picture says we have another leg up to drive the Nasdaq to the natural resistance at 2900:


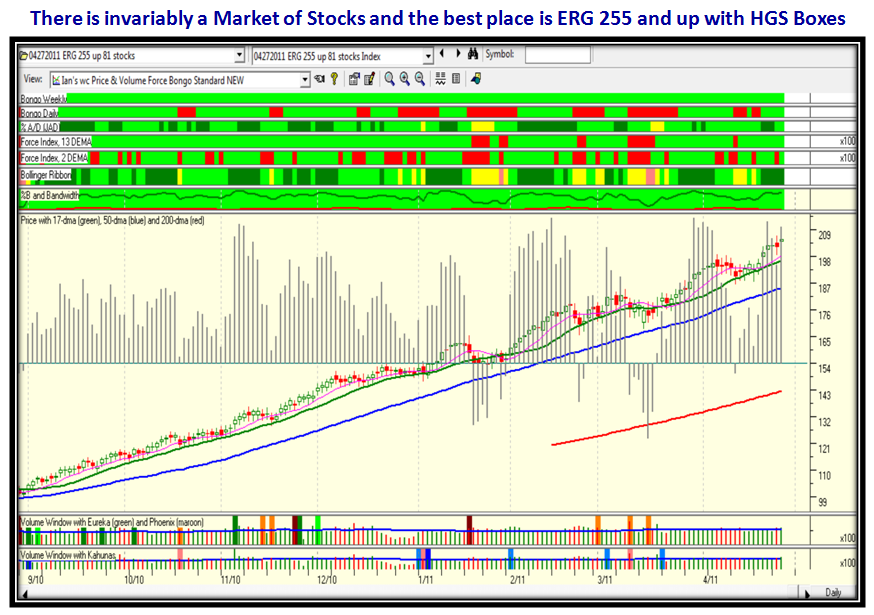
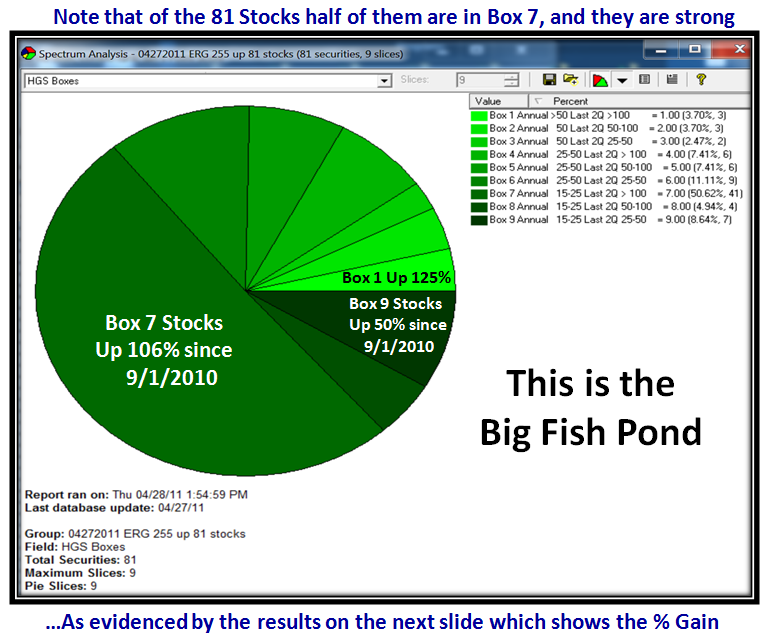
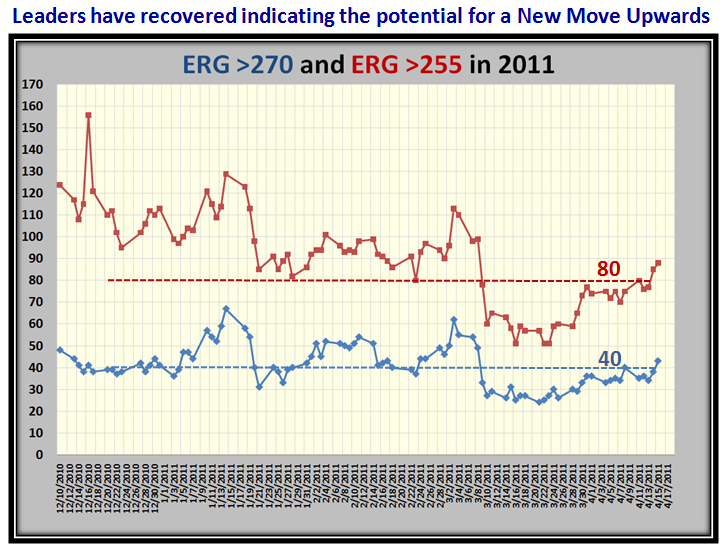
So how can Camp Sunshine advocates take maximum advantage of this turn up for the books?  Try ERG >255 with HGS Boxes:


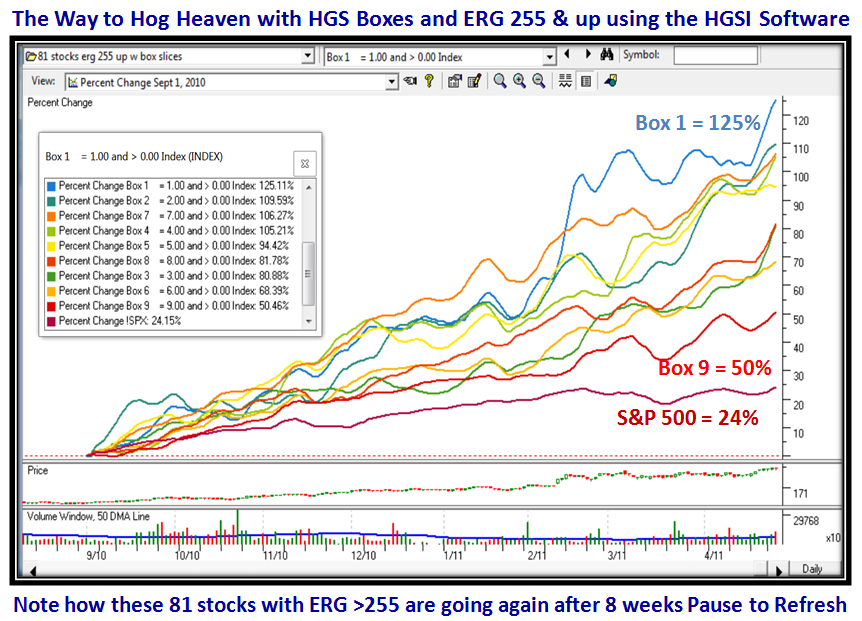
This is where the Big Fish in the Pond reside and make you the most money in the shortest time…check it out for yourself:


Now that  HGSI provides all of these rich features, it takes only a few minutes to produce the results to prove the value:


Play close to your vest with tight stops, and enjoy.  Best Regards, Ian

Market Indexes are at Stalemate, with a slight Upward Bias

Sunday, April 17th, 2011

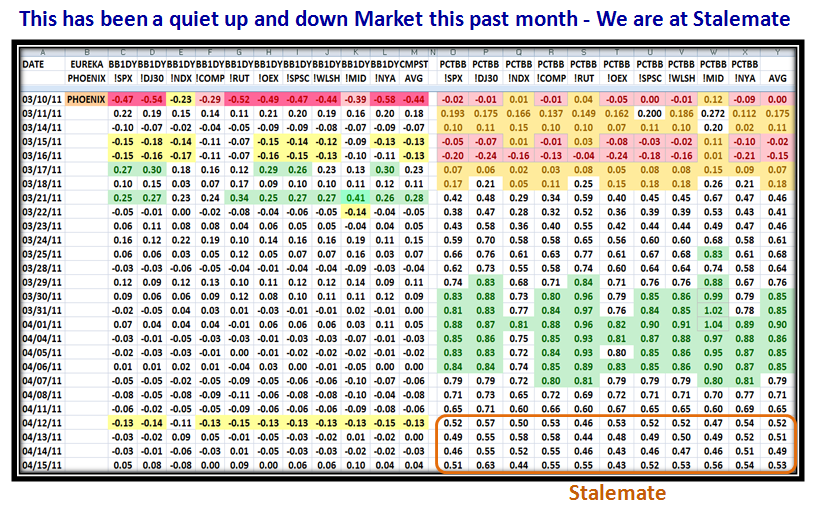
This past month has been dreary with little to write about since the Japanese Calamity and the Libya Conflict.  Stalemate with a slight upward bias is the word of the day:


…And here is the evidence, with most Indexes in the low 50’s:


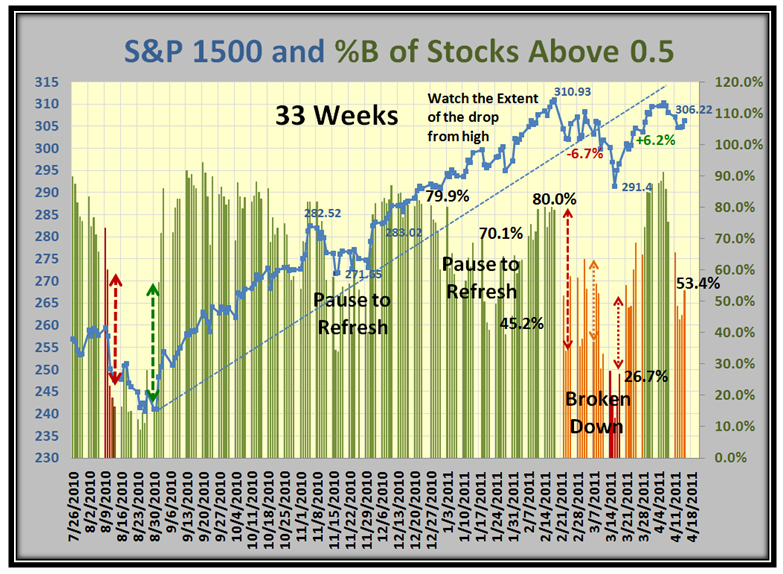
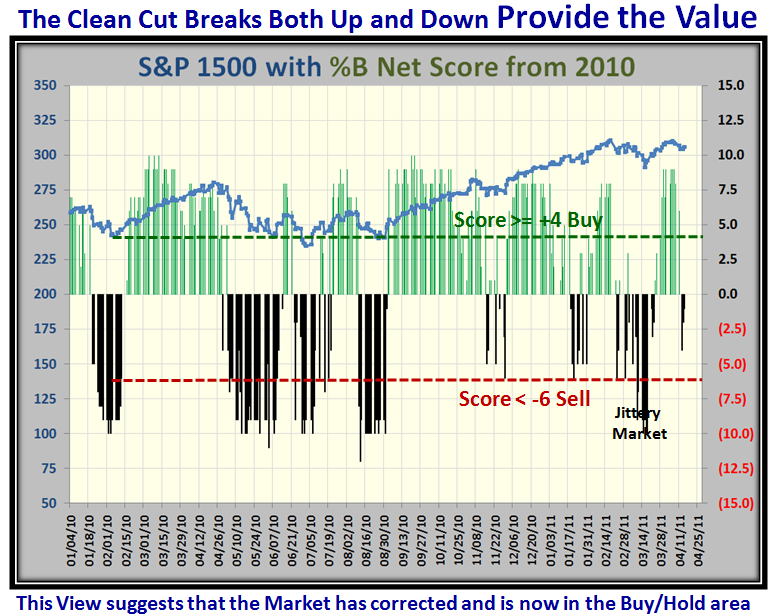
…And here is another view using the S&P 1500 which tells us the same thing:


Those who attended the Seminar a few weeks ago will understand the value of this view, which suggests we are in the Buy/Hold area:


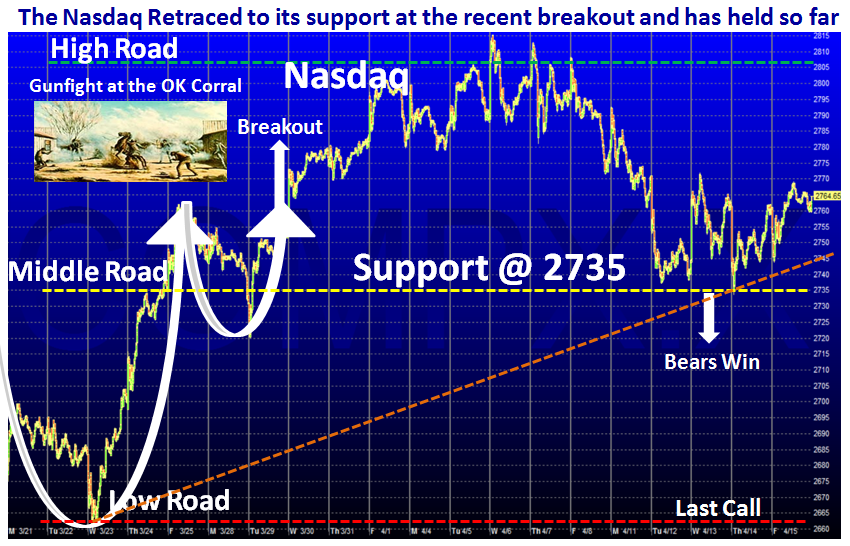
The Nasdaq broke out nearly three weeks ago and fell back to support at 2735 where it is pausing to refresh:


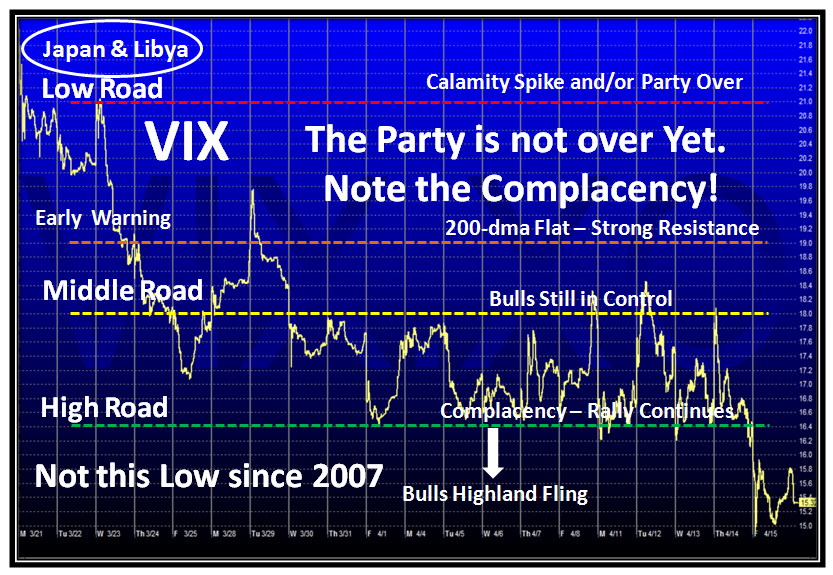
Here is the most surprising picture which presents a conundrum…totally complacent, the lowest we have seen since the Peak in 2007:


The leaders count is the most encouraging picture to suggest we may have one more rally in the making:


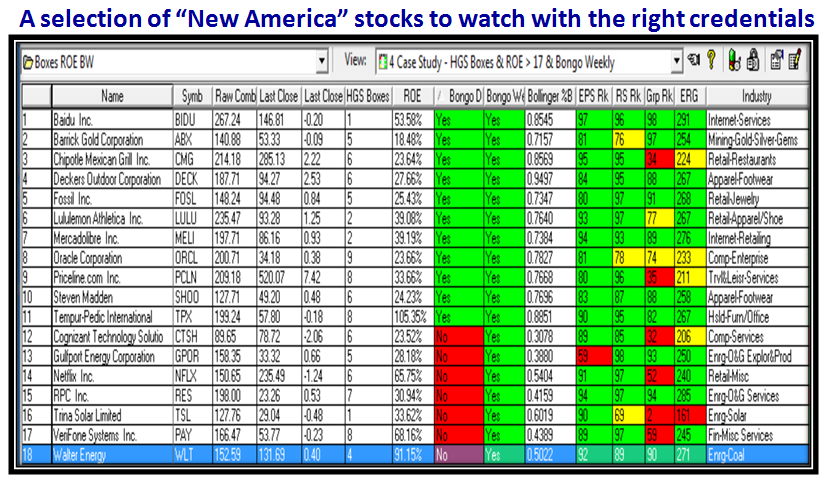
…And here is a selection of New America Stocks to keep a beady eye on to tell you if the Market turns up or down:


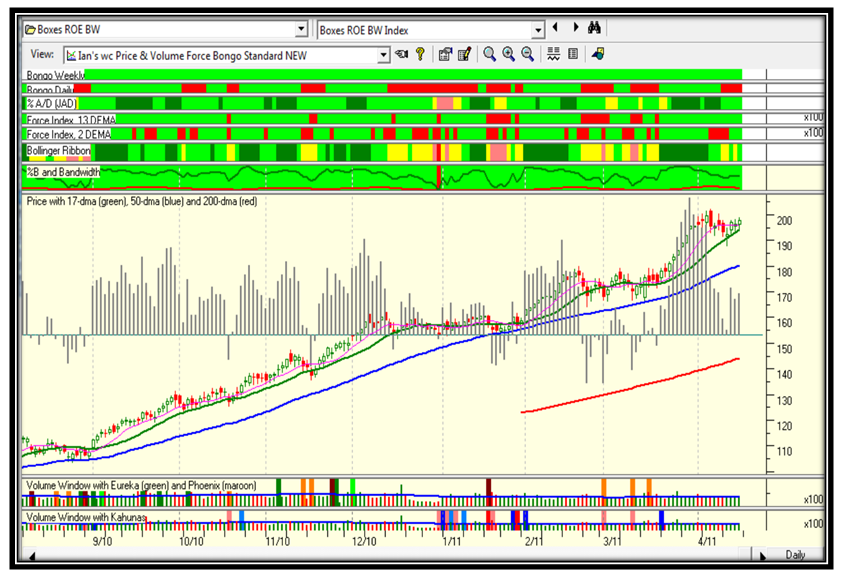
The Index chart of this list looks strong and ready to go again…we shall see:


There you have it…play it close to the vest and pick the stocks with the right credentials for quick gains, until you see which way the wind blows.

Best Regards, Ian.

Stock Market: The K.I.S.S. Approach

Tuesday, March 29th, 2011

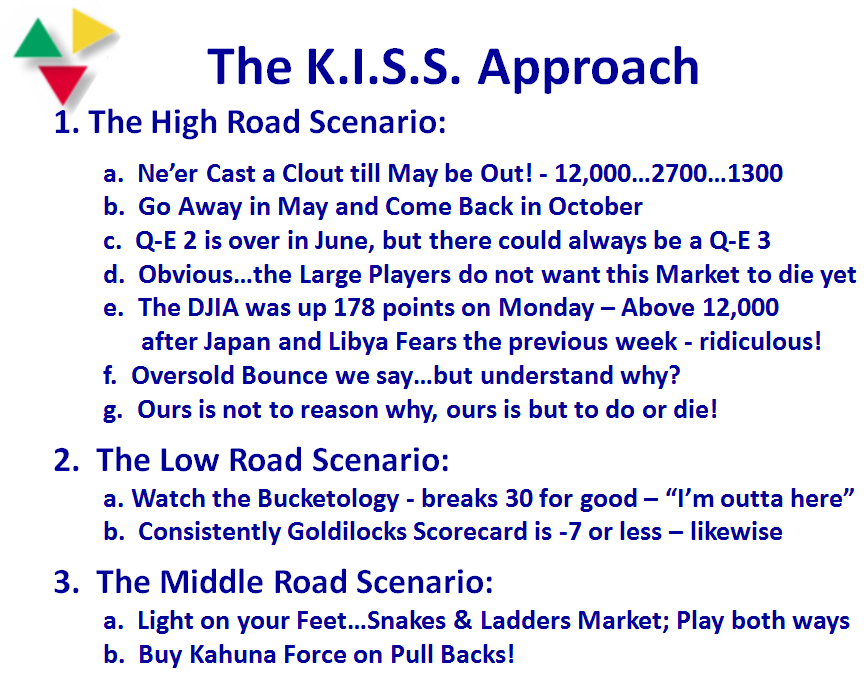
The Roller Coaster Ride is not over yet, so you know you are playing Snakes and Ladders.  However, over the course of the last couple of weeks we have learned a lot about the Game Plan for the Large Players.  The Magic of POMO, i.e., QE-2, is still alive until “May be Out”:


There is an old Scottish saying which is “Ne’er Cast a Clout till May be Out!” which translated means “Do not discard your Winter Woolies until May has come and gone”.  So, take a tip from that old saying and don’t be too quick to get rid of your stocks until May is out”.  Likewise, the big boys trot off to the Hamptons with “Go Away in May and Come back in October”, so expect things to get a trifle dull and in the doldrums in the summer months.  We shall see what we shall see.  Judging from the volume these days, they may have already trotted off into the sunset. 

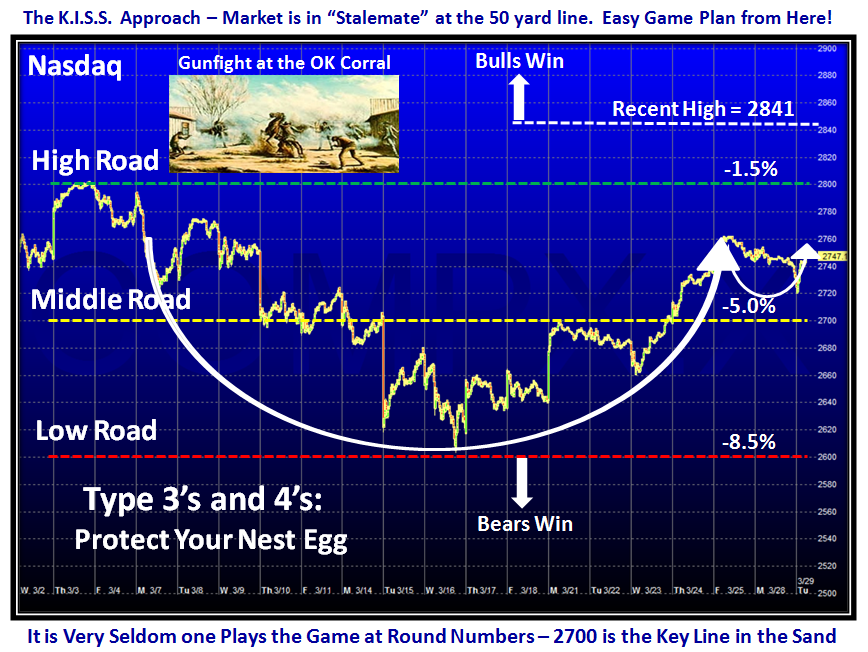
The net result is that the KISS Approach for the High, Low and Middle Road Scenarios become pretty straightforward:


The bottom line “So What” Message is the Market is still in Stalemate at the 50-yard line and the Bulls have the ball and are attempting a new move to the High Road Scenario yet one more time.   I feel it is time to dust off my old favorite view at this time for another fight at the OK Corral between the Bulls and the Bears which I have used many times before in the past.  In all these years I have never seen the game plan to be around numbers that are easy to remember – the Market always likes to play around 100’s and 1000’s.  In the case of  the Nasdaq the current game is being played between 2600 and 2900, with the 50-yard line at 2700.  Below 2614 is 8% DOWN from the current high of 2841 and as you well know by now history shows that 77% of the time the S&P 500 turns back up at or around this number.  Below that it can land anywhere.  Therefore, Type 3’s and 4’s longer term Investors should take heed if it breaks down at this level to protect their Nest Egg:


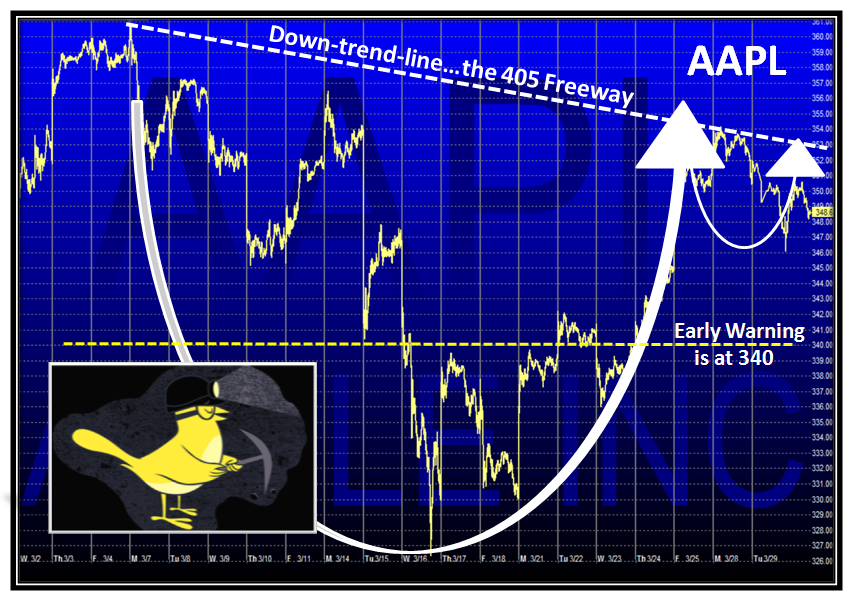
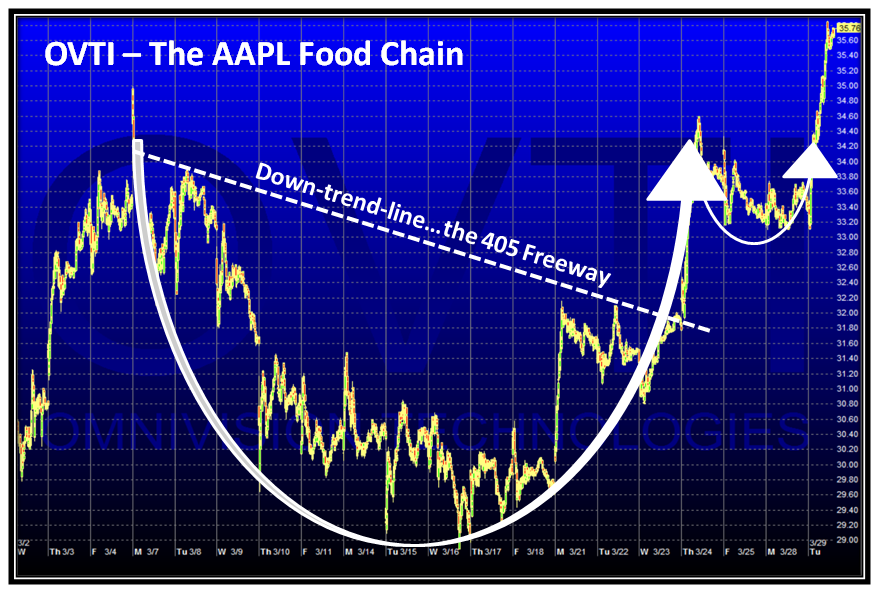
As I told you in my last blog, you need to watch the Canary in the Coalmine and that is AAPL.  In addition it pays to watch the Apple Food Chain and in the next two slides I show charts of AAPL and OVTI, with the latter already breaking out based on its recent strong earnings report as this market turns up:


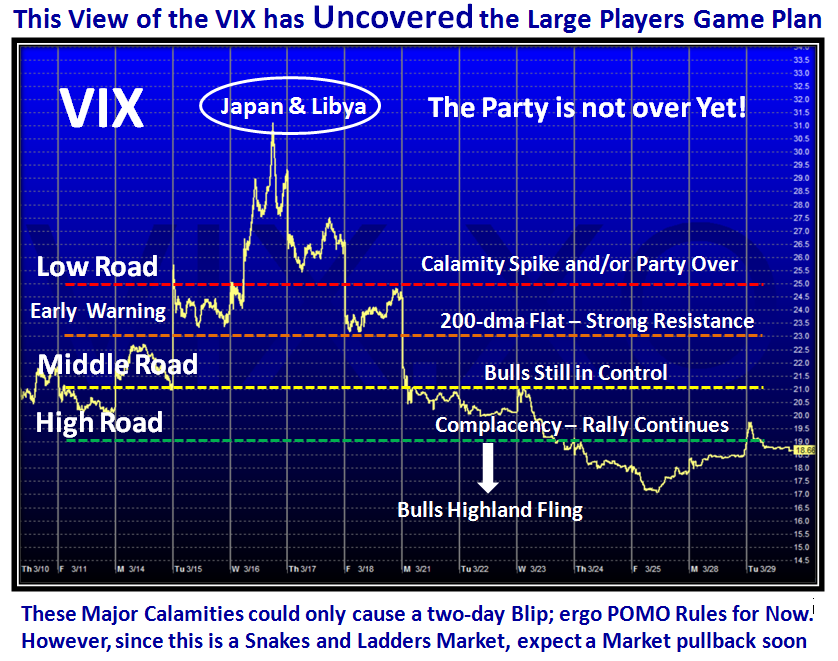
I mentioned in my last Blog that the way the Markets behaved after these terrible Calamities both in Japan and in the Middle East and particularly in Libya, would give us a great clue as to what is the Large Players Game Plan.  It for sure has shown us that POMO still rules the roost in their minds and they are not yet ready to let this market die.  Can you imagine in other times the VIX giving a spike up for only two days to just collapse into tranquility again.  It is now well below 20, which is what is needed for a long haul rally to continue.  At any rate we now have an excellent cushion as I show on this next chart, as the real resistance is above the 200-dma:


We all enjoyed an exhilarating seminar and we thank you all for your support.   As you will see I have recouped from an exhausting three days of hard work and fun and have been able to collect my thoughts to give you all a Game Plan that should last you for a while.  Let’s see how it plays out.

Best Regards, Ian.

Stock Market: The Party’s Over for Now

Wednesday, March 16th, 2011

This is my St. Patrick’s Day Gift to you and my Wife!   Two weeks ago we felt that the crisis in the Middle East, especially in Libya, and the resulting blip in oil would be the test for QE-2 to keep this stock market buoyant.  Now we have the terrible disaster of an Earthquake, a Tsunami and the Nuclear Explosions in Japan to test it further.  Of course, our hearts go out to the Nation and our friends at Fuji-Xerox.  At least for today and the next few days the Party is Over, but who knows what next week brings:


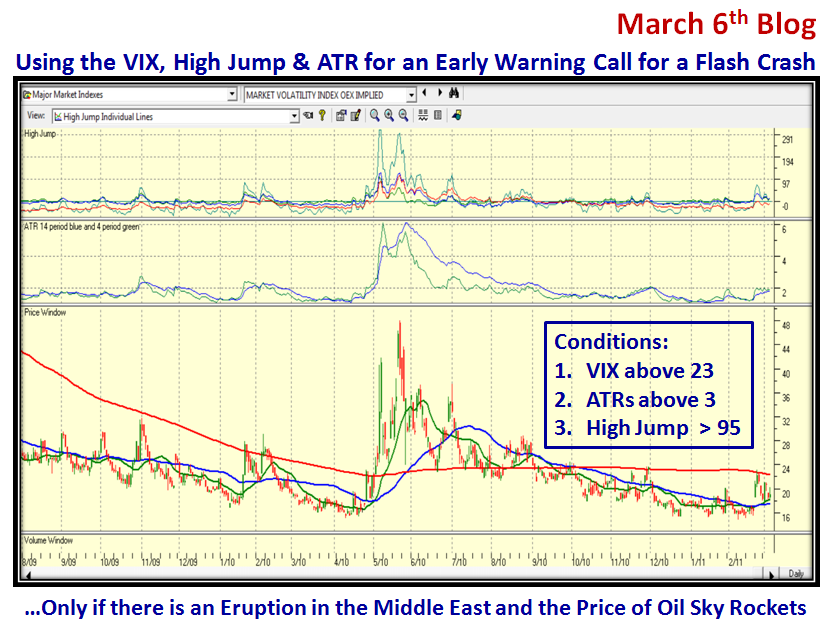
It is now ten days since my last Blog when I gave you the Game Plan using the High Jump with ATR and the VIX, so forewarned is forearmed.  The line in the sand on the VIX was very CONVENIENT, as both the 200-dma which was flat, and the fact that the VIX at 23 was turned back several times in the past, gave the right conditions for Custer’s Last Stand between the Bulls and Bears.  It was the ideal place for the VIX to be turned back if QE-2 was to dominate over such disasters to cause only temporary blips on the market’s road upwards.  However this was based on what I showed you in the picture below using the Flash Crash as a pseudo example for a knee jerk if the Bears were to prevail…hence the  Game Plan I gave you:
         

I am writing this while the market still has an hour and a half to go and the picture looks bleak with the VIX into new high territory at a whopping 30.43, so the floodgates have opened.  Last night when I looked at the results, it was fairly obvious to me that we were already in trouble with the High Jump at 87, getting mighty close to the target of 95, and the VIX had already broken through to 24, close enough for government work.  It is now down to 28ish as I post this blog note with 20 minutes to go in the market:
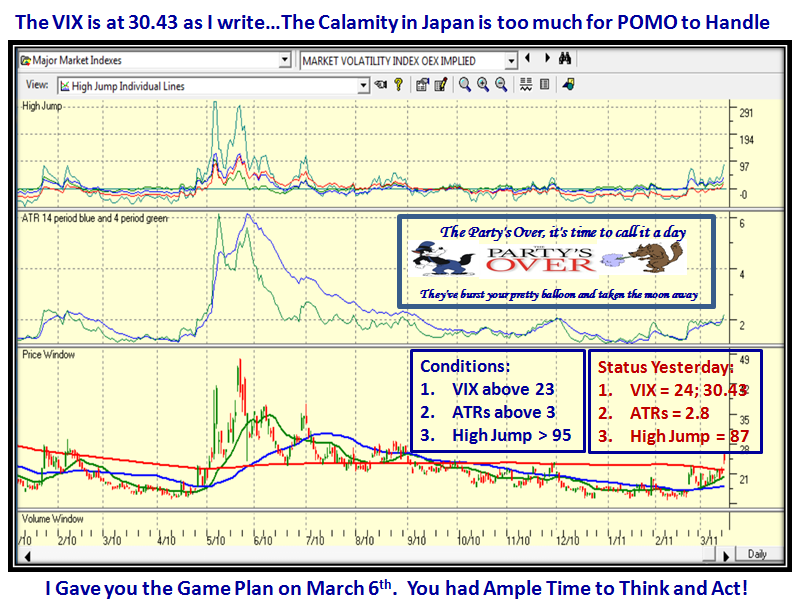
          

You have only to look this up at the end of the day to see if the Game Plan came true, in which case chalk one up for this combination the next time we have a Major knee jerk in the offing and set your targets accordingly.  I have found a valuable NEW use for the High Jump, which has never let me down in the twenty years I have used it.  We will teach you all of this at the seminar in ten days time.

Thanks to Robert Minkowsky who first kept a real beady eye on the behavior of the Leaders through watching ERG 270 and ERG 255, and to my other good friend Stephen Cole for keeping this up to date, here is another Lead Bullet to stiffen your backbones.  The beauty of this is to not be too cocksure that one indicator will do the trick and here we find that things are iffy until we see the results tonight.   With all the discussion on the bb’s of Pocket Pivots and set ups of leaders still holding the fort, it pays to watch this one as well in the HGSI software tonight to see if these numbers have held up or really given way.   Jerry Samet has shown that there is a marked deterioration in his leaders group which he has faithfully produced for months, and Ron Brown shows us the deterioration on %Gain on a daily basis in his One Notes which are gems.  Net-net, it takes Teamwork to filter through the Noise and give you time-tested pictures of which way the wind is blowing.  Remember you have to be your own Guru, since no two stomach’s are the same and it is your money not the guru’s.  But at least you have had ample warning:
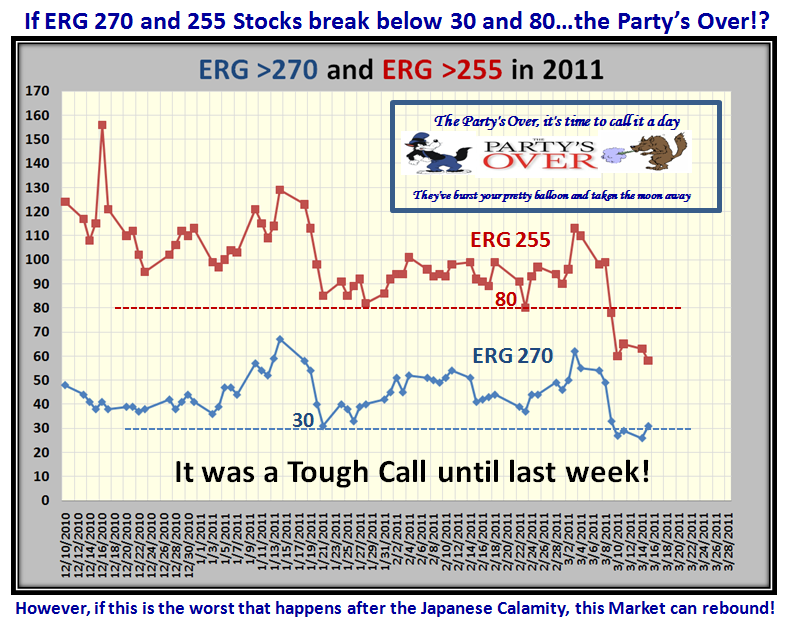
        

Please note the last sentence under this chart…if this is the worst that happens AFTER the Japanese Calamity is behind us, then in all likelihood the market will rebound from a vastly oversold situation.  The quality of that Bounce Play will tell us whether once again the QE-2 is propping this market up or that despite the Fed’s Reports and actions, reality of the future is beginning to set in when all of this pumping stops.   After all there is money to be made by buying a market of stocks even if the Stock Market is deteriorating, and one can become adept at playing both sides.  Good Day Traders love volatility, but eventually those who are trying to preserve a Nest Egg in their 401-K’s do not want to see it dwindle to a 401-Keg.  For those who do not know that inside joke, try 401-Keg in the Search Window of this blog and you will see that I enjoyed over 5350 hits in one day when I first published that blog with tongue in cheek on October 8, 2008. 

Last, but not least, it always pays to watch the Canary in the Coal Mine, and here is the picture of Apple’s performance these last several days, and especially today:
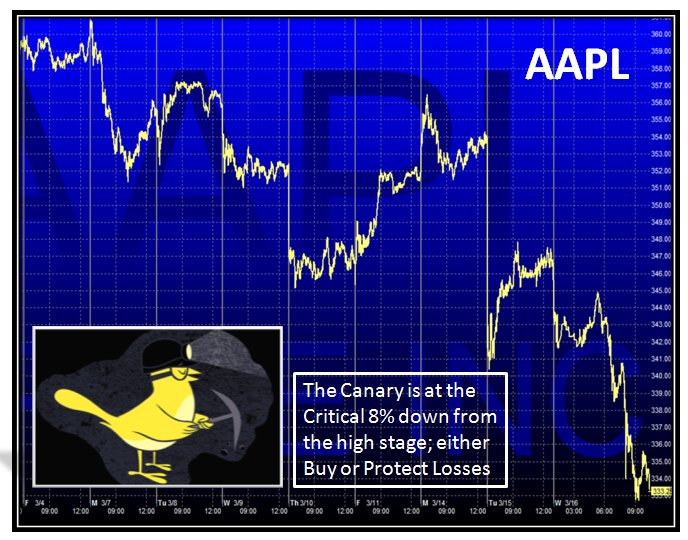
        

So I leave you with a picture which sums up the situation and we shall see what unfolds between now and the seminar in ten days time.  I have taken time out of my busy schedule to share this with you so that you have a good understanding of the pulse of the market before we see you:


Best Regards, Ian.

Copyright © 2007-2010 Ian Woodward
Disclaimer: Commentaries on this Blog are not to be construed as recommendations to buy or sell the market and/or specific securites. The consumer of the information is responsible for their own investment decisions.