Ian Woodward's Investing Blog

Author Archive

Stock Market: Don’t Count Your Chickens Before Hatched

Wednesday, February 9th, 2011

I’ve been fooled before and I’ll be fooled again, but this Market is a wonder to behold.  Inching up day-by-day on light volume and all we can point to is Uncle Ben and his wonder elixir called POMO or QE2!  That is the beauty of always having three scenarios and letting the market tell you which one it is on.  So, one more time the lesson learned is “Never Count Your Chickens Before they are Hatched”:

On January 28th, the Market Internals were signaling that we were on the brink of a correction, and here we are barely ten days later and it could hardly look stronger.  The Bears were denied and the Bulls came roaring back:

Here is the updated picture of the Yin-Yang with 5 buckets down followed by 4 Buckets up and now an overbought S&P 1500 along with all the other Market Indexes:

Helicopter Ben is still whirling around town with his QE2 and you may as well enjoy the complacency while it lasts:

At times like these, curb your euphoria to what are reasonable upside targets.  Once achieved, either set higher targets or watch out below.  There is seldom any better way of gauging what might be a reasonable target than the High Jump tool.  The next chart is a busy one, but if you haven’t learnt it by now, then it is high time you did.  When rallies get long in the tooth, they invariably show a tendency to be struggling on making recent previous High Jump targets.  In this case I am using only the 50-dma and 17-dma as my guide as we are already a trifle extended from the 200-dma to say the least.  Note how much weaker this rally is compared to the burst of enthusiasm from the 9/1/2011 timeframe to that small pause to refresh in November for two weeks just before the Santa Claus Rally.  The bottom line is that if this rally continues to show strength then around 40 points higher is as much as one might expect.  I show the targets for both the High and Highest Scenarios.  Don’t quarrel with me for not showing the Highest at 12% at this stage of events.  Let’s get past 11% first:

That should give you plenty to chew on till the next time. 

Best Regards, Ian.

Stock Market…Don’t Fight the Fed!

Tuesday, February 1st, 2011

Are we headed one more time for a Climax Run.  My good friend Mike Scott reminded me that this is the same “kerfuffle” that occurred at the Peak in October 2007.  Imagine IBD caught in the same dilemma with Market under Pressure, then Market in Uptrend and back to Market under Pressure within a week, and what do you think they will say right now?  The word is out, you guessed it…Market in Uptrend!  I warned of both Bull and Bear Traps, but there is only one golden rule which is to let the Market tell you what it is doing, but I strongly advise us to play with one foot in the exit.

The Bucket Sloshing naturally continued today with a strong move to the right, but with a 64:36 Ratio, though the S&P 1500 %B has jumped back to Overbought Territory with a reading of 1.06!  Net-net we are back to Disparity and the stocks above 0.5 have to be pulled up by the bootstraps as I show in the following slides. 

I guess we are all confused by the extent of this Volatility and here is the reason why…the Yin and Yang:

However, I am satisfied that our process is working and we now have a method not only that a Market is Under Pressure or that it is in an Uptrend, but the extent of the damage and the recovery with the sloshing buckets.

…And now let’s look at Grandma’s Pies and the Buckets which show how Jittery it has been these last four days:

Today was a very good day for the Leaders that were trashed as they came right back into them.  Here is a list of 18 stocks which I captured three weeks ago with an RS 85 rating which I keep tabs on at times like this.  For those of you who have HGSI and QuoteTracker, this is a worthwhile tip to see which way the wind is blowing on key days:

To see which way the wind is blowing on a strong day up, keep an eye on snapshots at 11.30, 12.30, and 1.00pm Pacific Time to see how these Leaders behave, and you will immediately see that they held up well, so this was not a one day wonder for the moment.  I know the numbers are hard to read, but just click on the chart to see a bigger view and you will see that they held up respectably with some stocks having strong volume…of course, the big boys could be selling into the rally!  One more clue, they were buying the top two in after hours and drove the Average up to 3.58% once again:

Last but not least, my good friend Paul got permission from Barr of his website to post this picture which says it all:


Keep your powder dry and good luck in these tricky times.  Best Regards, Ian.

The Impact of the Egyptian Conflict on the Stock Market

Saturday, January 29th, 2011

Just when the Stock Market seemed to be struggling one more time to defy gravity and benefit from the Fed’s POMO or QE2 actions, we have had a major shot across the bow with the eruption on the Egyptian scene.  From our perspective it has meant a FIVE BUCKET Drop in one day and since you are now very familiar with my terms, it goes without saying that it is high time for you to take note of what the alternatives are for this coming week:

Here is the impact on the Market Indexes on Friday with the eruption of the Egyptian Crisis…a five bucket skip:

If you look at the extreme right column, you will see that the count is Nine Days on the Twelve Drummers Drumming Concept!  It seems to be a gem for keeping tabs of when the Market gets vulnerable.  Those red numbers at the bottom row are not seen often and not to be taken lightly…We are fortunate to have a weekend in between to digest what has transpired and to see the further reaction in the markets abroad before Monday rolls around. 

We are down to “Custer’s Last Stand” as I have penned before many moons ago and the next few slides show you where the clues are as things evolve next week.  Just look at the deterioration this past week:

…And here is a snapshot of the movement from Overbought to Bifurcation to Rotation in the past month.  I show what to look for if we have a full blown correction, and again why Buckets 7, 8, and 9 is the last stand for the Bulls:

Here is a chart I gave you on the January 23rd Blog Note.  It gives you the answer to a full blooded Correction:

The only hope and salvation for the Bulls is the Feds POMO action and we shall see if this has run its course or if there is more fire in the belly to stem the tide and continue the euphoria to the upside:

The immediate future ala Monday looks very bleak, but hopefully we will ride this crisis through.  Be careful of both Bull and Bear Traps.

Best Regards, Ian.

Stock Market Ebb & Flow in a Nutshell

Thursday, January 27th, 2011

This past week the Stock Market has been acting a trifle jittery, but as I said in my last blog note that despite the obvious bifurcation and rotation in the market, the Institutions were not about to let it drop when we had the State of the Union Address this week, and true to form they have propped it up one more time.

This note offers you the Ebb and Flow of the Market in a Nutshell using Grandma’s Pies and Bucket Skipping. 

Two points of explanation on understanding the Pulse of the Market with %B of the Bollinger Bands:

1.  Grandma’s Pies are a quick way to know who is winning…Bulls or Bears.  I use it with the S&P 1500 to give a large sample of stocks to know the % of stocks above and below a %B of 0.5, the Middle Band of the 20-dma.  As you see from my notes on the chart below, the areas of the most jitteriness are a ratio of 65:35 with a last call of 55:45.  You can of course use any Index you wish.

2.  Likewise, I have coined the term Bucket Skipping and those who follow my strategies know it means a 1-Day Change in %B which is in excess of 0.10, representing a single bucket skip.  Since my Kahuna signal requires either a 0.24 or a 0.40 1-day change either up or down, this would be tantamount to a 2-bucket or a 4-bucket skip, respectively;  in other words a significant change in momentum in an Index, a Stock or an ETF.

These concepts are shown in the next two slides:

Using the Edgerater.com Software which my good friend Chris White has provided, we have an easy way to watch the Ebb-Tide of the Market with Grandma’s Pies and Buckets as shown below:

It doesn’t take two minutes to see which way the wind is blowing by the green and red portions of the pie charts and the sloshing of the market from left to right by the contents in the “buckets”.  More importantly, one can see that it can take just a day for the Market to swing from the Safe Zone of 0.70 and above, to Bifurcation as shown by what transpired from 1/18/2011 to 1/19/2011 by the blue arrow. 

You might wonder how the Market has performed this past week and so here is that picture.  I left out 1/20/2011 as it didn’t add anything to the information and I wanted to show six snapshots on the page:

Remember that if you wish to see a larger picture, just click on the chart and enjoy.  So, net-net we have a humped back effect, and our good friend the Dromedarian is a good way to remember Bifurcation!

So there you have it, the EBB-Tide of the Market to understand the High, Low and Middle Road Scenarios in a Nutshell.  You can use any Market Index or your own Portfolio of Stocks and/or ETFs to follow the sunshine and avoid the rain with sufficient warning to do so.

It’s time you folks make your reservations for the Seminar as the Hotel Arrangement at the Marriott Courtyard that give you a break in price holds until March 7th, 2011.  In any event you need to get early bookings for your plane fares, and we need to have ample warning of who is intending to participate at the seminar from March 26 to 28, 2011. 

Best Regards, Ian.

Stock Market Under Pressure: But How Much?

Sunday, January 23rd, 2011

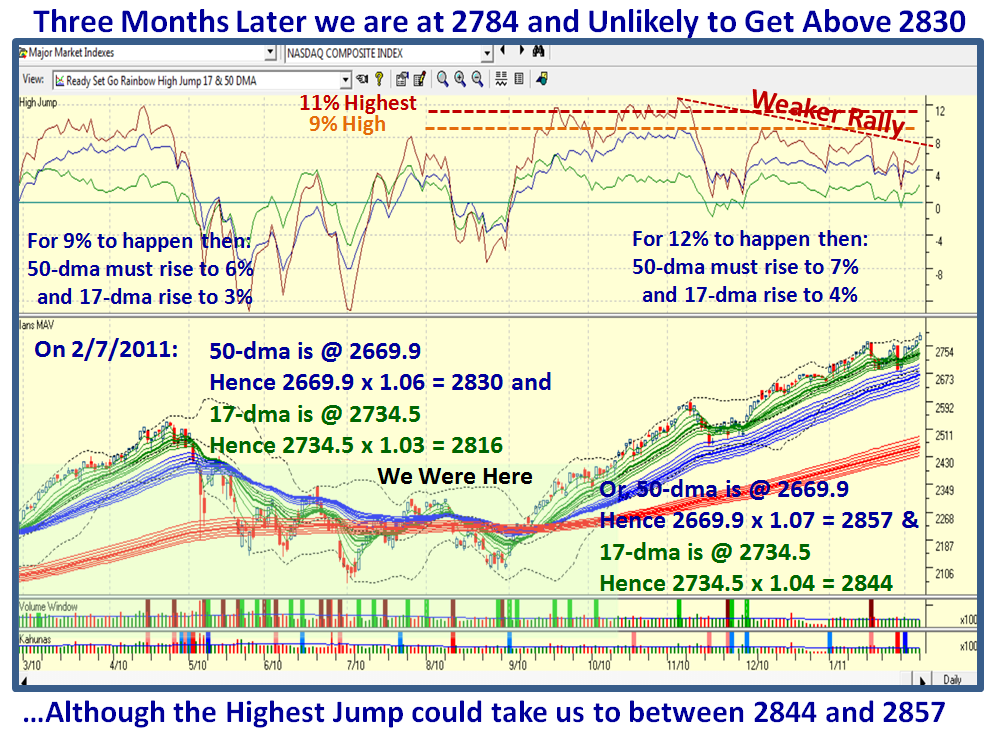
The tide has turned for the worse in the last three days and our friendly Financial Newspaper says “Market Under Pressure”…but the question is “How Much?”  Hopefully this blog note will give you a perspective on the answer to that question:

So let’s start with “From Whence we Came” going back to the Eureka Signal on 12/01/2010 when we had an Eureka and several Big Kahunas to the upside which started the Santa Claus Rally.  By the 18th of January all the Market Indexes were overbought as shown at the bottom right hand side of the next chart.  The very next day we had a Phoenix with some big Kahunas to the downside and that is the first shot across the bow: 

Usually WITHIN twelve days from this Overbought date, we should be into a Correction, and we will see if that golden rule still holds true…we don’t have long to wait.

There are two items that can delay the inevitable tumble for some form of a Correction, since I will show you that we have already achieved “Bifurcation” and the Rotation is already here…but more on that later.  The two Items are:

1.  The State of the Union Address is on Tuesday as my good friend Sherman reminded me at our Saturday User Group Meet Up, and it is most unlikely that the Big Boys will want to drive the market down unless there is some earth shattering news that triggers a big correction.

2.  These are different times we are in; similar but different in that we have seen long rallies but different in that this market is being propped up by our good friend Helicopter Ben who is dropping big leaflets by way of the FED’s POMO otherwise why would we have not one, but two long rallies of the S&P 500 above the 10-dma as shown below:


The next two charts are familiar to regular readers so they need no explanation, but will give you the latest picture of the Divergence that continues between the Internals of the Market and the Index Price:

So let’s turn our attention to the stages of deterioration from a Market Top to see how near we are to a Correction.  Based on the recent results I have kept you appraised of we should go from Disparity to Bifurcation to Rotation and ultimately to Correction or a Major Snapback from a Pull Back.

Disparity is a new term and I suggest it is the first clue that things are going heywire when one sees that the %B of the Index is still hanging tough and staying up, while the S&P 1500 Stocks above 0.5 begin to drop off as I showed in the last chart I posted in the previous blog, and repeat it here:

Let’s first look at the Disparity Factor for the past two years.  I consider any difference of >0.20 is a signal.  We can immediately see that this factor was about 0.24 and signaled just before the Flash Crash which then resulted in a 17% correction:


So let’s zoom in on Recent Disparity in the last three months where we see the difference, or Disparity as I call it, between %B and the % of stocks above 0.5 was as huge as 0.48 and we had a mild correction of 4%.  This time it reached a peak of 0.37 and the correction has just started:

So having spied Disparity, another clue in our arsenal is “Bifurcation” which my good friend Mike Scott dubbed and I have also featured this in earlier blog notes.  Narturally, as we get good at this stuff, the more significant buckets to watch are at the two extremes, <0 and >1, and here we see a whole bunch of stocks being trashed back on January 7th.  In fact the % of stocks in this bucket is the tallest at 12%:

As it turned out Bifurcation first occurred on Janaury 7th.  Note that when compared to what occurred on April 30th a week before the Flash Crash, not only did we have Bifurcation but also the % of stocks in the top bucket >1.0 was also at a low of a mere 4.1% which suggested that the Correction was already underway, whereas now we still had a healthy 9.2%:


Now let’s look at the picture as of Friday, January 31, we certainly have Rotation underway as the percentage in Bucket >1.0 has faded to 3.2%, but we have to wait to see if it is a full blooded Correction:

The next question is when do we know we have a full-blooded Correction?  When the Pie Chart changes to 30:70:

Don’t hold your breath as this next chart shows you the Bifurcation which has occurred in the the Ten Market Indexes I track.  It is no news to you that the likes of the Nasdaq, the NDX, the Mid Caps and especially the Small Caps have all been taken to the woodshed and trashed.  However, surpringly the DOW is the strongest Index with the S&P 500, OEX, and NYSE still holding up.  Just look at the “Rose shading” on the left hand side of the bottom chart…Distribution is heavy:

In Summary:  I would have said that next week is critical, but with the State of the Union Address on Tuesday, do you really think they will dump the Market unless something major upsets the Applecart?

This coming Thursday, Ron and I are holding an on-line Webinar on three Impulse Indicators – the Eureka, the Phoenix and the Kahuna.  We are already full and I urge those who are attending to digest this and previous blog notes as they substantially augment what we will cover in an hour and a quarter. 

Best Regards, Ian.

Copyright © 2007-2010 Ian Woodward
Disclaimer: Commentaries on this Blog are not to be construed as recommendations to buy or sell the market and/or specific securites. The consumer of the information is responsible for their own investment decisions.