Ian Woodward's Investing Blog

Author Archive

Stock Market: The Party’s Over For Now

Tuesday, August 24th, 2010

The sale of existing U.S. homes sank 27.2% in July which was the biggest one-month drop ever…largely because of the phase-out of a federal tax credit, and the market went down again true to form:


The S&P 1500 stocks have dropped again on Monday and today, and we now sit with 91% of the stocks below the Middle Bollinger Band of 0.5 and only 9% above it…oversold.  


We are barely 6 points higher than the low set on 7/2/2010, so it is a no brainer that we will test that tomorrow or if not, soon.  That would give us a double bottom where one might expect a bounce play from an oversold position.  Can we go lower?…Sure we have been as low as 97% of the S&P 1500 stocks below 0.5 as recently as 5/20/2010!

You have seen the spreadsheet below, before, so it is self-explanatory.  Since the Market broke down with a Phoenix Signal on 8/11/2010, we have two more to prove that the Bears are now in complete control, with the most recent one today!   Of course, we should look for a bounce play, but unless there is some startling positive news, the overall direction is overwhelmingly down for now.

To add to the Bulls’ problem, the overall emotion of the Market has turned very negative with all the discussion of Hindenburg Omen’s firing last week.  It is unlikely we will see another one soon unless the Market happens to turn up sharply, as the one item now which is a challenge is that the 10 Week Moving Average of the NYSE has recently turned down. 

Type 1 and 2 Intra-day and Inter-day Traders are enjoying this market…provided they are sharp and turn on a dime.  The rest should be sitting on the fence until there is more than hope to drive this market up. 

Best Regards, Ian.

Stock Market: Reviewing the Bidding; Bears hold the Trump Cards

Thursday, August 19th, 2010

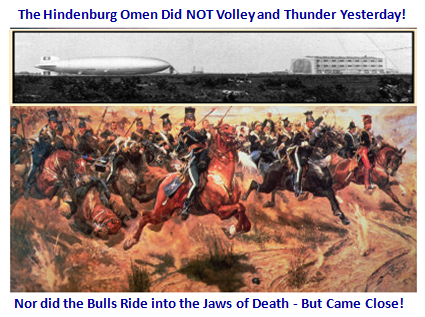
Now that the buzz is slowly subsiding regarding the Hub-hub of the spurious Hindenburg Omen sighting on August 12th, which our Reuters feed did not give us, it is time to review the bidding of where we stand at this notoriously dull time in the market.  I am pleased to mention that Robert Moreno, a RealMoney Contributor of The Street.com provided a thorough balanced and objective review of this subject, in which he cited my work, along with others on the subject.

 I appreciate Charley Willey giving me feedback that I have attempted to clear the muddy waters in the Comments Section of the previous blog.  Although I am a strong advocate of finding rare Impulse signals at the extremes of the Normal Distribution curve, the “Fat Tails” end as John Bollinger has dubbed this phenomenon, I am frankly amazed at the reaction that this Hindenburg Omen has created around the world where blogs from the Far East, Europe, and the U.S.A. have gone gaga for any bit of information pro or con. 

With all the cross currents in the World as well as the Stock Market where every bit of news drives the Indexes from Moment to Moment,  any insight that gives us an edge of which way the wind is blowing other than the obvious is where I try to ferret for nuggets, and so this particular blog will focus on what might be in store for us from what I have gleaned.

Let’s start at the beginning which is a favorite Chart of mine showing the “folklore” of the Four-Year Presidential Cycle, and it doesn’t take but two minutes to see that the second year is by far the worst. Note that the majority of these market drops occur in the latter half of the year: 

We have had a >17% Correction on most Market Indexes this year, but as yet no Bear Market.  Here is a a snapshot which shows the ups and downs of the past eight months in one chart.  The Heat Map gives us a quick view of how the Market has behaved, where at a glance we can see that the Market has been a highly volatile state in the past four months, where Eurekas and Phoenix’ have fired with reckless abandon.  Newbies reading this blog need only know that a Eureka is triggered by Irrational Exuberance by the Bulls, usually with an Index One-Day gain of >2%.  The same applies to a Phoenix which as you have guessed by now is a comparable rare Impulse signal by the Bears.  Net-net, this is an extremely UNSTABLE Market, and we don’t need an Hindenburg Omen to tell us that.  It has come down to trading intra-day only, and even then most lose money unless extremely nimble:

Over the course of the last month I have shown you on this blog my recent findings with regard to an unusual move in %B of 536 stocks of the S&P 1500 >1.0, above the Upper Bollinger Band.  That’s ~36%.  There has been an unusual flight to Bonds, ETFs and Inverse ETFs, which caused this one day jump from 307 to 536 stocks in the S&P 1500 to extremely ovesbought status. Based on past History the expectation was that within 13 days there would be a downturn.  Now that this has occurred again, the warning gave us 12 days of an impending collapse.  It happened one day before the supposed Hindenburg Omen triggered on the 12th August, after that drop of -2.9% registered with a Phoenix  as shown below, and a Big Kahuna to the downside:

Since then, the Market is trying to struggle back, but so far it continues to meander sideways to all intents and purposes.  Today was another shot across the bow, so the Bull Elephants need to weigh in heavily to prevent the inevitable trend which is setting up to the downside, given that we have the usual gloom and doom months ahead of us, this time leading into the November Elections.


The latest news on this score is that Helicopter Ben has started up a modest effort on POMO again, after a hiatus of 10 months.  You have forgotten all about Private Open Market Operations (POMO)…well it is back and may be the first signs of trying to prop up the Market in these uncertain times.  Don’t take this lightly as there is little doubt that this infusion of cash by the Fed did help to bolster the long Bull Rally in the early part of 2009.  This bolstering may last a few weeks as word gets out to give a perception of the idea that Uncle Ben’s dollar leaflets will get equities to rise again.   You and I both know that the last thing the Administration needs is a collapse prior to the mid-term elections in November.

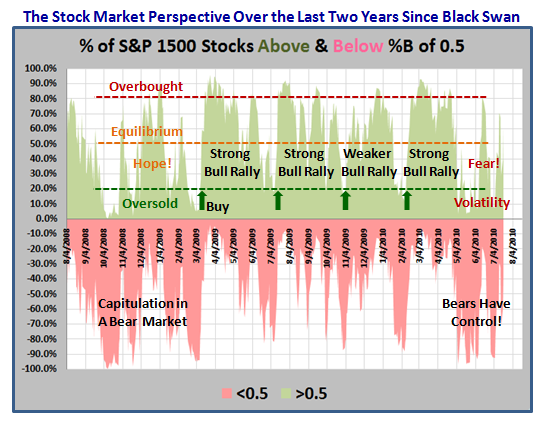
So where do the Internals of the S&P 1500 sit with regard to %B above and below 0.5…Flat with the Bears still in control.  Today’s action will take things down further in favor of the Bears, and clean this rally out altogether before we start all over again:

…And here is another view of the same thing, which shows the Bulls have a ways to go to have any hope of renewing the rally, and today’s results makes that worse (not updated):


So let’s summarize the key points:

1.  The second year of the four-year Presidential Cycle produces the most Bear Markets

2.  We have already had a 17% correction, recovered half of that and sitting vulnerable at present

3.  A Strong Warning Flag of an intermediate top occurs with >500 Stocks in the S&P 1500 over %B 1.0.  One has about 12 days before the rally fades.  I didn’t say die, but corrects.

4.  It may be a coincidence that we had a Hindenburg Signal by some accounts one day after the Internals of the S&P 1500 collapsed and 12 days after the S&P 1500 Peaked with 536 stocks above the Upper Bollinger Band.

5.  The Administration cannot afford to have a Market Collapse before the November Election, and Uncle Ben has started to prop things up with his POMO once again.  Whether that is enough to stave off the Bears driving the market down remains to be seen during the recognized doldrum months of the  stock market season.

6.  The Bounce back has been tepid so far and the Bears are still in control.  Today’s further drop proves that in spades.  The market will soon be oversold once again.   Most are fleeing to Bonds and this area is hot, but that game is fast becoming overbought and vulnerable.

7.  Only Intra-day players have a chance to make money and they too have to be extremely nimble.  The rest would be well advised to take a vacation until this very unstable market settles down.  The tug-o-war between Bulls and Bears has become a farce, and mostly driven by HFT players…in my humble opinion.

Best Regards, Ian.

Hindenburg Omen (HO) – Commentary

Friday, August 13th, 2010

My thanks to all of you who visit my blog faithfully as well as the recent major surge relating to my last Blog Note published yesterday.

I urge you to read the “Comments” already posted at the bottom of that last Blog to get additional summary information on past sightings going back some 12 years.  Please understand that the recent excitement on the HO Signal that supposedly occurred on August 12th, is one of only two that did so with the 50-dma BELOW the 200-dma, and on this occasion at a level of 260 points…well below.   This is approximately 4% and very different from the single other occasion back in March 26, 2002 where the difference was a paltry 40 points below.  As we would expect, all the other signals occurred with the 50-dma above the 200-dma, since the Hindenburg Omen is expected to occur at Market Tops and not after the Market has just come out of an ~17% correction just five weeks ago.

This morning I had a conversation with Kevin Edgeley who is an AAPTA member in London, who gives a possible reason for the occurence, and with his permission  I offer you his note to me and my response for your perusal:

Ian,

Please excuse the direct mailing;  I was given your e-mail by Ron Brown – a fellow AAPTA member.  There has been a fair amount of talk about the HO yesterday.  Could I clarify one thing?  Do you recommend looking only at 52 week highs and lows in the NYA composite (common stocks) rather then the full NYSE listing of over 3000?  It seems illogical to me to use the full listing when this incorporates bond funds and inverse index ETFs?  The full listing seems to show an HO while the common stock NYA doesn’t.

Thanks a lot

Kevin

Hi Kevin:  You are most welcome…feel free to get in touch at any time.  I have the exact same feelings as you do, and I think you have hit the nail on the head.  Like everything else, with the passage of time circumstances change which can upset the apple cart of the good work by reputable people 30 years ago under a different set of conditions. 

Only yesterday, I was discussing with Ron, my partner and good friend of over 12 years that the recent heavy activity in Bond Funds may be “skewing data” regarding a totally different subject.  Add ETFs, Inverse ETFs and the recent new invention of HFTs (High Frequency Traders) to the equation and one can quickly see there is room for error in what was and is a highly reliable set of conditions.  Set that aside for a moment, and even the very data currently used is different from different source data vendors.

 It doesn’t take much imagination to see that the very numbers used to trigger the HO were back engineered to make sure that the triggers were rare and meant to catch Irrational Exuberance by the masses at Market Tops.  It so happens that the concept of working with the extremes of the Normal Distribution is common to my own work, and I latched onto it when I understood the great work of my neighbor, John Bollinger, with his discussion of “Fat Tails” related to his Bollinger Bands.

As I mentioned in my Blog, it seemed extremely unusual to me that we would be triggering a HO after coming out of a ~17% correction, and especially when the 50-dma is well below the 200-dma, i.e., a very weak condition as compared to most of the other occasions.  I refer you to the comments section of the previous blog where I explain in some detail the past history, and although Blaine was quick to point out that the stage in the market is very similar now to 2002, we must be careful as we watch events unfold going forward.   

I am not for one moment “pooh-poohing” (downplaying) what to me was an extremely valuable call back in 2007 for our clientele as witnessed on my Blog (where HO signals came in clumps at Market Tops).  I happen to know the integrity and outstanding contributions of Norman Fosback whose original work helped Kennedy Gammage and other well known contributors in the industry produce what was a cast-iron set of conditions that in essence identified when the Herd was euphoric at tops and the clever professionals were liquidating and getting out of the game before a potential precipitous fall in the market. 

 However, the very name has now come to be a paradise for fear mongering and one only has to look at what has transpired overnight across continents and the entire buzz on this subject to understand what this day and age of the Internet and 24/7 hour reporting can do for the stock market.  The last time my blog had so many hits was when I wrote a tongue in cheek note on the 401-K giving way to the 401-Keg!  I’ll gladly take the exposure in payment for all the times I never even get a thank you, which I know comes with the territory.

By the way, it is a long time since I was in Berkley Square, but your Nightingale sure sang well on this subject today.  I enjoyed talking with you.  We need inquiring minds like yours to understand the differences.

Best Regards, Ian.

The Hindenburg Omen did NOT Volley & Thunder

Thursday, August 12th, 2010


Those who follow my musings, including the large number of Hindenburg Omen followers I have as a result of my early warnings back in November 2007 of potential Market Tops, will strike a chord with this Blog Note today.  I value the mention in Wikipedia of one of the Blog Notes I wrote back then which has attracted a lot of attention from those followers over the years and especially of late.  It’s called “The Hindenburg Omen Signals between 2005 and 2007.”   I knew something was astir yesterday when I noticed a  large number of “hits” on the blog from the Hindenburg contingent, including four inquiries regarding the possibility of a Hindenburg sighting!

As you are well aware, my work looks for the extremes in Market Internals or as John Bollinger would say “The Fat Tails” ends of the Equation, i.e., the unusual Impulse Signals that the Internals of the Market give from time to time.  I realize that to some of you that the “mish-mash” of terms you have had to learn may have little meaning, but I also believe that over time these very signals have been a god-send to us who now see their value.  That’s part of the fun.  Terms like Bingo, Bango, Bongo, Eureka, Phoenix, Kahuna, and Hindenburg Omen are now part of the vernacular and can only be found to help you by using the HGSI Software.  They help in understanding the moods and emotions that rule the Market from Euphoria to Fear, Capitulation, Hope and Optimism to name a few.

So, let’s start with the Definition of the Hindenburg Omen:

Please understand that a single Hindenburg Omen (HO) “firing” does not constitute a confirmed condition…it requires a minimum of two within 36 days, so even if we were to have a spurious signal it is highly unlikely that we will see another one given what has just transpired yesterday.  Furthermore, these signals come in bunches at tops in the market usually after Long Rallies of at least a couple of years or more.  In addition, it would be extremely unusual for one to get such a signal after having just tolerated a >17% Correction in the market only a couple of months ago. Yes, of course, we have seen a spurious Hindenburg Omen fire but they are to be ignored.   Here for the record was the last time we saw such signals in droves, despite what you might read elsewhere on the Internet:

Now as for yesterday, you can see we have a clean slate.  The 52 Week Lows were not quite enough to meet the criteria, and the 52 Week Highs were more than double the 52 Week Lows, thereby violating Rule #5.  Of course times have changed since these rules were made several years ago, especially with the High Frequency Trading (HFTs), doing their stint…or should I say stunt?!  If the market continues to deteriorate, then the chances of the NYSE 10 Week Moving Average continuing upwards is mighty slim to nil, and will also negate any chance of us seeing multiple HO’s any time soon:

My Good friend and partner, Ron Brown, who does a Weekly Report which you can get at
http://www.highgrowthstock.com/WeeklyReports/default.asp nets out the current situation as a Trendless Market:

However, that said, I do have a new “Fat Tail” Measurement of Euphoria using %B Buckets to Identify Early Warning Signs of a Correction in my Newsletter which will be out this weekend.  I will leave you with the following status of the tug-o-war which the Bears are winning hands down.  Remember that what you are seeing is the Percentage of S&P 1500 Stocks which are Above (green) and Below (red) the Middle Bollinger Band of %B = 0.5.  The Bears have it by a whopping 77% to 23% as of yesterday:


Be very cautious how you play this market until you see which way the wind is blowing, but for the moment it is in your face.

Best Regards, Ian.

Somethings Gotta Give Part 2

Sunday, August 8th, 2010

Last week we had the dogs in a tug-o-war and I felt “Somethings Got to Give”.  We had a relatively quiet week after a great Monday with an Eureka Recorded to give the Bulls hope, but we are still in stalemate:

In the last Blog Note, I finished with this chart, but I have updated it to show you that two important things happened for the Bulls this week: 1) The 50-dma has turned up from Flat, an absolute pre-requisite for a Breakout, and 2) As I said above we had an Eureka on Monday, which showed Bullish Momentum:

You will recall that I showed you that we had an extremely bullish signal 10 Days ago when we saw 536 Stocks of the S&P 1500 (over 30%) were above the Upper Bollinger Band.  This had only happened three times since the March 2009 Rally:

So, let’s see what has happened since then and we find that the Index has held up for nine days since then and that we had a small shot across the bow on Friday, since we see that three of the “Buckets” are showing >100 stocks in each below the 0.5 level (Pink):

So let’s take a look at the 4 most popular Market Indexes and we see that they are all poised at the Down Trend-Line as shown, but the S&P 500 and S&P 1500 are leading in that they have already made some signs of breaking out, while the Nasdaq and IWM ETF, which is a surrogate for the Russell 2000, are lagging and the latter is not quite at the red line.  Realize that there has been recent rebalancing of the Russell 2000, so it might be a trifle sluggish at this point:

The Next Chart shows the Pie Diagram for the past two week’s performancer of the S&P 1500 showing %B above and below 0.5:

It shows at a glance that we have come down this last week to a reading of 66%:34%, which is still respectable, but it is getting borderline.  There are now three “Buckets” which have 100 stocks in each that are below 0.5 for %B, so there is some deterioration.

Lastly, the Battle is still on and depending on whether you are Bullish or Bearish, I can tell you that it is still a tough call, but maybe we will know which way the wind is blowing, i.e., do we continue up or do we fall back.  I show the picture…you decide, but tread carefully:

An Eureka or a Phoenix at this stage of events will be the clue.

Good Luck and Best Regards, Ian.


Copyright © 2007-2010 Ian Woodward
Disclaimer: Commentaries on this Blog are not to be construed as recommendations to buy or sell the market and/or specific securites. The consumer of the information is responsible for their own investment decisions.