Ian Woodward's Investing Blog

Author Archive

Bulls are Sad for Good Reason!

Tuesday, January 8th, 2008

Bulls Sad

I’m short on time tonight, but I trust you find I am hitting on all cylinders when it comes to cutting to the $64 questions and posing points to watch for.  So, let me pick up where I left off at the weekend and here are some of the answers we were looking for just three days ago:


Bounce


Likewise, the 12292007 New Year RonIandex of Leading stocks broke the 17-dma and is headed down to test the 50-dma.  This Index has been hit hard in just two days and the five key leaders have taken a reasonable hit…AAPL, GOOG, RIMM, GRMN and BIDU.  The best stocks will correct from 15% to 20% and many of RonIandex are already down to this level.  Only the likes of JASO and a couple of others are holding up well.  The reaction to the AT&T CEO discussion on CNBC where he did not seem to have a rosy outlook was partly responsible for the swoon in the market along with the concern that Countrywide Credit has more trouble ahead with a drop of 17% today.  It goes without saying that the intraday swing on the DOW is now routine, being up more than 100 points during the session and finishing down -238.42 points to 12,589 or -1.9%. Given all of that the DOW has dropped 675 points since the start of the year with a loss of 5.1%, its worst drop percentage wise in five days since the first week of 1978, when it lost 5.6%.


RonIandex


You have the barometer to guide you from the previous Blog Note, and turning to the Nasdaq which has easy yardsticks to remember, we have already come down through two of them at 2600, and 2500, and we are but a scant 40 points to get down to 2400, so hold on to your hat and watch out.  I hope my picture of the two dogs says it all…we had a English Springer Spaniel just like the little fellow on the left with markings which was natural to name him “Saddle”!  Those were Happy Days and bring back fond memories.  Don’t end up like the little fellow on your right.  Remember I repeat it time and time again “When the Wind is at your Back…Attack;  When it is in your Face…Disgrace!”  Good luck.

Best regards, Ian. 

Big Foot is Back and the Others are Looming

Saturday, January 5th, 2008

I am really delighted to see that some of you are refreshing your memory by referring back to previous blog notes such as “The $64 Question:  How Big will the Correction Be?” and “Ian’s Musings – Some Principles of HGS Investing”.  As such, I felt that a picture is worth a thousand words and I can kill several birds with one stone by using the “Quick Glance HGSI Barometer”.


Barometer

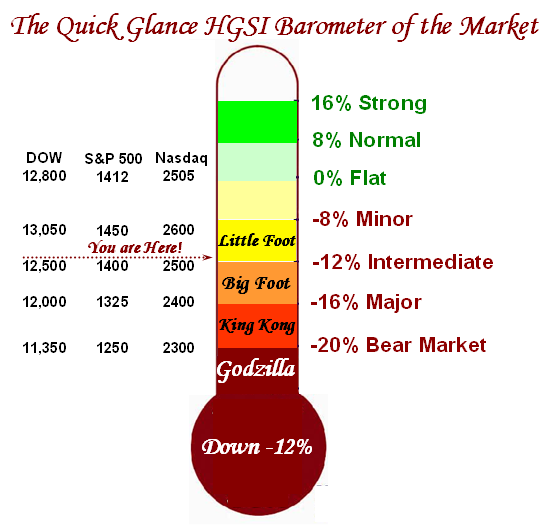
U.S. stocks on Friday sank for a third time this week, with the Nasdaq Composite Index hit with its steepest drop since Feb. 27, 2007, after a jump in unemployment spelled a likely recession for investors.  Since 1949, the unemployment rate has never risen by this magnitude without the economy being in recession, according to John Ryding, a chief economist at Bear Stearns.  The Dow Jones Industrial Average fell 256.5 points, or 2%, to 12,800.2, with 29 of the blue-chip index’s 30 components finishing in the red, giving the Dow a weekly fall of 4.3%.  Broader equities indexes declined as well, with the S&P 500 Index dropping 35.53 points, or 2.5%, to 1,411.63, translating into a 4.5% decline from a week ago. Down for a sixth consecutive session, the Nasdaq Composite Index  was hit the hardest, shedding 98.03 points, or 3.8%, to 2,504.65, with the tech-heavy index falling to lows not seen since the end of August.  

After rising to a record intraday high of $100.09 a barrel on Thursday, crude pulled lower as worries about the economy sparked thoughts of reduced demand.  Oil futures ended $1.27 at $97.91 a barrel on the New York Mercantile Exchange. Ahead of Wall Street’s opening bell, the Labor Department reported U.S. seasonally adjusted non-farm payrolls climbed by 18,000 in December, the weakest growth since August 2003.  Stocks retained their losses after the Institute for Supply Management reported its non-manufacturing index fell to 53.9 in December from 54.1 in November.  Volume on the New York Stock Exchange topped 1.6 billion and nearly 2.5 billion on the Nasdaq, while declining stocks brushed aside those advancing by more than 3 to 1 on the NYSE and nearly 5 to 1 on the Nasdaq.  

Assessing the Damage done on Friday 

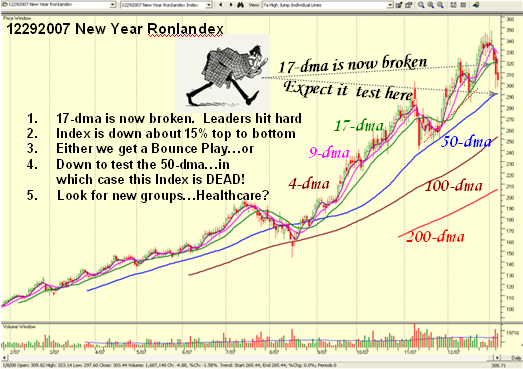
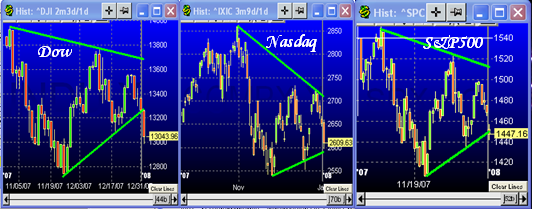
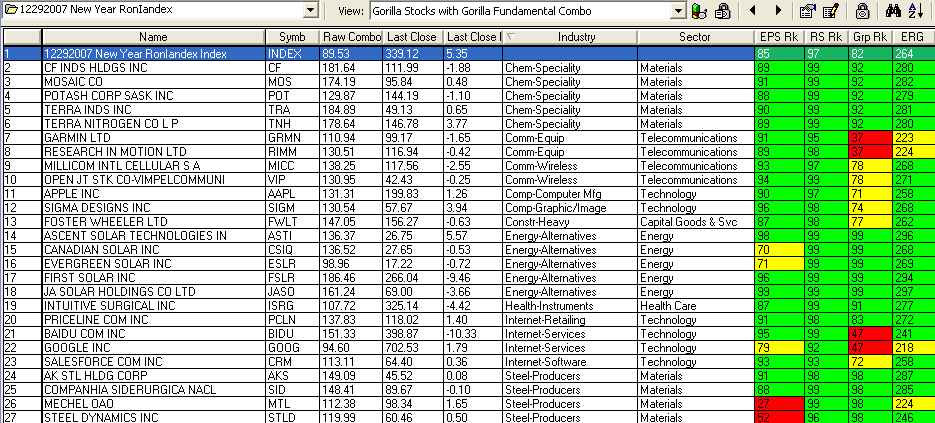
I told you that the RonIandex would give you a good feel for where the market is at.  I know that some of you are asking who needs that when I can see the DOW, the S&P 500 and Nasdaq fall to such an extent and the individual stocks fall on average 5%…between friends? The value comes after the fall to determine:

  1. Are the favorite Wolf Packs still the leaders?
  2. Is the herd buying the dips or waiting for the bounce plays to sell short these very stocks?
  3. What happens to the Gorilla stocks of the five horsemen…GOOG, AAPL, RIMM, GRMN and BIDU?  Are they swooning for a deep correction or will they find a bottom and bounce with opportunities for climbing aboard for the next ride?  As they go, so goes the Nasdaq and Market.
  4. Are we in the thick of a true rotation and if so which are the New Wolf Packs?  Health Care?
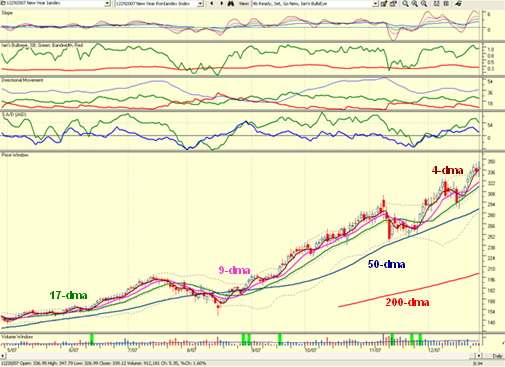
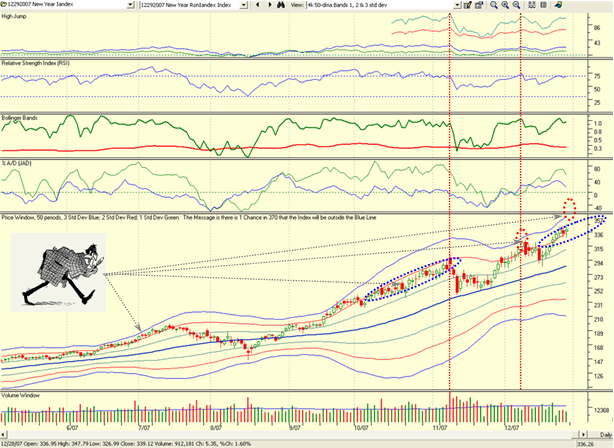
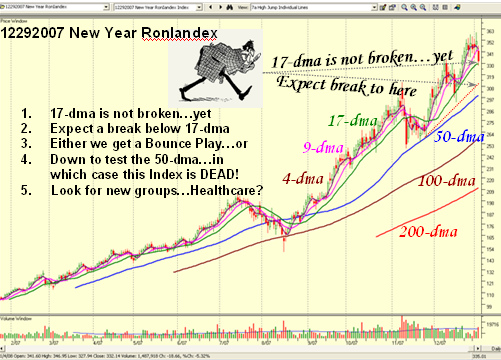
  5. Can the RonIandex hold the 17-dma line or will it confirm that the Party is Over for this set of stocks and hence that we are in for a bleak period with more on the downside?

 chart

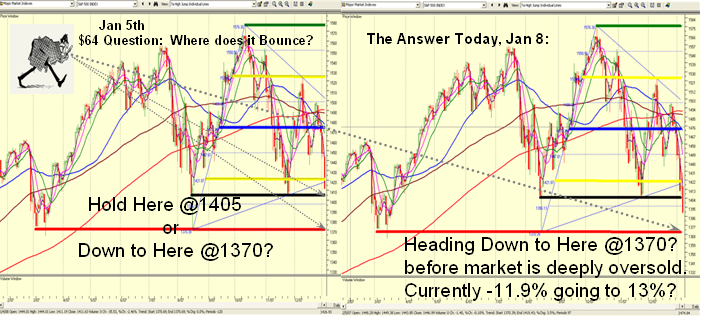
The $64 Question for Monday: Does the S&P 500 hold here and bounce from an oversold Market with five down days in a row or go down further to test the Base Low at 1370?

S&P 500 

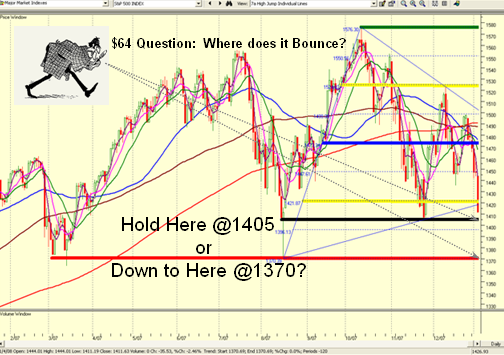
The August 16 S&P500 low has not been tested and eventually will be tested. The wild card is the Fed buying futures and assisting the financials as they did on August 16.  One thing for sure is something will happen to surprise everyone. With the rotten jobs report the tom toms are beating more loudly that a recession is on the cards and for this reason I feel the psychology for the traders has changed from buy the dips to short the bounces, so don’t be too quick to trot back into fallen angels of the previous strong Wolf Packs.  So far the selling was orderly and sustainable, and there has not been a rush for the exits similar to the mid-August downdraft.  None-the-less the selling was brutal with all the favorite stock Indexes indicating a 5% down day…between friends.  Although we have not yet had a Bingo signal suggesting a deeply oversold market we are not far away from that point.      We need to keep an eye on the following: 

  1. What tricks will the FOMC and Administration have up their sleeves in advance of the next Fed meeting towards the end of this month?
  2. What bright ideas might unfold to prop up the economy and hence the Market in the State of the Union Address?
  3. What are the early Earnings Reports showing…good or disappointing news?
  4. How do the Global Markets react tonight and first thing tomorrow…more on the downside?
  5. Watch for the market behavior if a Bounce Play starts…don’t be too quick to buy but consider selling your losers and then possibly shorting the stocks you sell to make lemonade out of lemons. 

You all know what you are doing, but don’t try to ride it through with losers. They go down further.  Best Regards, Ian.


The Bulls are Suffering from a New Year’s Hangover!

Wednesday, January 2nd, 2008

hangover

The Bulls are suffering from a New Year’s hangover…too much bubbly.  The Markets were rocked and Stocks fell sharply on the first trading day of 2008, reversing earlier gains after a key manufacturing report was surprisingly weak and as oil prices neared $100 a barrel.

The U.S. factory sector contracted in December for the first time in nearly a year as new orders collapsed.  The Institute for Supply Management said its index of U.S. manufacturing activity tumbled to 47.7% in December from 50.8% in November. It’s the lowest reading since April 2003 and the first sub-50 reading since January 2007.  The selling continued down as the markets broke down further, sending markets to the lowest levels of the day.  Retail shares traded lower on the first trading day of 2008 as crude-oil futures hit the $100 mark. Investors also awaited word of how retailers fared during the holiday season, their most significant selling period.  Retailers are set to report their December same-store-sales results on Jan. 10, and that will help provide an outlook for what’s in store for them in the New Year…but that is eight days away and in this market is an eternity.  Retailers’ sales at stores open at least a year in November and December combined are forecast to rise by 2.5% or less, according to the International Council of Shopping Centers.  Technology Stocks and the Steels were weak, but Energy Alternatives were strong.

The Dow Jones Industrial Average fell -220.06 points, or -1.67%, to 13043.96; the blue-chip index had been slightly higher just after the opening bell. The S&P 500 fell -21.2, or -1.44%, to 1447.16, and the Nasdaq Composite index was down -42.65, or 1.61%, to 2609.63.  The Yo-Yo Indexes show that the odds are we are headed down to test the recent lows.  The only scenario that can give the Bulls hope is a Bounce Play from an oversold market after four down days in a row.  Best regards, Ian.

indexes

A Happy New Year to You All!

Monday, December 31st, 2007

new

 Wishing you all a Happy New Year from the HGS Investor Team…George, Matt, Ron and Ian.

Stock Market in the Balance – Year-end RonIandex

Saturday, December 29th, 2007

Balance

The weak Year-end Rally doesn’t bode well for the New Year and we come to the last day of trading with the Stock Market in the Balance and can go either way from here.  All the Indexes are at critical junctures at or near their 50-dma, their 200-dma and at support or resistance lines.  Is it any wonder that the two little fellows in the picture are asking each other if they are going long or short in this market?   The Sectors that have outperformed this year are essentially defensive with Energy, Materials, Utilities, Consumer Staples and Healthcare leading and smatterings of Technology, Internet and Telecommunications Stocks more recently.  Chemical Specialty and Energy Alternative Stocks have been outstanding and despite their huge gains will likely confound us and go up further.  Stocks like CF, MOS, POT, TNH, TRA along with FSLR, JASO, ESLR, CSIQ and new found ASTI are all defying gravity.  Technology Stocks which are holding up well are MICC, CRM, VIP, SIGM (recently pummeled but starting a come-back) along with the perennial favorites such as AAPL, GOOG, RIMM, GRMN and BIDU.  The Steel Producers may be waking up again and that should mean that STLD, MTL, AKS and SID should continue to lead that group.  Throw in ISRG, FWLT, PCLN,  and we have a well rounded group of Leaders.  

One popular theory often offered at the end of the year is that stocks laden with profits as these have provided over the year are held into the New Year before selling off to avoid Taxes in 2007 and delay them into 2008.  I don’t subscribe to that notion, but for posterity sake I felt we should go out this year with our best shot at the RonIandex for 2007.  If you haven’t seen Ron’s Year-end Movie which is out today I suggest you do so post haste.  His focus on the Volatility Index (VIX) which as we well know has grown dramatically this past year and the “jumpy gaps up and down” these past three months demonstrates that this is a very tricky market and one must be extremely nimble and short-term oriented at the moment.  There is no traction to show a continued rally or for that matter a steady decline.    I have built on his ideas to develop a consolidated Index of this group of 26 stocks and we will see if they get hit hard or continue to show leadership into the New Year.  As we can see the Index has risen above its 4-dma which suggests that the Index is healthy but over-extended.  Note how this group has hardly come back to its 17-dma, but if it were to break it, it should show us there is rotation underway.  I have brought back my Sherlock Holmes Character to show what you should look for on the third chart, where I expect the Index to emulate its past performance into the 3-std deviation area before it finally gives up the ghost.  I have purposely included four or five stocks in the three groups of Energy Alternatives, Chemicals – Specialty and Steels, so that we should immediately see the rotation should that occur. 

The 2008 New Year RonIandex:Wharehouse

Chart

watson 2

As Sherlock Holmes is showing you with his magnifying glass, we can see that ideally he would like to see the Index climb just below the 2-std deviation line (red line) as it did in the October 2007 timeframe (dotted blue ellipse), but should it stray up to touch the 3-std deviation blue line that will be a strong indication that the Index is way too extended and it would be wise to expect a correction in this Index.    Happy New Year and Best regards, Ian.

Copyright © 2007-2010 Ian Woodward
Disclaimer: Commentaries on this Blog are not to be construed as recommendations to buy or sell the market and/or specific securites. The consumer of the information is responsible for their own investment decisions.