Ian Woodward's Investing Blog

Archive for the ‘HGS Principles’ Category

Stock Market: Fiscal Cliff Fudge!

Saturday, December 8th, 2012

On this quiet Saturday afternoon I see that Finland tops the list of those looking for where the Stock Market stands at this critical Pivot Point, followed by the Netherlands, Viet Nam, Indonesia and we must not forget my friends from Qatar.  That’s not to forget that Australia, United Kingdom and Canada who are always at the top, but the first two are in bed and will log in tomorrow with luck!

I have a New Headline for you from Santa who has a New Chocolate:  Fiscal Cliff Fudge!

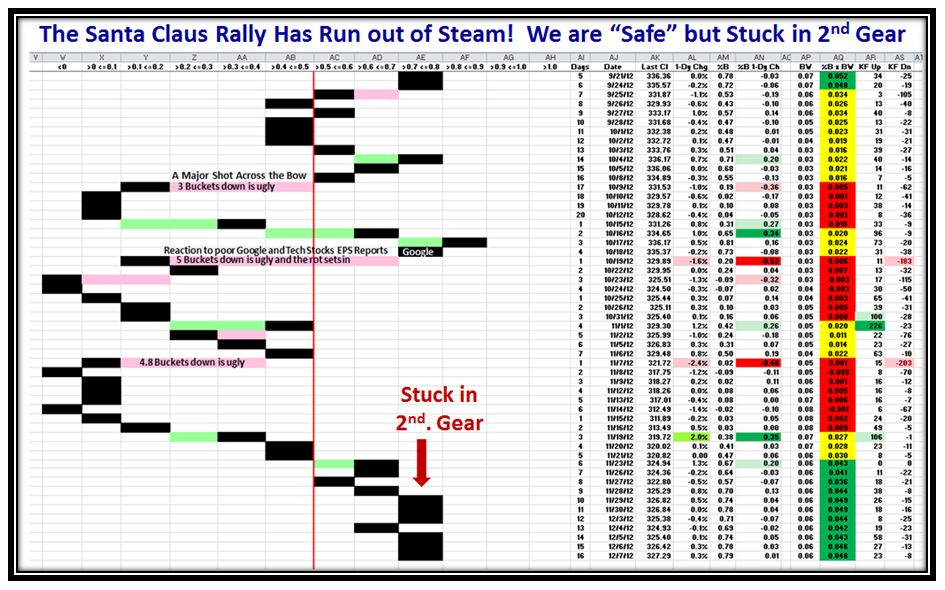
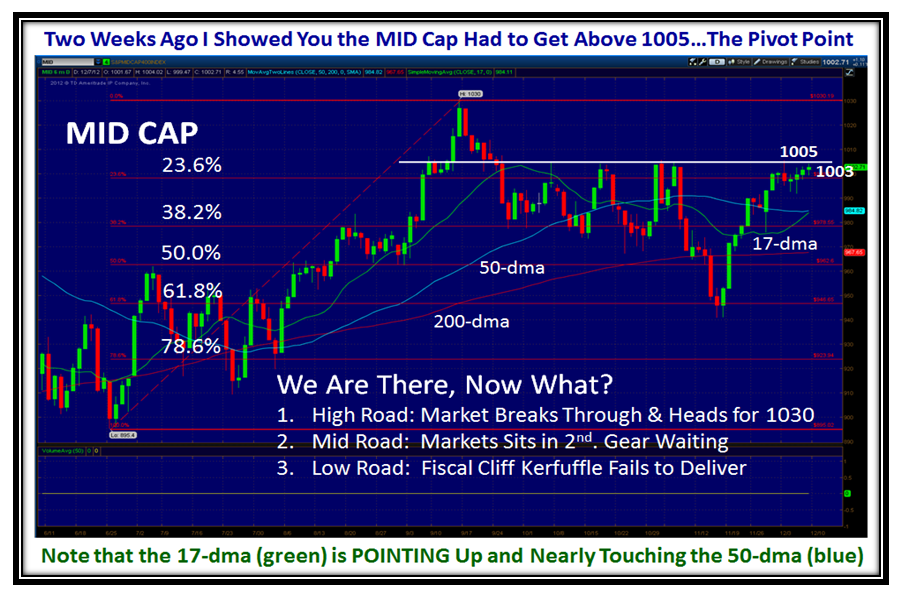
I don’t know about you folks, but frankly I am weary of all this Fiscal Cliff mumbo jumbo;  yet it is patently obvious that the Stock Market is sitting in 2nd. Gear waiting for something to happen.  The best I can do for you is to give you the Three Road Scenario and point out that we are now at the Pivot Point I gave you 2 weeks ago where I indicated the Stiff Resistance the Markets had to overcome.

If you believe the Powers that be will cobble up some Fiscal Cliff Fudge before year end then the general signs of the Market are that it is showing it is poised to go up, so play like a Type 1 or 2 Short Term Trader and have tight stops…otherwise sit out the rest of this supposed Santa Claus Rally which has already recovered around 7% from the recent bottom.  Meanwhile, you do realize we are stuck in 2nd. Gear:

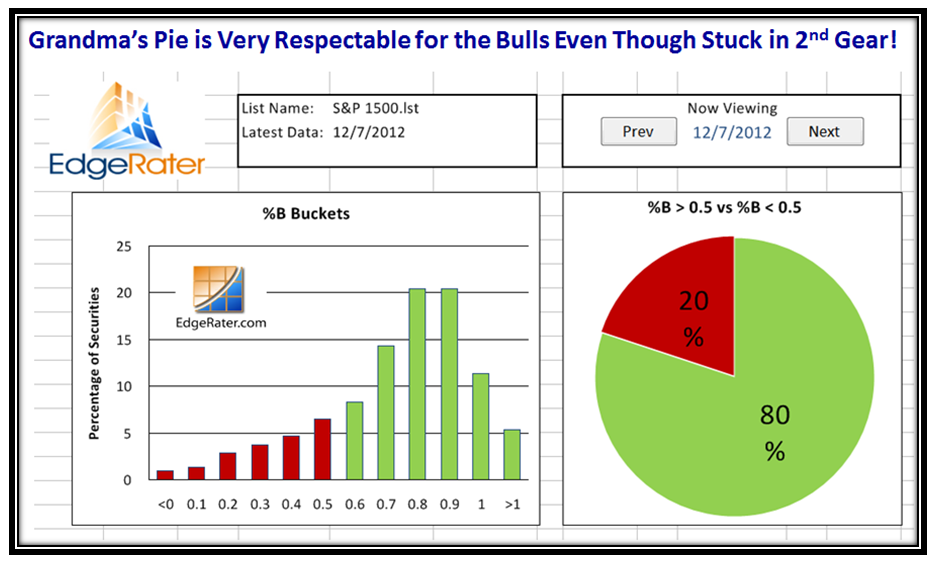
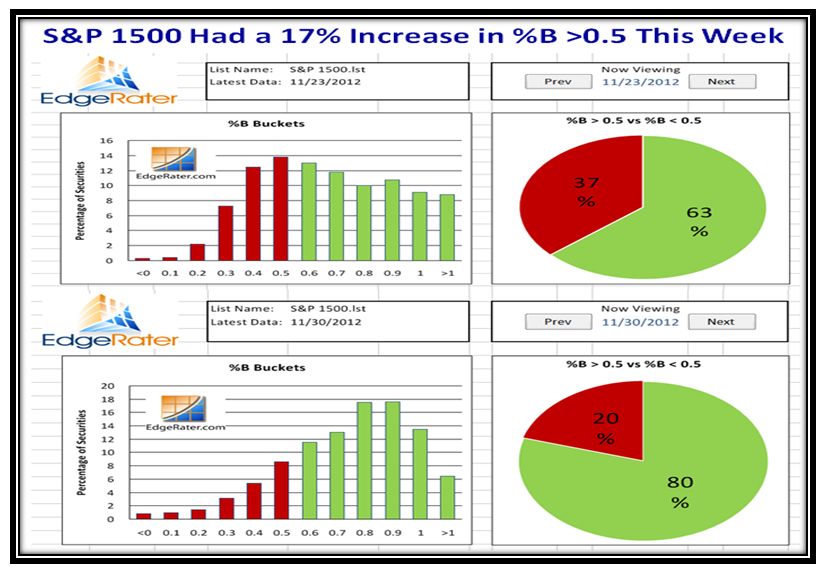
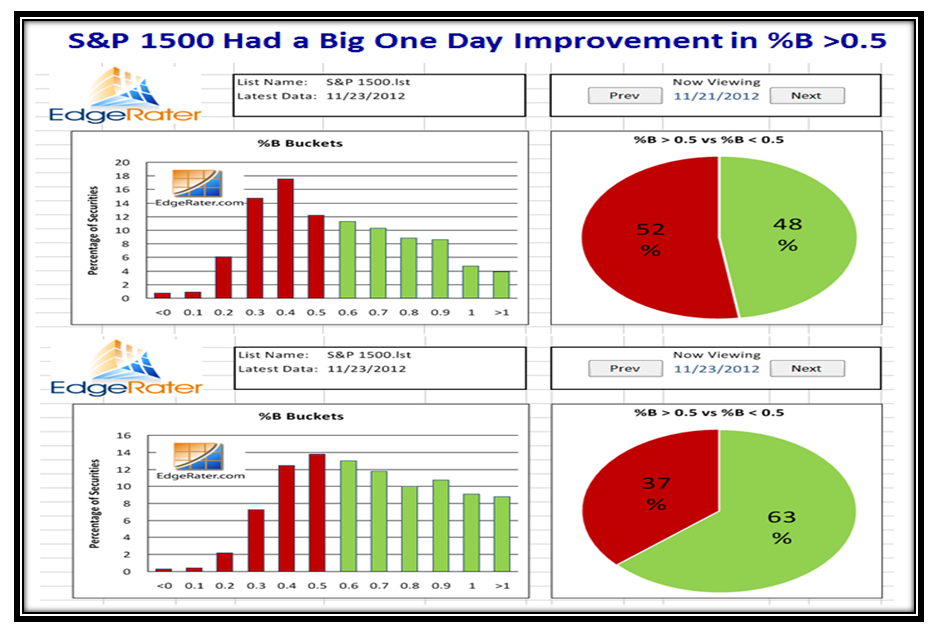
As I say, the internals of the Market are very respectable when we have an 80:20 Ratio in favor of the Bulls on the S&P 1500 stocks above and below 0.50:

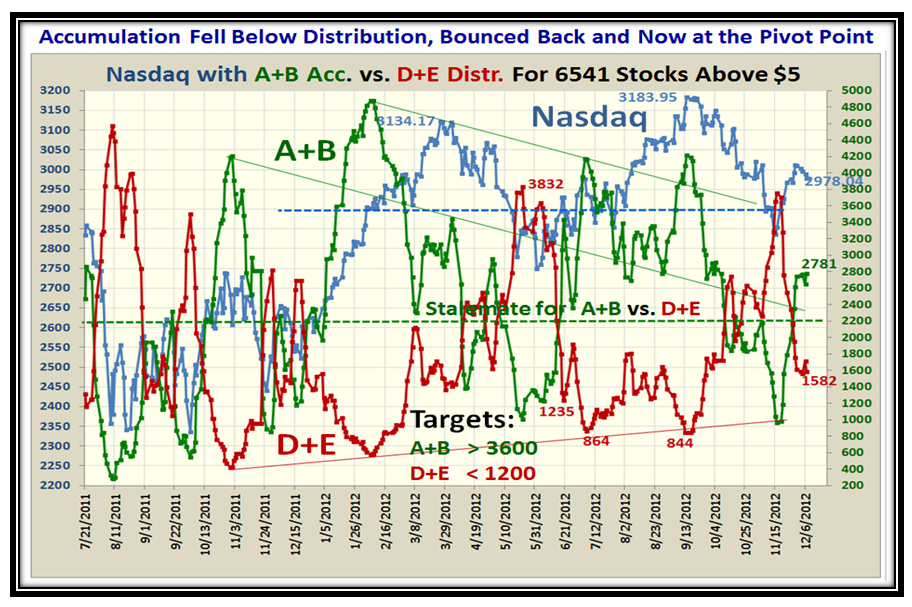
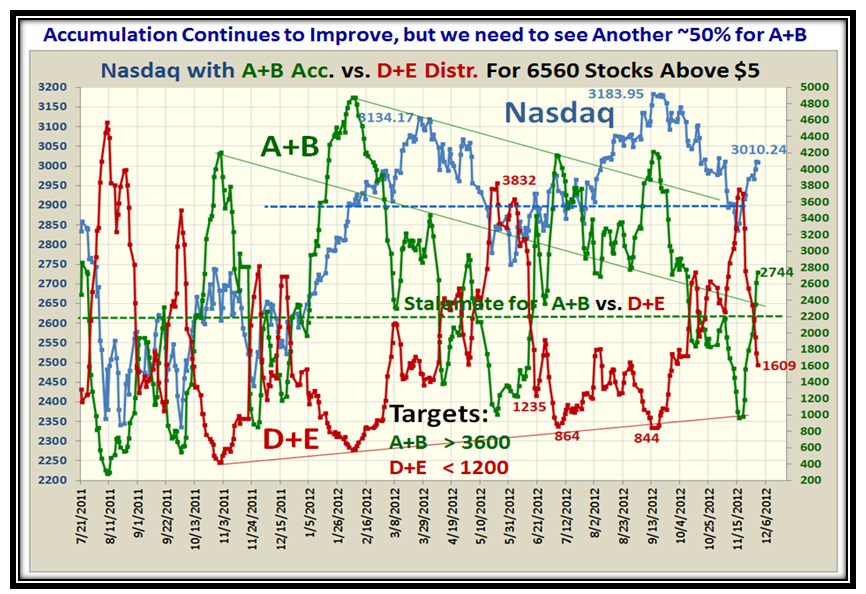
…And, the Accumulation of Stocks is showing the same upward bias, though not with superior strength:

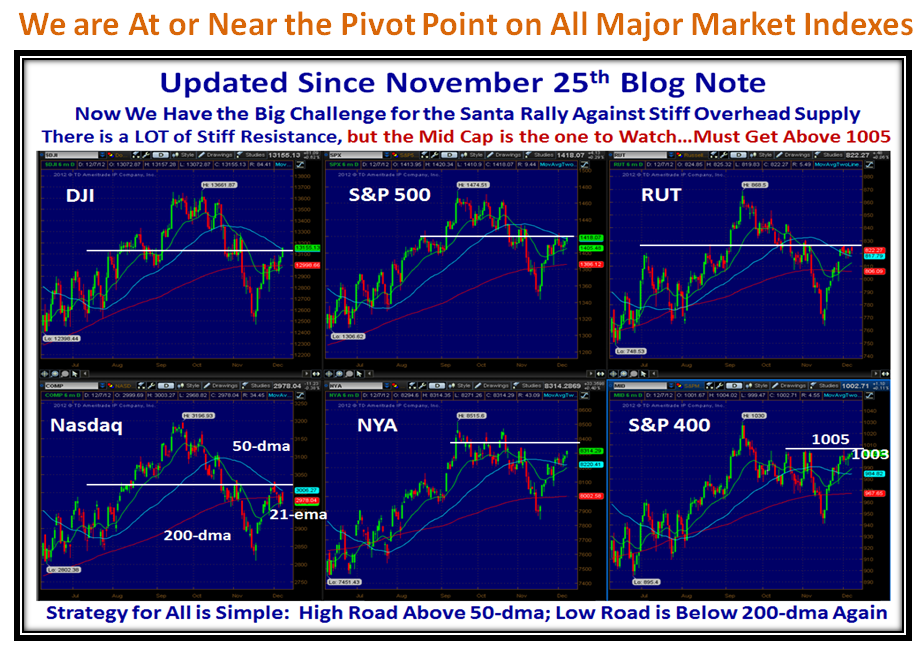
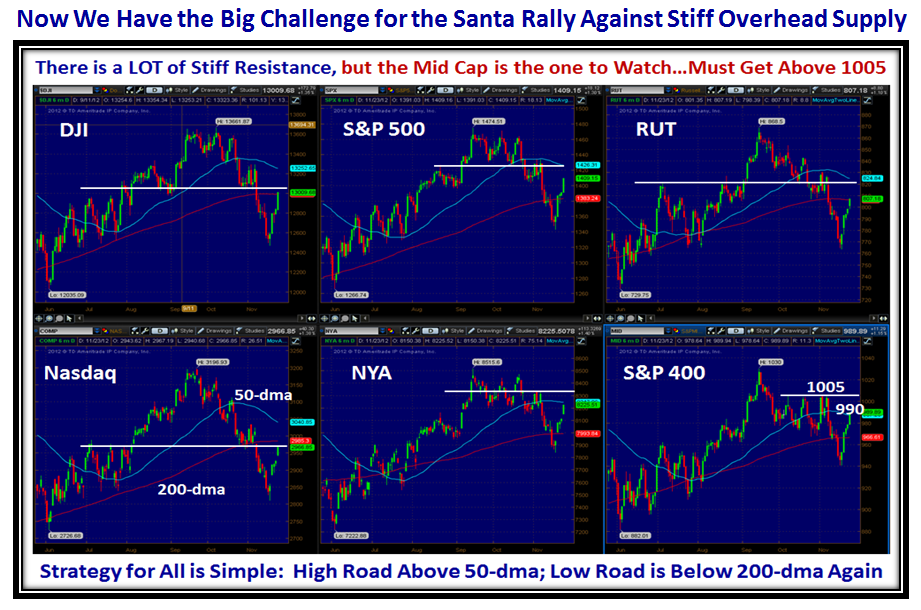
Two Weeks ago I gave you my Thanksgiving Gift and it proved to be of value…We are at the Pivot Point:

I have added the 21-ema which between friends is the same as the 17-dma.  You will note that the only Index that has the 21-ema up (green) through the 50-dma is the Mid Cap S&P 400 stocks, so this is the Leading Index.

So let’s zero in on the Mid Cap Chart and I have given you the High, Mid and Low Road Scenarios with explanations of what the Market should do:

So there you have it, the status and the alternatives for the Road Scenarios.  Please drop us a line if you plan to attend the March Seminar.  It helps us enormously at this end.

Best regards,

Ian.

Stock Market Dancing Like Gangnam Style!

Saturday, December 1st, 2012

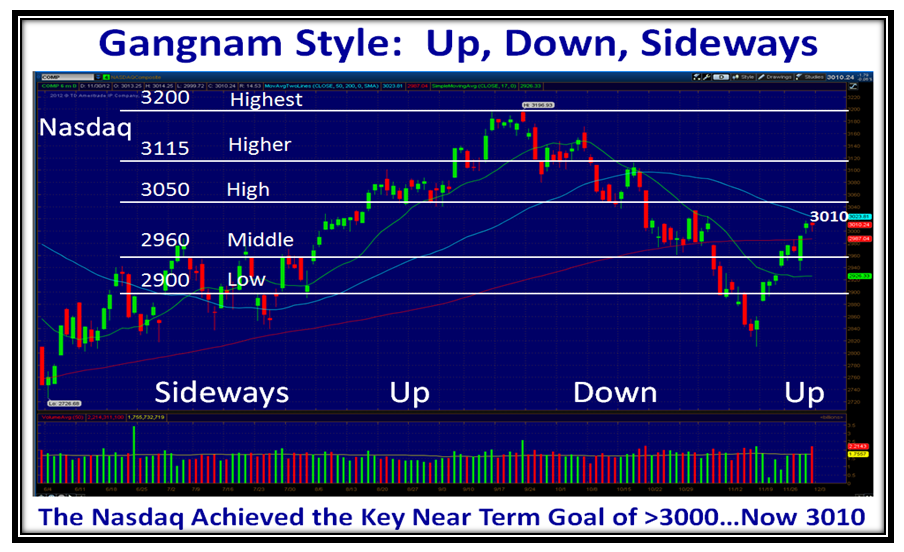
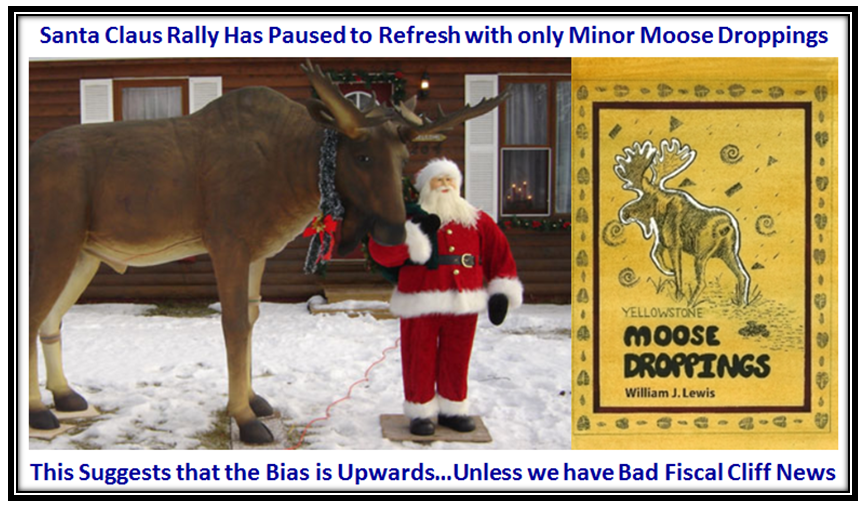
My 11 Year old Grandson danced Gangnam Style at Thanksgiving and I am now in the groove and just couldn’t resist capturing this picture for posterity sake.  I wish I could get 884 Million hits on my blog!

The good news is that the NASDAQ has clawed its way back up above 3000 in this past week and now must face the challenge of moving to the High Road Scenario once again.

The Market Indexes Got a Knee Jerk at the Open on Wednesday, but shot back up to keep the Rally going:

There has been a big turnaround in the internals of the Market and especially the Accumulation vs Distribution ratio.  At least we are now out of the Stalemate Zone so the Santa Rally remains intact:

…And here is another snapshot which will stiffen your backbone with the improvement in Grandma’s Pies:

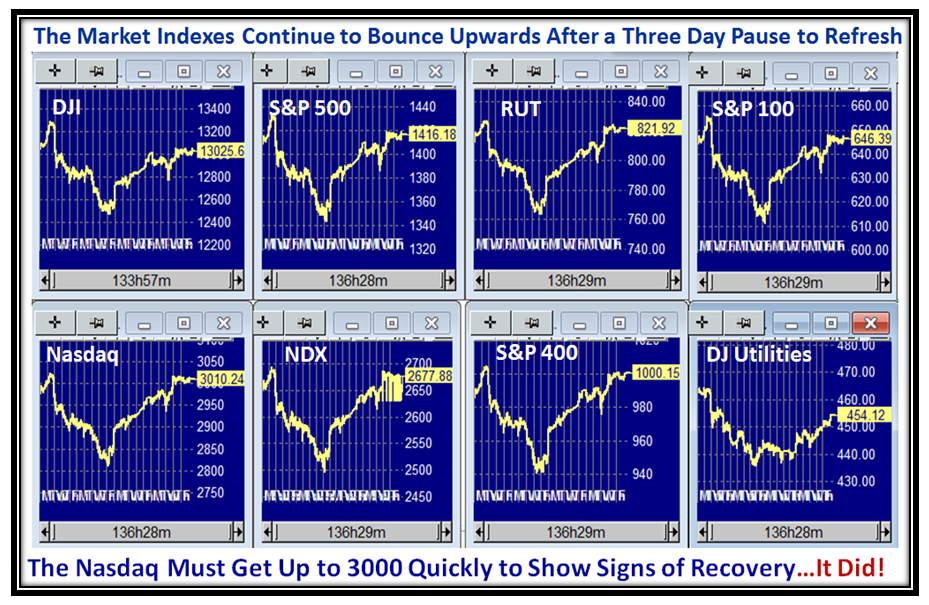
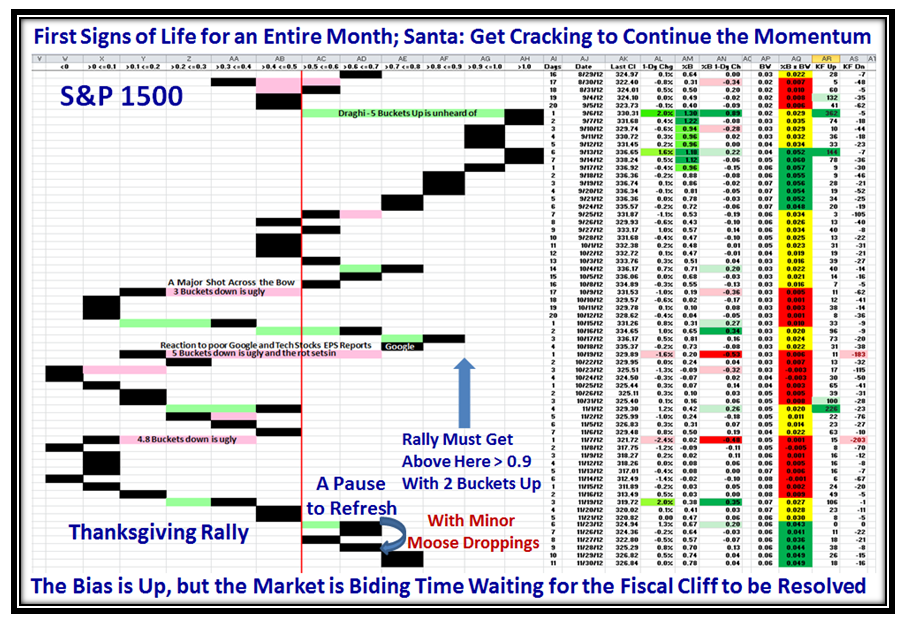
Last but not least we see we had the Pause to Refresh and are now trotting up again, albeit slowly:

…And here by popular request to prove I am a fast learner!

Enjoy your weekend.

Best Regards,

Ian.

Stock Market: Waiting for Fiscal Cliff Fudge!

Wednesday, November 28th, 2012

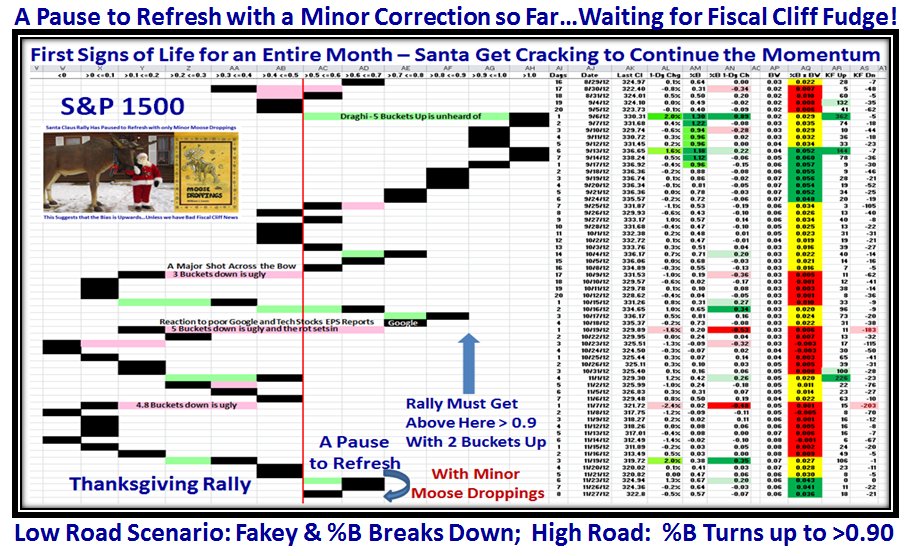
The Thanksgiving Rally is over, the Market Indexes have paused to refresh with the expected Minor Correction the last three days, and today we opened with a “Whoosh” to the downside only to recover and head on back upwards.  Expect lots of Game-Playing as we wait for Fiscal Cliff Fudge:

I warned you to expect a Pause to Refresh ala a Fakey and we got it yesterday.  Today is up as I write so now we need a strong up day for this Santa Rally to continue.  We had a ~35 point drop at the open on the Nasdaq only to recover to being up 13 points as I write this at mid-afternoon EST.

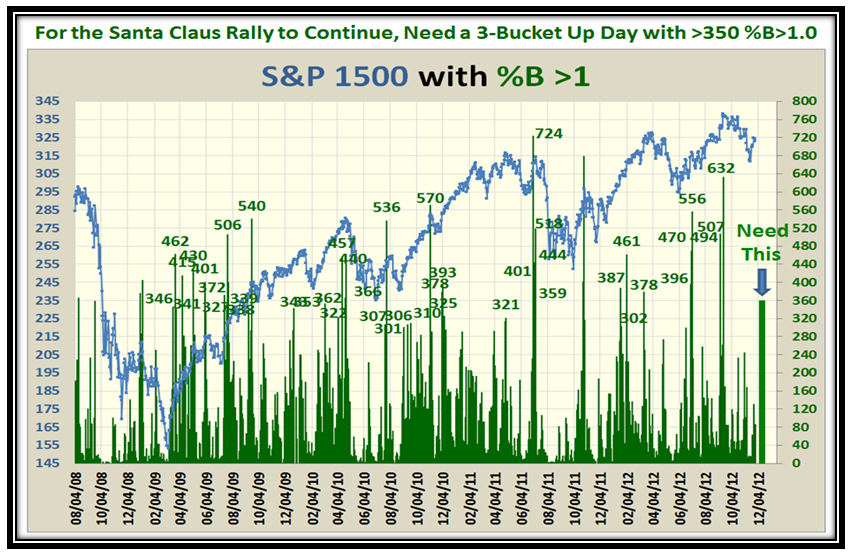
This is the kind of Game Playing to be expected right now, so be on your toes.  We need a 3-Bucket up day with over 350 S&P 1500 Stocks with %B >1.0 to kick this Rally into High Gear…Wishful thinking yes, but that is what it needs:

Best Regards,

Ian.

Stock Market: Hurry Santa Before the Grinch Gets You!

Sunday, November 25th, 2012

We had the usual Rally before and after Thanksgiving Day and now the big Question is “Where Next?”  This is usually the season when the Market has the Santa Claus Rally so that the Big Guns can ensure a decent Year-end result and secure their bonuses.  With the one month dismal drop of 12% in the Market Indexes, Santa must get cracking before the Grinch Gets him:

Why do I say that?  Because we are now at make or break time with the stiff resistance of Overhead Supply on all Indexes:

But now we have something to cheer about and after a dismal month there is hope for a new rally, with what I would call a “pseudo Follow Through Day” with a strong Eureka to boot, even though the Volume was very light…so don’t get too excited:

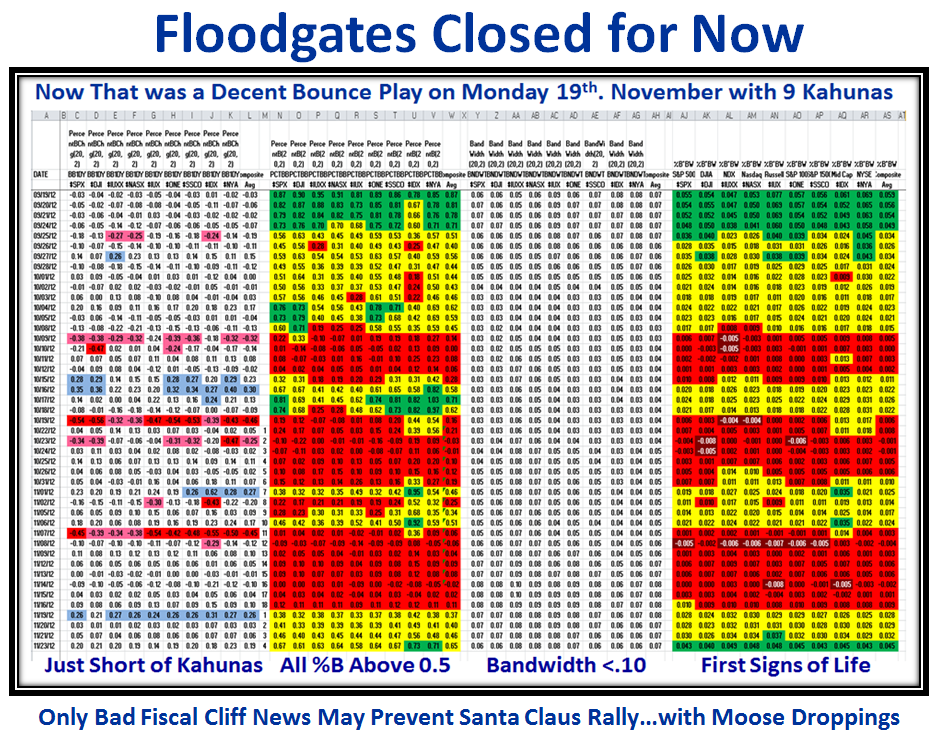
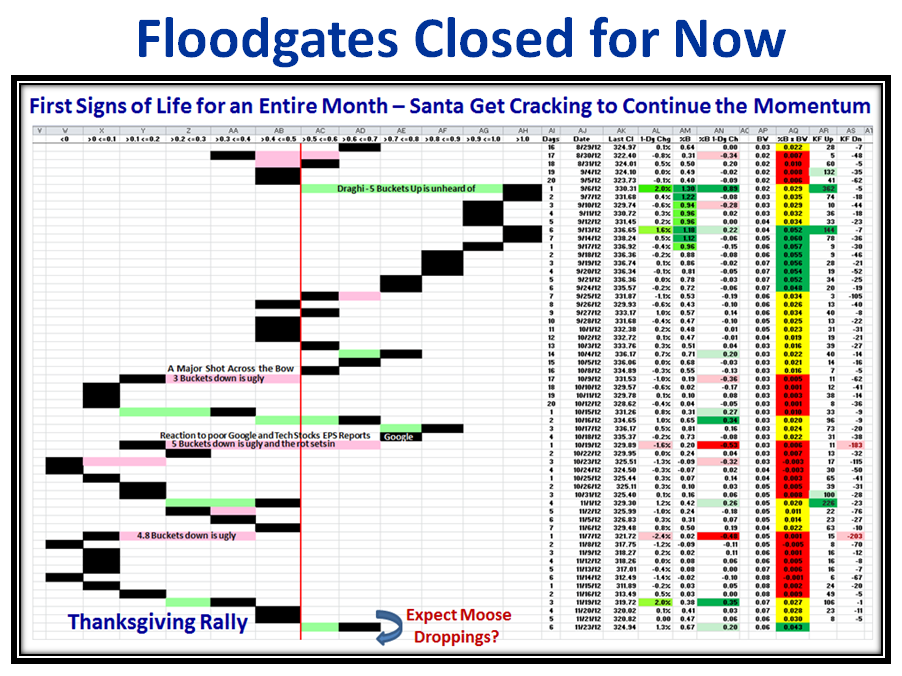
As a result, the Floodgates are closed for now as the %B parameters have started to show strength..we almost had Kahunas on Friday as shown on the bottom left of the next chart, where many of the %B 1-Day Change readings were >= .20.  Also note how the %B is >0.5 and Bandwidth is <0.10 for all Market Indexes, so %B x BW turned Green for the first time in 2 months!

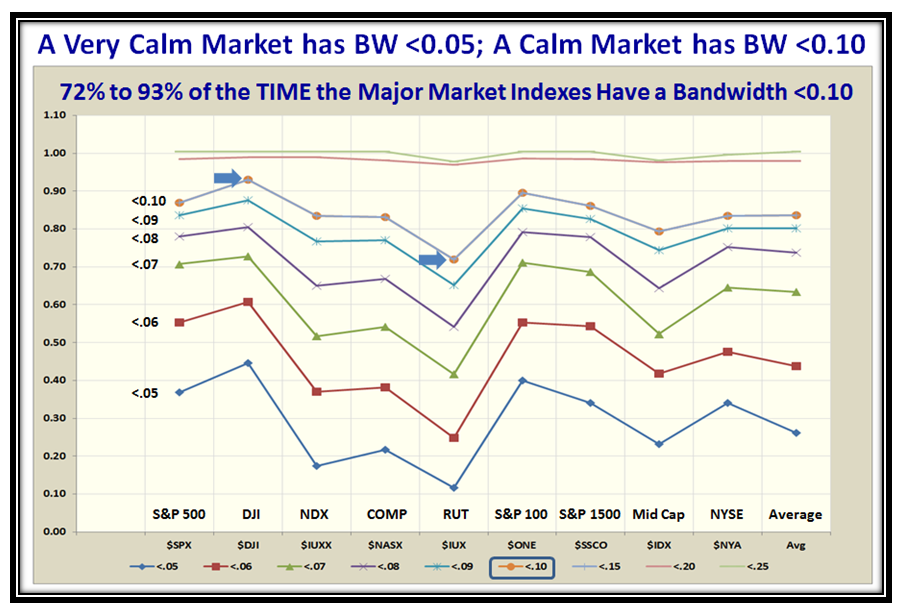
Now here is new research hot off the press worth its weight in Gold!  It shows the statistics for a Very Calm Market and Calm Market with %B for all Major Market Indexes being <0.05 and <0.10, respectively.  On average, it is more than 80% of the time.  When the Market gets dangerous the floodgates open when the Bandwidth first gets above 1.0 for all Market Indexes as I showed you in my last Blog Note.  Enjoy my Santa Claus early Gift to you:

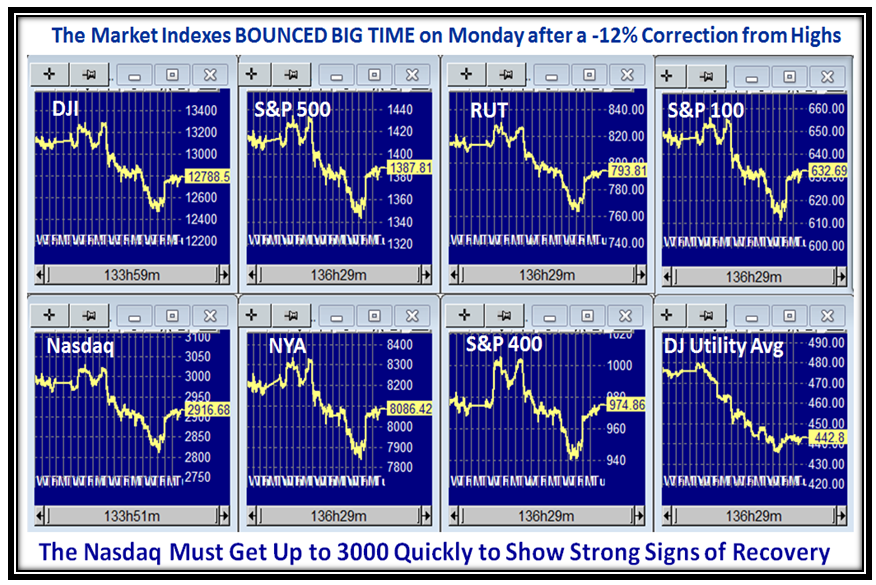
This next chart shows we have had a decent Rally off the bottom in the last six days and we must now watch for a continuation or a pullback.  The extent of the move this next week either way will determine whether the Traditional Year End Rally is strong or is splattered with Moose Droppings!

Have a Happy!  Best Regards,

Ian.

Stock Market: Bulls Got an Early Thanksgiving Gift

Tuesday, November 20th, 2012

We have come around to that time again where we all celebrate Thanksgiving with our Families, and The HGSI Team send you our wishes for a Happy Thanksgiving and thank you for all your support.

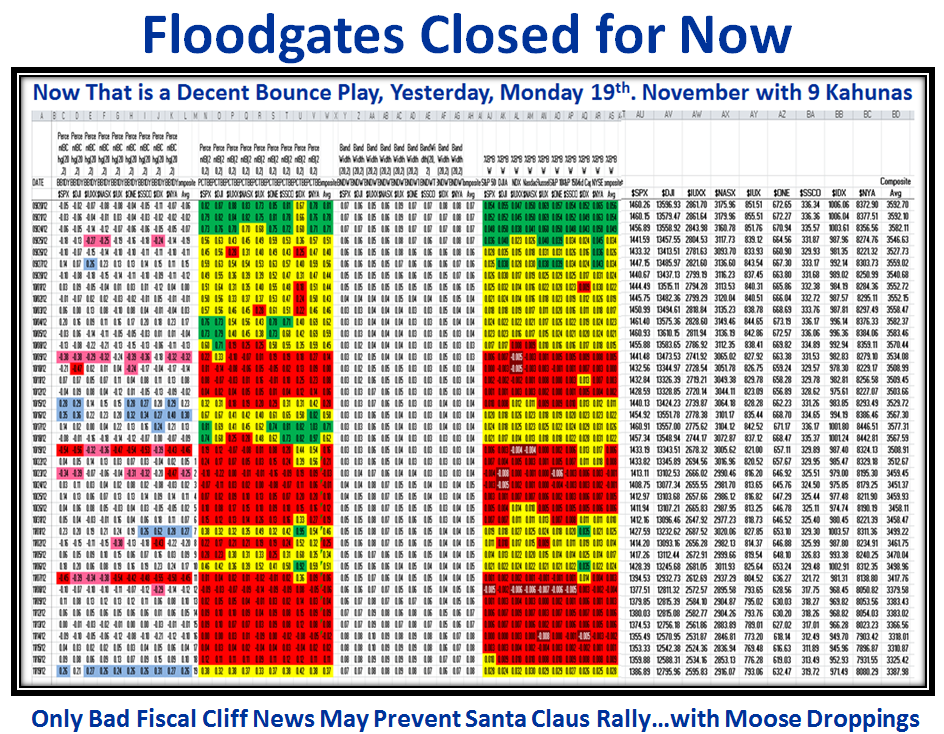
The Bulls were lucky to get a Strong Bounce Play on Monday with a 2% gain for many of the Market Indexes accompanied by nine Kahunas as you will see below that salvaged what was a miserable downward trek in the Market for these past two weeks, to round out a rotten two month drop from the Market Highs with a total loss of ~ -12%:

I hope by now that you followers have got into the swing of it to stay on the right side of the Market and to take heed of the Warning Signs I give you when things are about to trundle down.  For those of you who want a recap, I suggest you try my August 1 Blog for what has become a benchmark of what to look for when the Floodgates are about to open.  I have summarized key slides to give you continuity in the Story Line as I bring you up to date.

The biggest damage is done when we move from Capitulation to Despondency and Depression in the Psychology of the Market, and this is a reminder of the mood swings I often use:

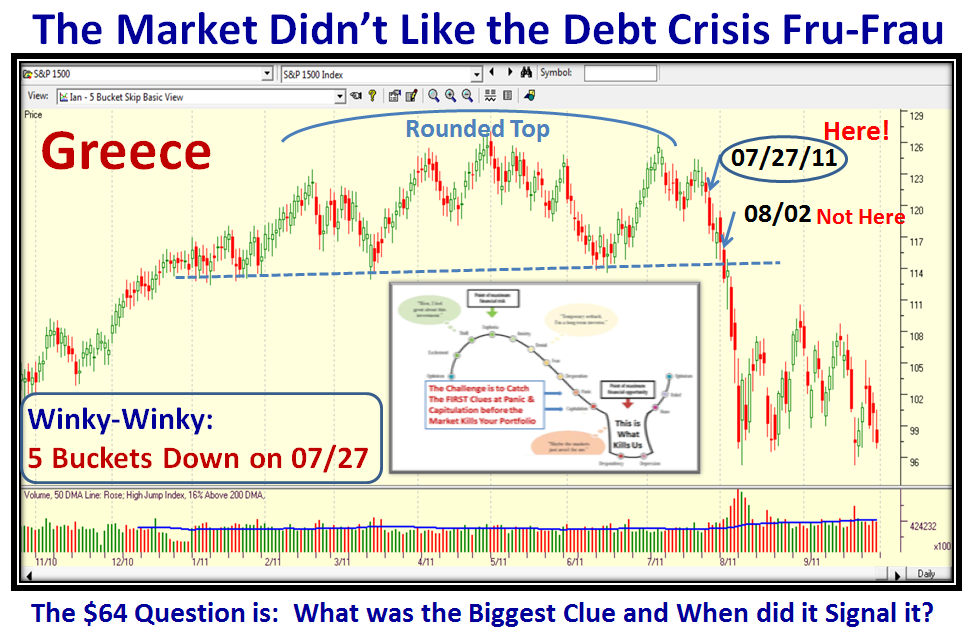
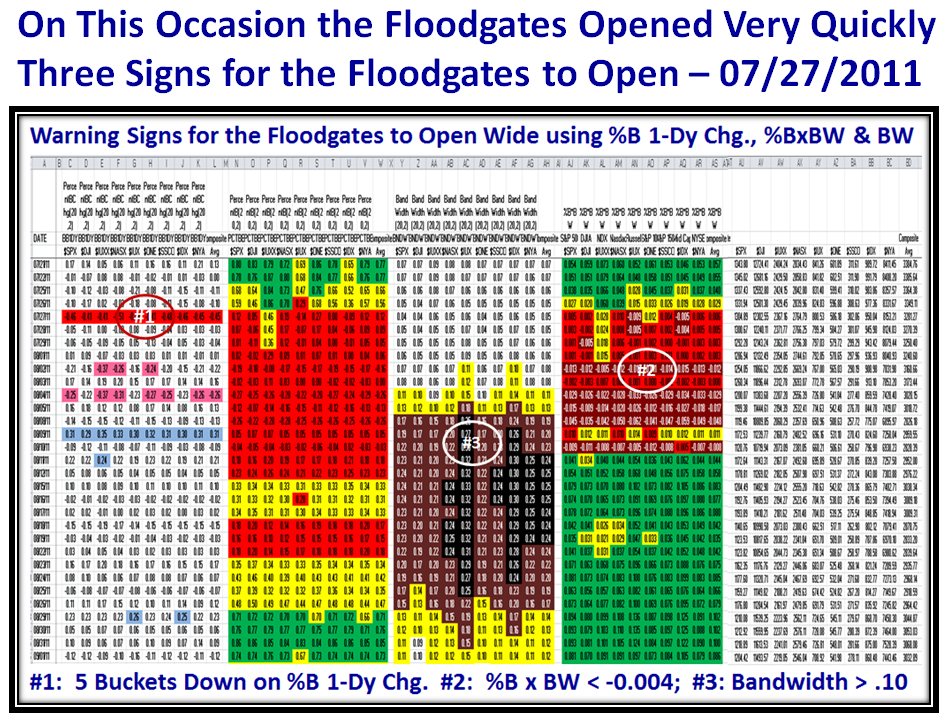
The perfect Benchmark for understanding how to recognize that the Floodgates are about to open was over a year ago when the Global Concern was the Economic problems in Greece.  The following chart captures the essence of what to look for which as you will see from the chart is “5 Buckets Down on %B in one day”:

The net result in a matter of little more than a week was an approximate 17% drop which as the chart shows got the early warning signal on 07/27/2011, one week before other techniques called the usual Market in Correction.

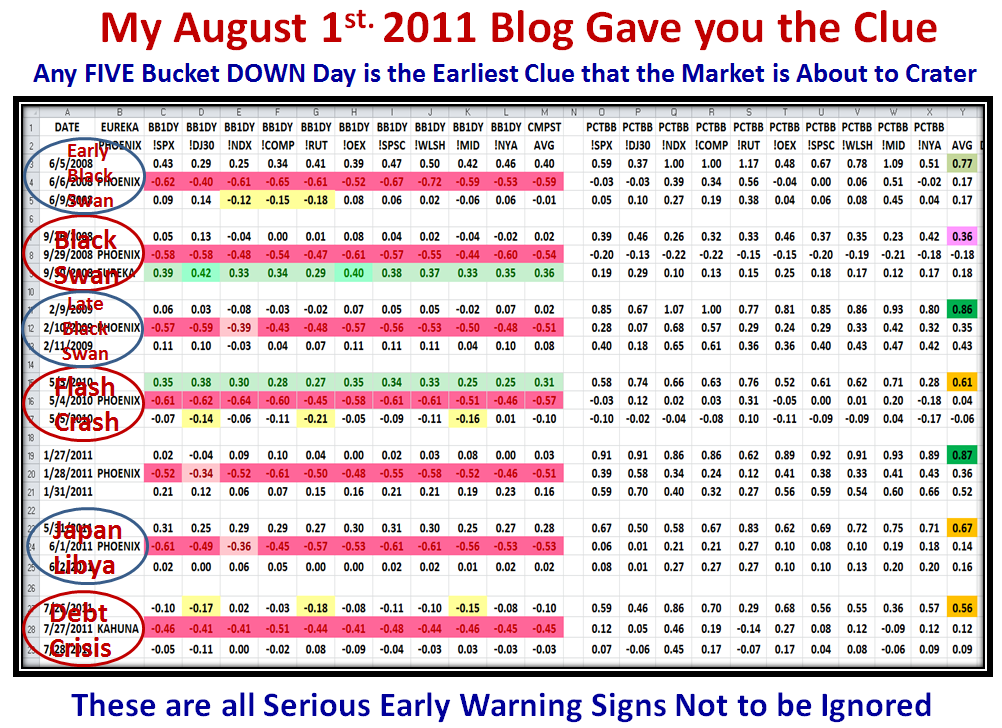
That led me to look back in time to find other occasions when we had a  “5 Buckets Down Day” as shown in the next Chart:

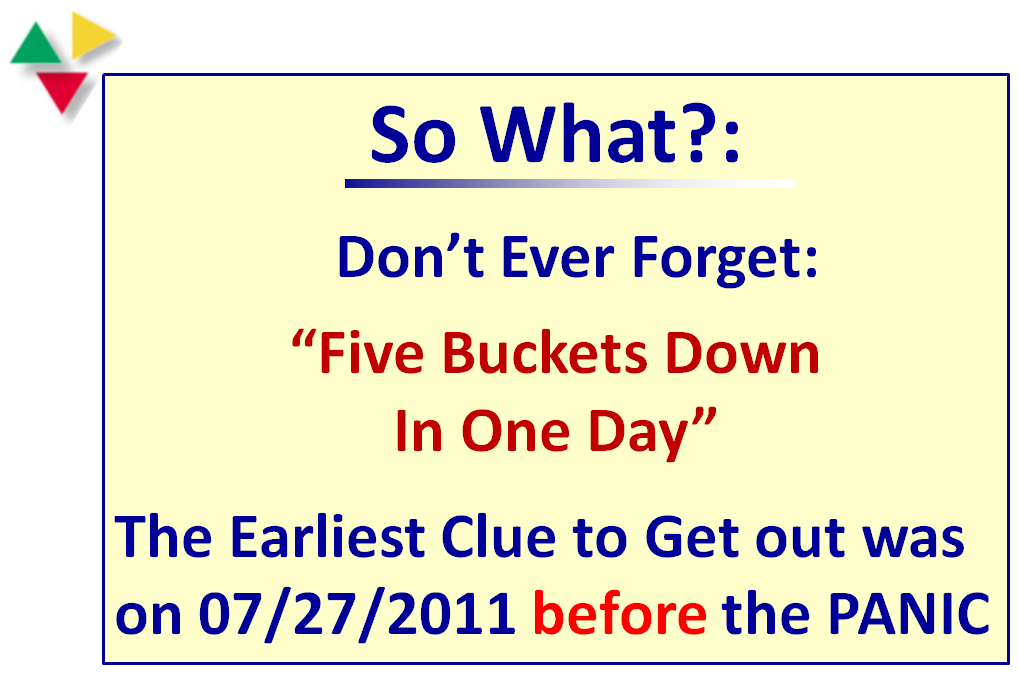
At that time, the Bottom line was never to forget “Five Buckets Down in One Day”:

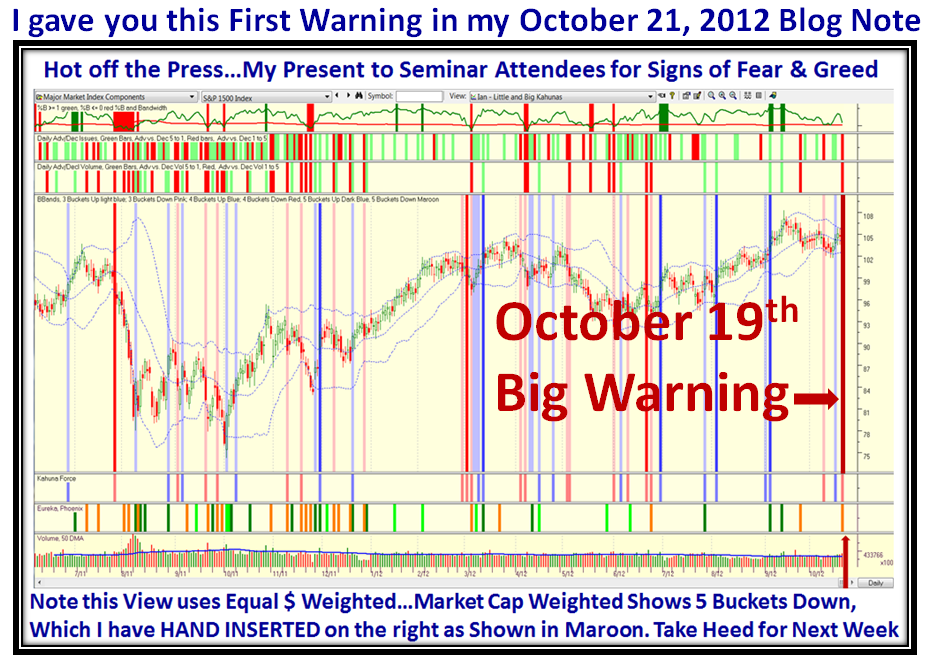
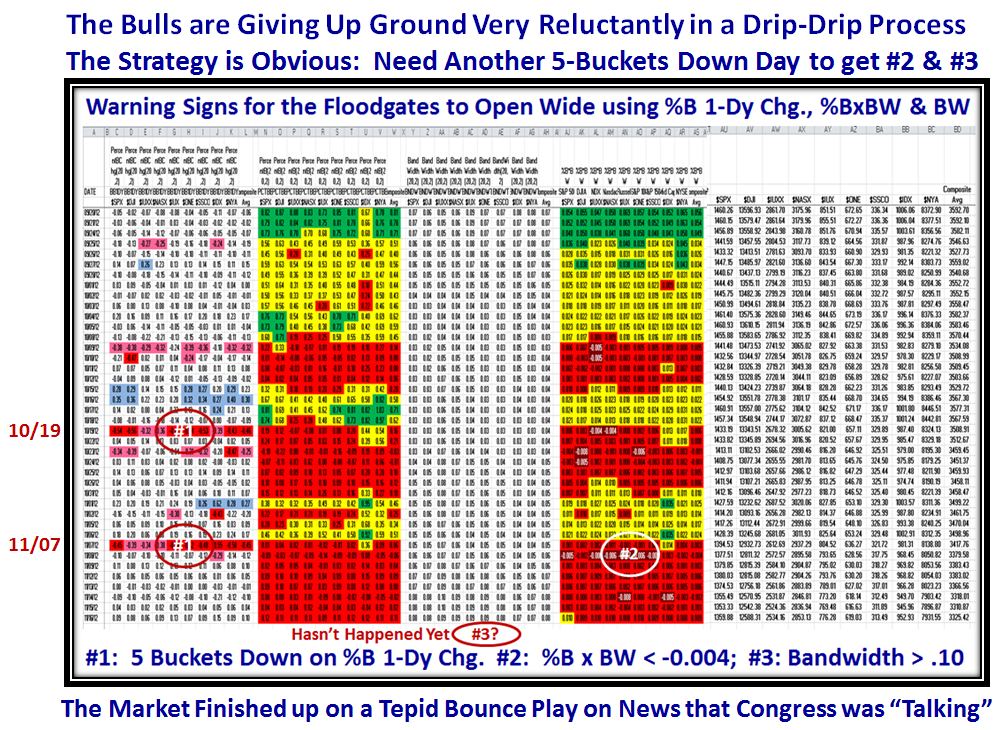
Now let me show you how we can expand on this to truly know when the Floodgates will open.  Let’s fast forward to over a year later when in my blog note of a month ago I showed you this chart with the Big Warning on October 19th.  It is important you review my last three Blog notes as they provide a substantial amount of background of the process and results:

The Bottom Line is that it takes three signals using Bollinger Bands to know when we are on a cliff edge and when the Floodgates start to break wide open.  So, let’s first look at our Benchmark for 07/27/2011 and then compare it to Now!

Don’t bother with trying to read the numbers, its the Color Formatting that is far more important.  On the left hand set of numbers is the %B 1-Day Change for ten Major Market Indexes. As you well know by now Kahunas up are in Blue and Kahunas Down in Red.  Note that we essentially had approximately 5-Buckets down on all indexes on 7/27/2011 as I previously mentioned.  This and succeeding charts are produced on EdgeRater:

Now look across to the 4th set of numbers, i.e., the %B x BW which is dubbed the Woody Indicator and notice #2 in white in that set of columns where all the Indexes are Less than -0.004…that is the second sign.

The third sign comes when the third column from the left, i.e., the Bandwidth opens up to >0.10 on most Indexes and then turns ugly as shown by the Brown and Black cells.

Note how all three signals fired within the course of seven or eight days max! I’m sure you are wondering where we stand to date, so let me show you the picture as of Friday of last week:

I’m sure you can immediately see the difference between the two charts, where the Bandwidth changing above 0.10 has not yet happened, and although we have experienced a 12% drop, it has been more of a drip-drip process rather than a burst of the floodgates opening.

Therefore, the final clue is the Bandwidth must expand rapidly to cause a Major drop of >16%.  Now let’s look at where we stand two days later, where you will recall we had nine Kahunas (blue) that related to an approximate 2% Index Gain as shown at the bottom left of the next chart:

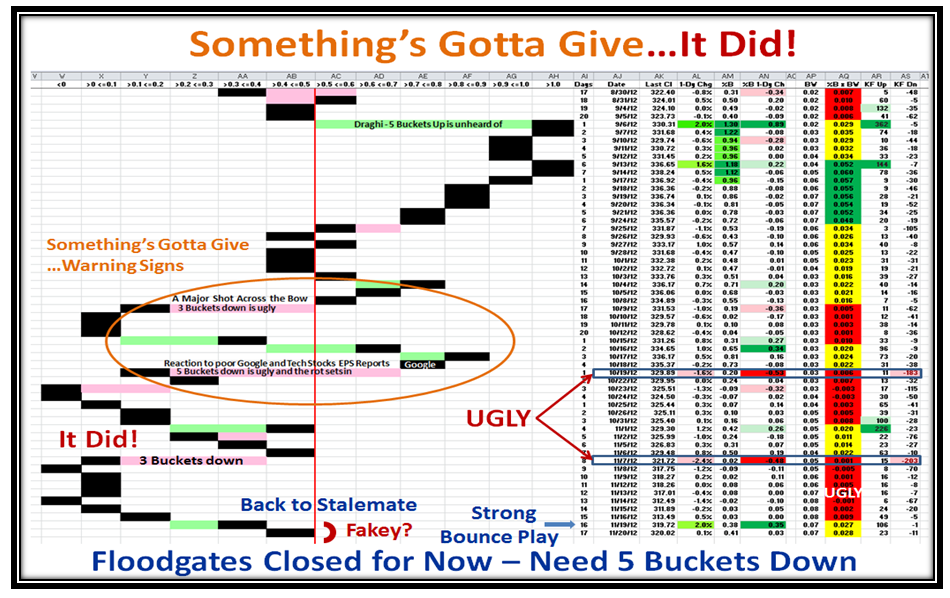
Finally, let’s look at our favorite chart which shows how the Bounce Play has now brought the S&P 1500 back to the “Red Line” of Stalemate.  Now we wait to see if the Bounce Rally can continue to take the Nasdaq back up to 3000 or we have a Fakey and fall back one more time into the doldrums:

All the very best to you and yours as you enjoy each other at this special time.

Ian.


Copyright © 2007-2010 Ian Woodward
Disclaimer: Commentaries on this Blog are not to be construed as recommendations to buy or sell the market and/or specific securites. The consumer of the information is responsible for their own investment decisions.