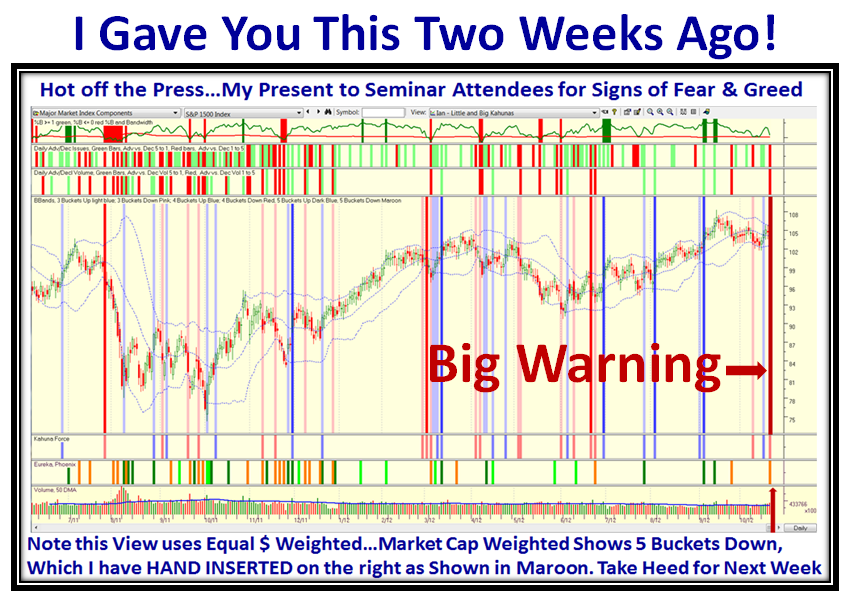
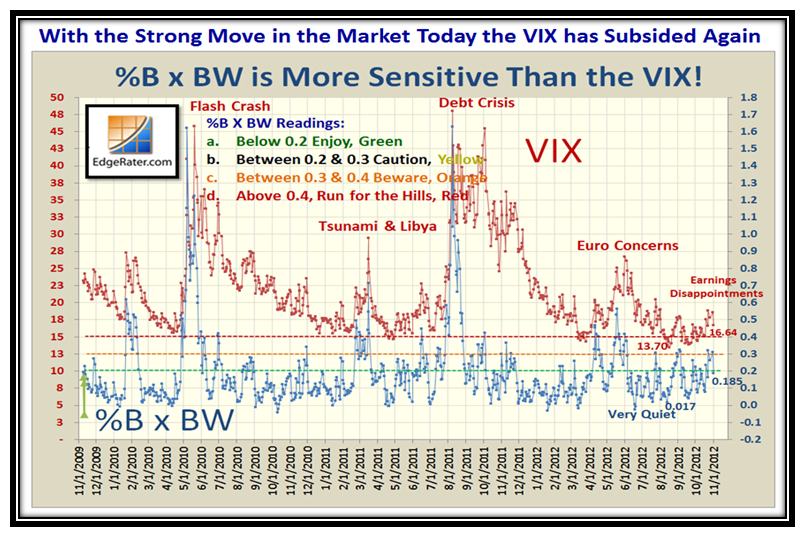
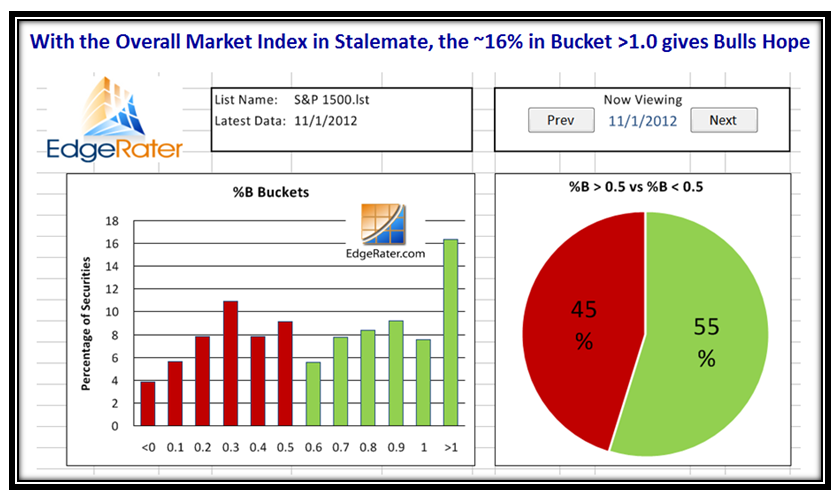
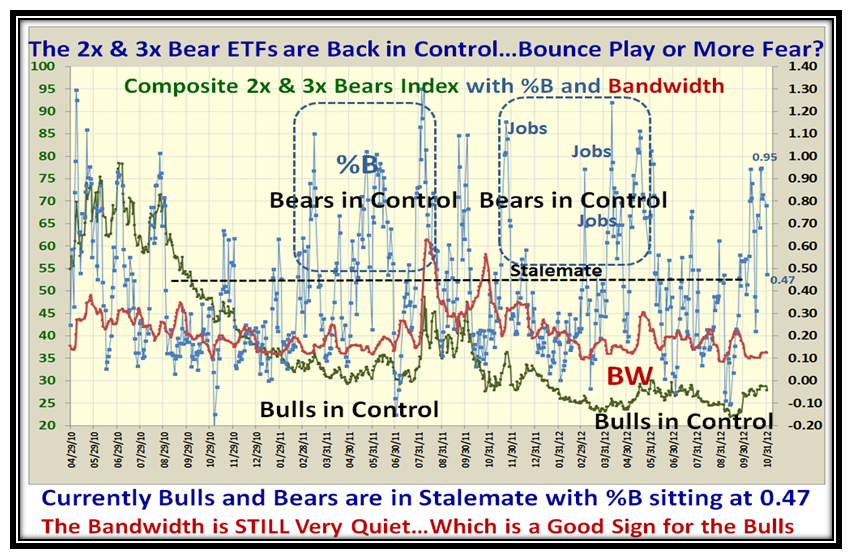
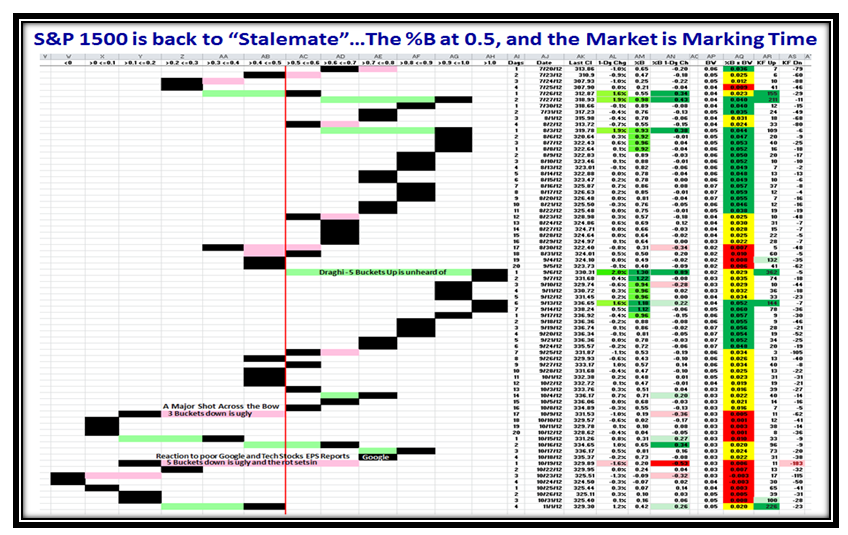
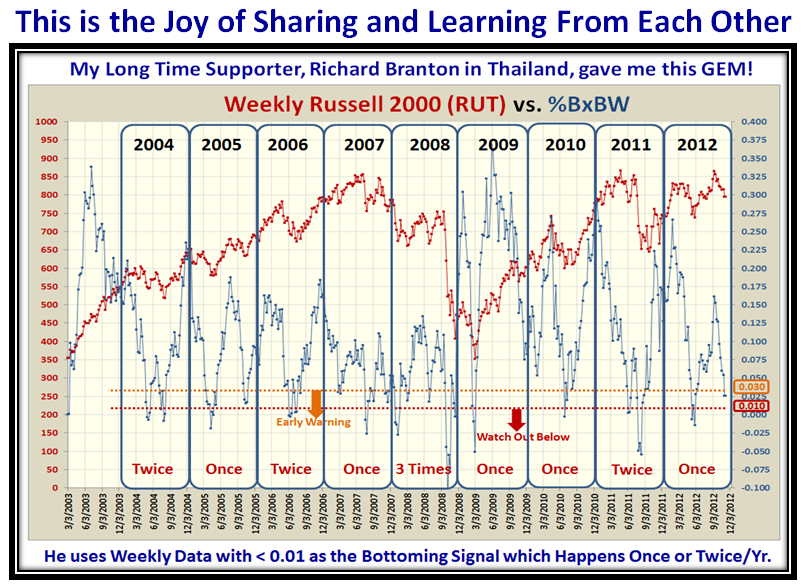
I wonder how many of you read the “Comments” section at the bottom of the Blog Notes? Here is one just two weeks ago from a loyal supporter, Richard Branton in sunny Thailand, who sent me this gem of an idea while I was in the process of feverishly preparing for the Seminar. This blog note is a follow up to his note and my response on October 25 which I am copying verbatim for your convenience, below the Caption:

RichardB Says: October 25th, 2012 at 10:29 am
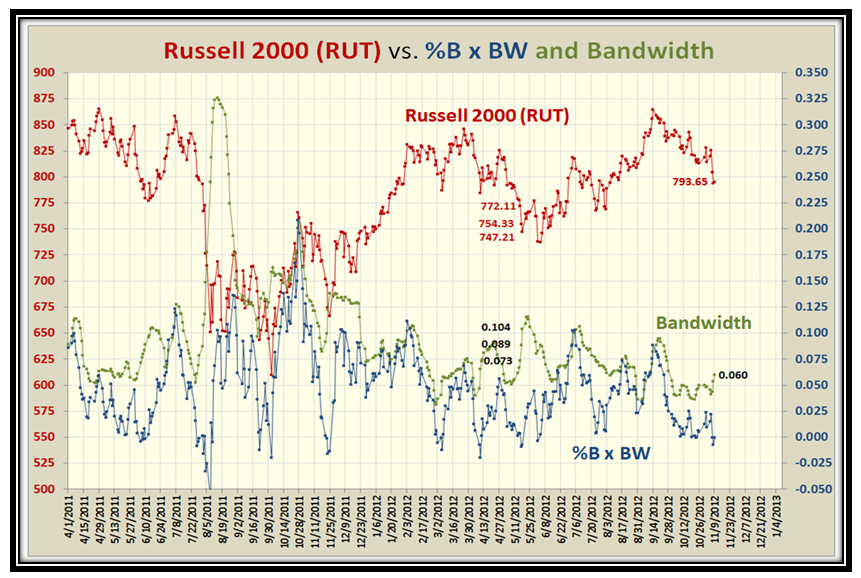
Hi Ian I’m not sure if you’ve looked at this (I bet you have!) but the weekly %B*BW on the Russell 2000 shows some fairly distinct peeks and troughs going back to at least 2004. %B*BW falls below 0.01 once (or occasionally twice) per year virtually every year, almost like clockwork. The peaks and troughs reach very similar levels, albeit higher peaks since 2009 after the huge volatility of 2008/9. Turndowns from peaks sometimes “lead” prices, but there is an obvious correlation (as I suppose is to be expected). This becomes even more obvious if you add a short moving average.
Since mid September I’ve been watching the most recent turndown and it’s going to be interesting to see if %B*BW falls to or below 0.01 sometime before January. In my own trading I sometimes get too focused on daily price action so I’ve found your work on %B*BW invaluable to making me look at the weekly picture in order to put the daily picture in context. I’ve found the %B and %B*BW extremes on the dailies also seem to fit fairly snugly within these larger cycles, and along with some other indictors, it’s also helped put pullbacks within a downtrend in a better context. I plan to do some more work on this.
Anyway, I just wanted to say thanks again for sharing your thoughts and experiences so generously. I started reading your blog and using HGSI from the first few weeks of my trading and they been a tremendous aid to learning to “become my own expert”. Thank you very much! from Thailand
Ian Says: October 25th, 2012 at 5:27 pm Many thanks Richard for the great feedback. As the saying goes “There are no flies on You!” We do watch the RUT closely, but your beady eyes spied something that had not fully registered with me: “%B*BW falls below 0.01 once (or occasionally twice) per year virtually every year, almost like clockwork.” We reached 0.000 yesterday and are back to 0.006 tonight, so not out of the woods yet. All the best to you and yours, Ian.
Now that I have recovered from the exhilarating Seminar, I went back to study what Richard said and he has found us a gem! Not only can we watch the VIX with %B x BW, but also the Russell 2000 (RUT), which works almost like clockwork and is so infrequent that it’s an extremely good signal. I will be preparing the November Newsletter this week and will include this piece for us to discuss at the Roundtable the following week.
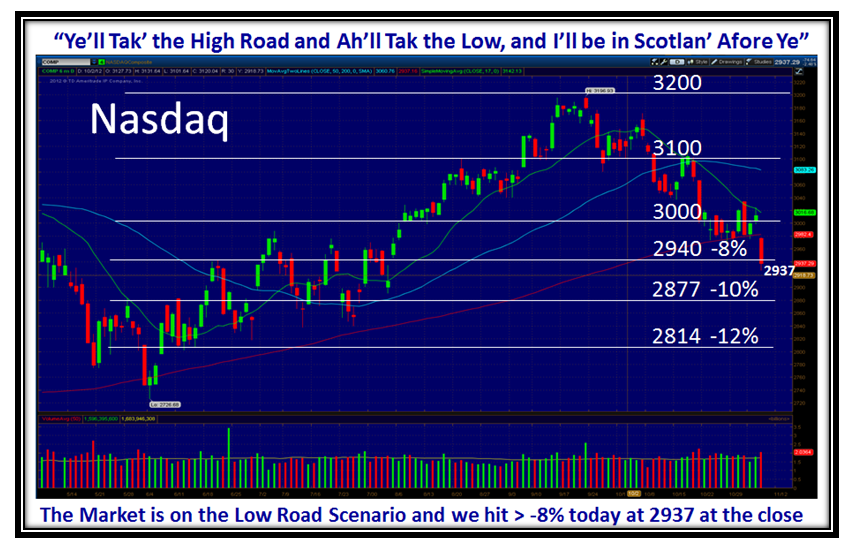
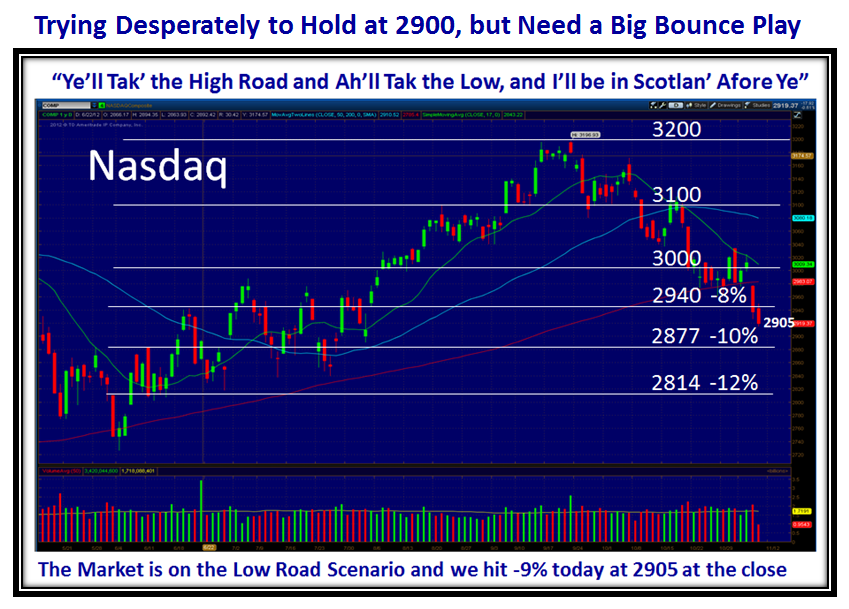
Let’s start with the familiar picture of the Nasdaq, followed by the VIX and the %B x BW, i.e., the Woody Indicator:
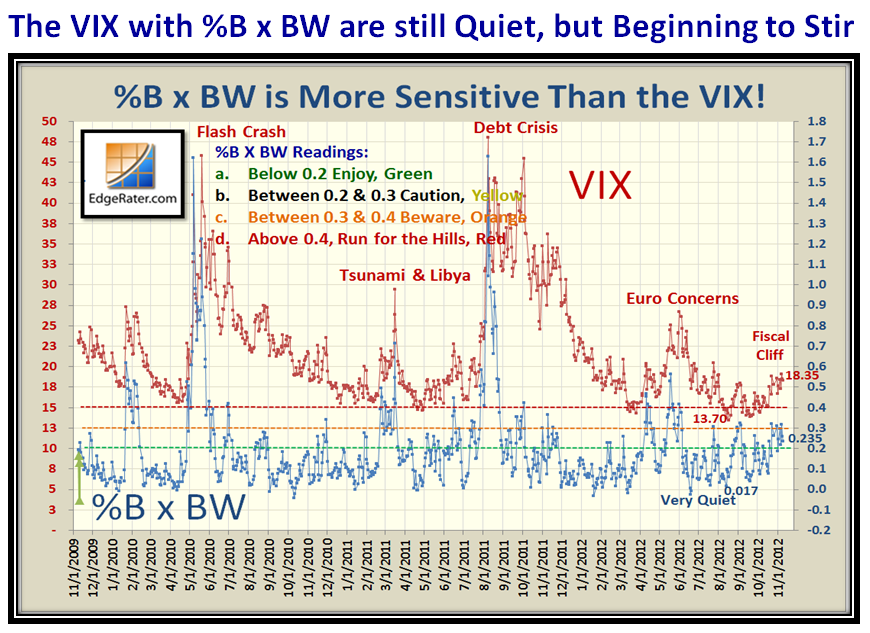
…Although the VIX and Woody Indicator are still on the quiet side, they are beginning to stir, but not quite volatile enough for floodgate action:
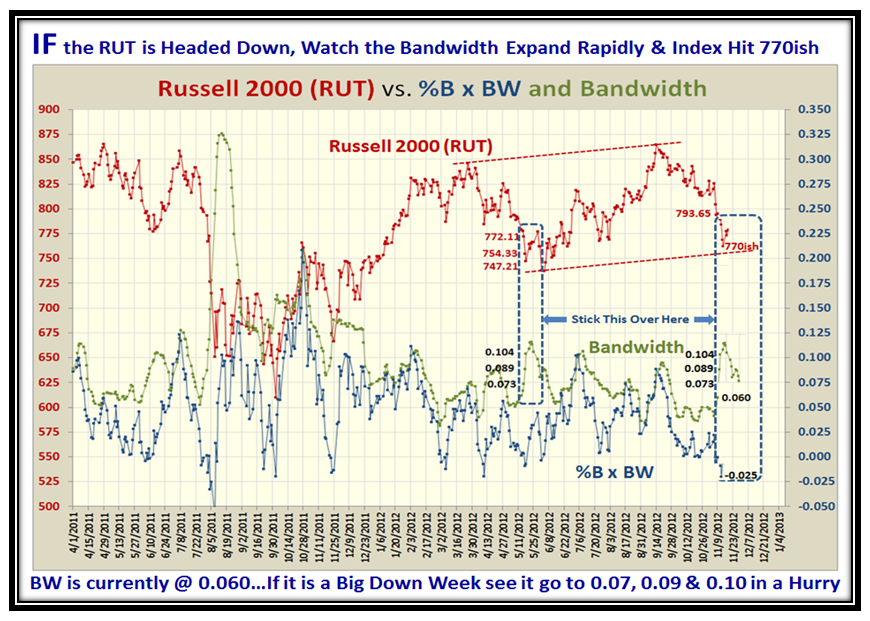
Now we have Richard’s GEM which shows that we can not only get confirmation that things are a trifle tight to the downside, but also a measure of when the floodgates open and how close we are to it happening by using the Woody Indicator with the Russell 2000 (RUT). The beauty of what he has discovered is that this signal occurs very infrequently but at least once or twice a year, and we are mighty close to the second time right now. As he explains above, he used WEEKLY Data as I have reconstructed below:
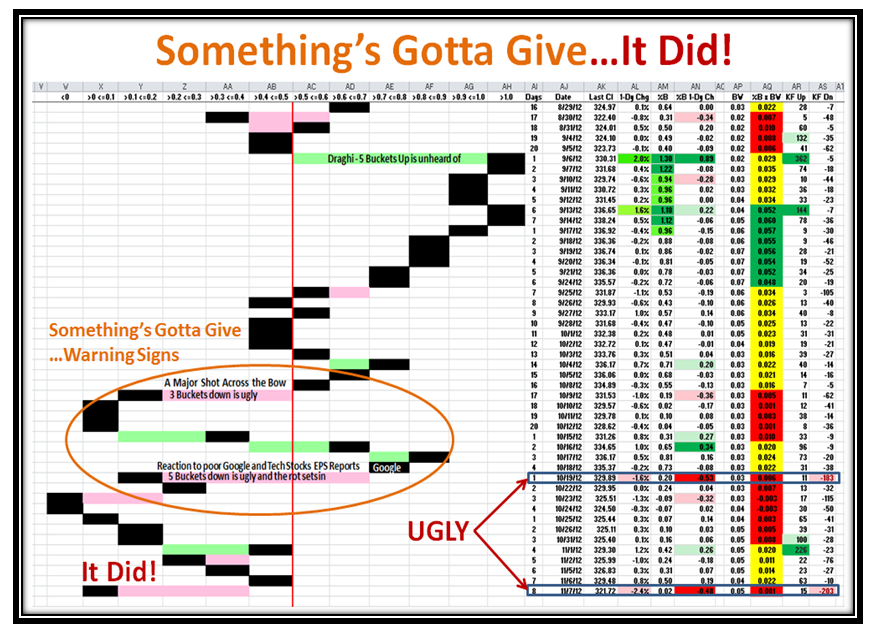
To do the same thing on a DAILY Basis so that HGSI and EdgeRater users can follow along, I have converted the picture to a Daily View below:
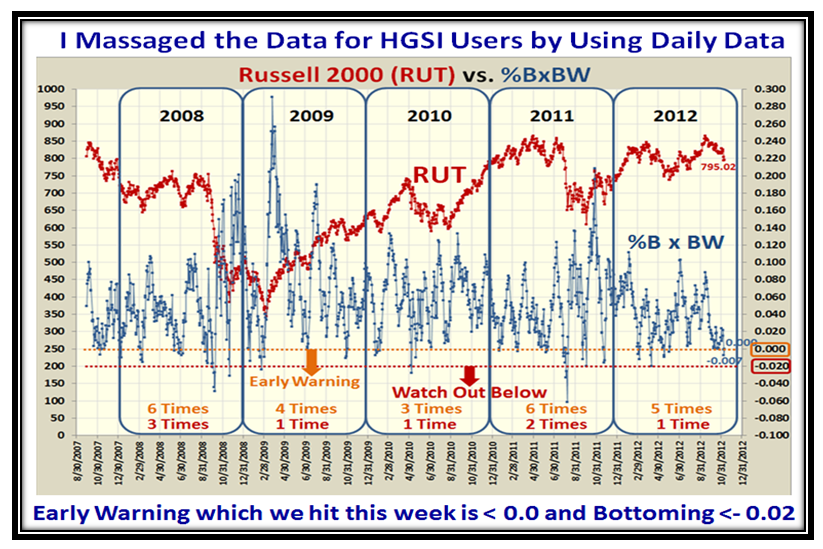
The warning sign is right there…we hit -0.007 on Thursday and moved back up to 0.000 on Friday…close enough for nail-biting time.
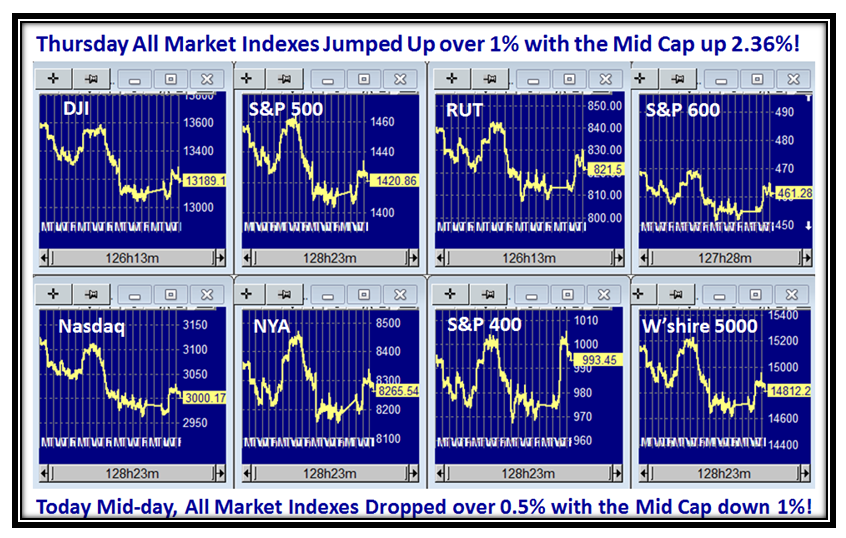
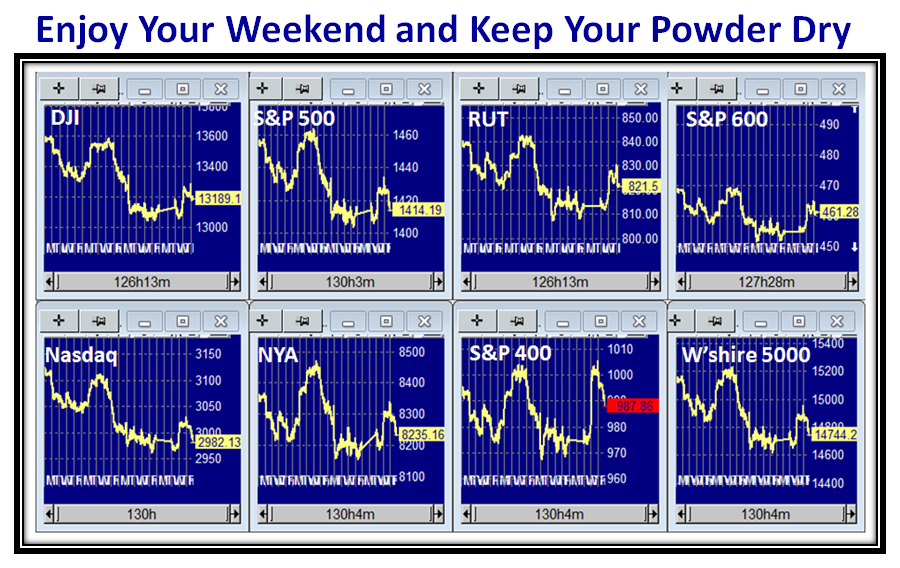
Now I know that those who do not want to waste time going through all this mumbo jumbo…yet believe it is “GOOD STUFF”, here is a simple way for you to watch the results by using the Warehouse View in HGSI and look for %B x BW to go negative to below 0.0 for starters. With this view we can see the RUT along with many of the other Major Indexes I feature from time to time:
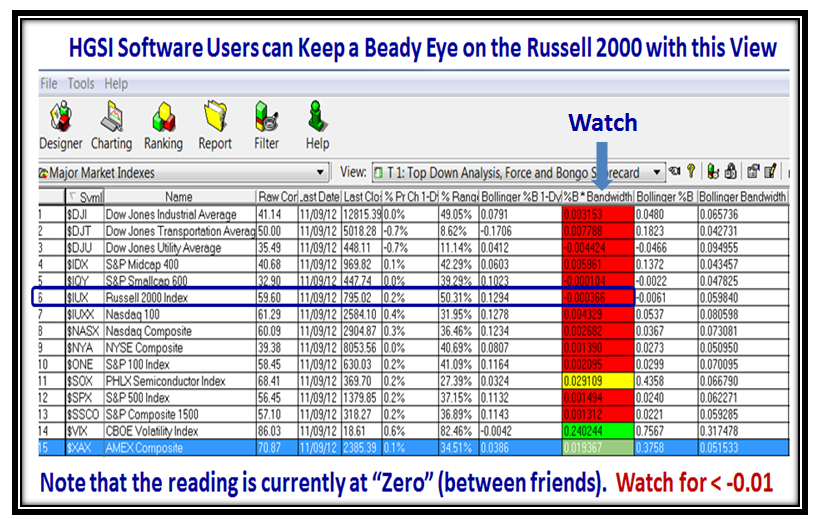
How about “Three Cheers” for Richard Branton sitting out in Sunny Thailand for the gem he has given us and which we can create in EdgeRater and then cap it off with the simple way to follow this for the earliest warning signs in HGSI as I show above.
Now I know you are clamoring for more and want “Jam on it”, so here is the last point to top all of this off. I have drawn a picture for the Composite Average of the ten Market Indexes and if they (on Average) breakdown below -0.01 Run for the Hills!
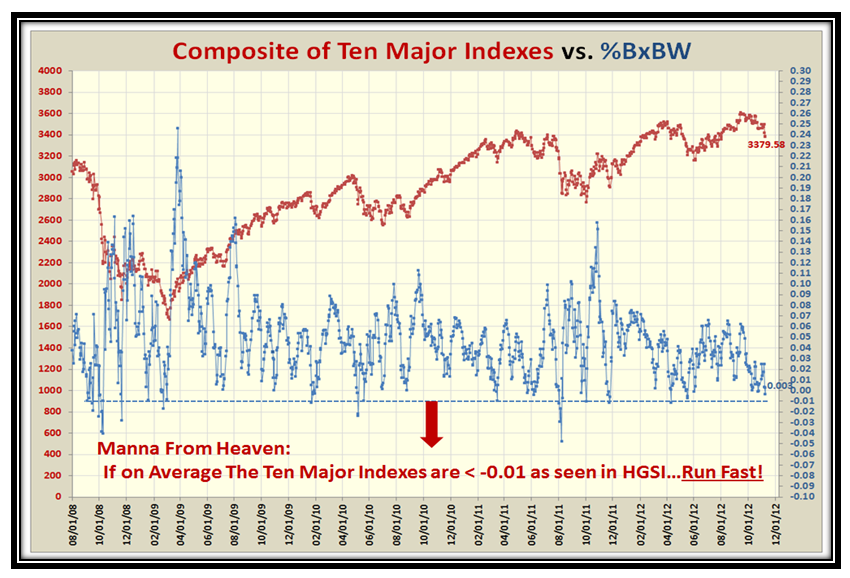
I know times are tough, but you can’t say I don’t keep you on the right side of the Market between Fear and Greed. If this Composite shoots up above 0.04 (say), we had a big boune play and the danger has passed for now! Give us some encouragement with your feedback!
Best Regards,
Ian.
 Ian Woodward's Investing Blog
