Ian Woodward's Investing Blog

Archive for the ‘HGS Principles’ Category

Stock Market: Floodgates Opening as Facebook Fizzles

Saturday, May 19th, 2012

“With all the hype around the Facebook IPO — and all the talk of excitement at the retail-investor level — who would have imagined that Facebook’s underwriters would be fighting to stabilize shares at $38 heading into the close?  But that’s exactly what happened Friday afternoon, when investors appeared keen to dump the stock before the weekend break.”

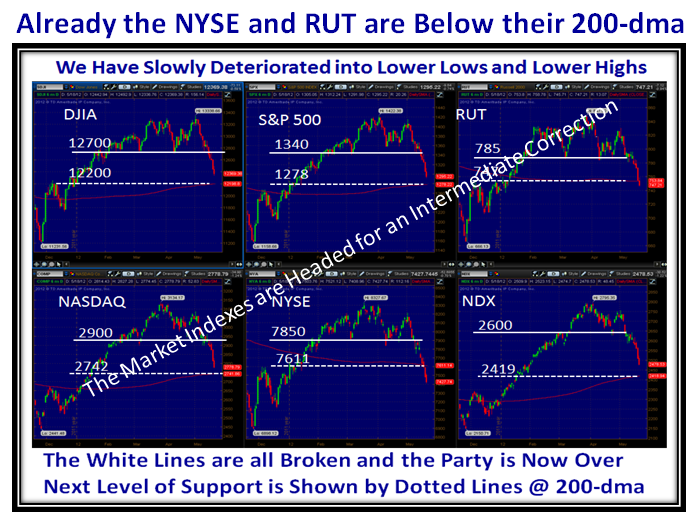
Sad to say that the cushion this Rally had developed has completely fizzled and we are now faced with looking for support at the 200-dma.  Note that the NYSE and RUT are the weakest Market Indexes and have already broken down below the 200-dma.  The Bears have the upper hand:

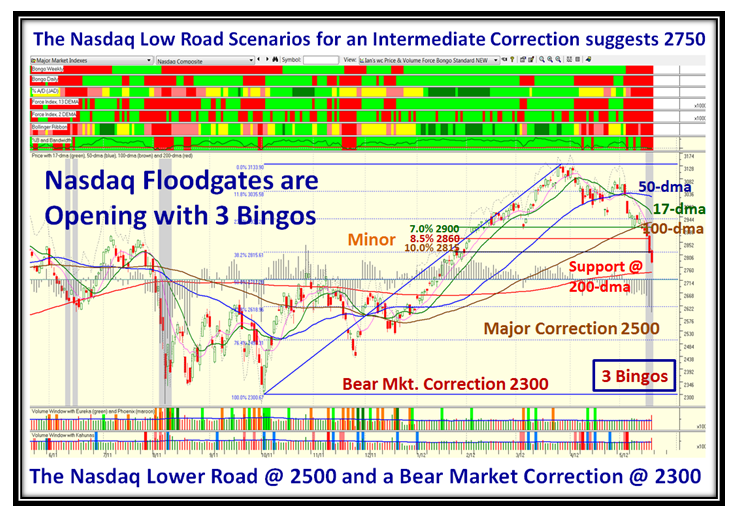
The last three days gave us three Bingos which means we are now into Oversold Territory.  That implies that we are due for a Bounce Play but as you will see it is nip and tuck as to whether we will have the Bounce now or have capitulation first and then Bounce as we review the underlying signals that we have come to trust:

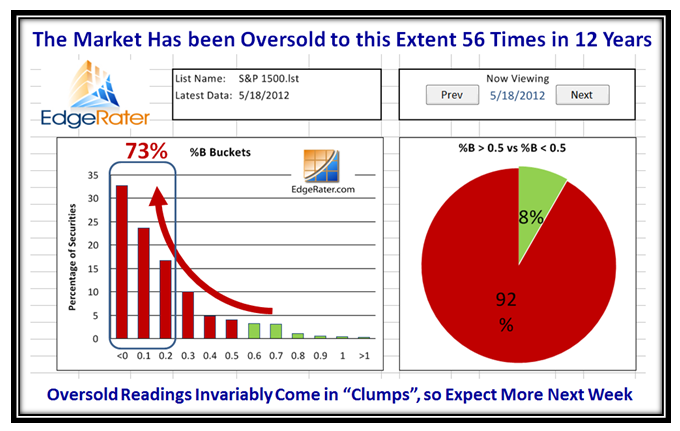
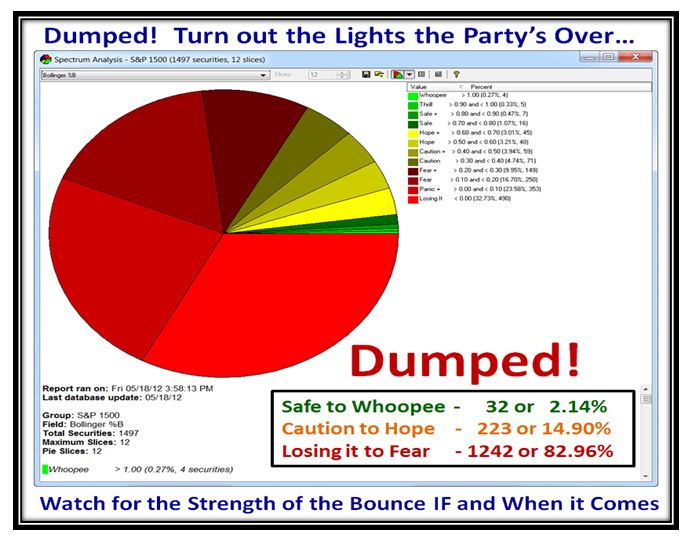
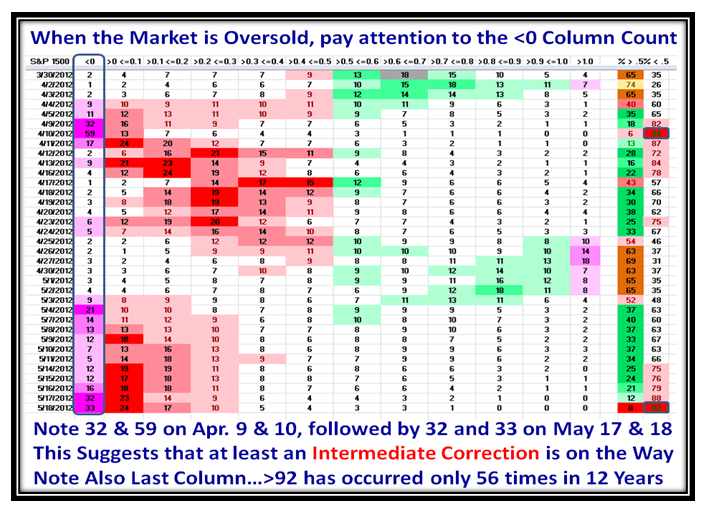
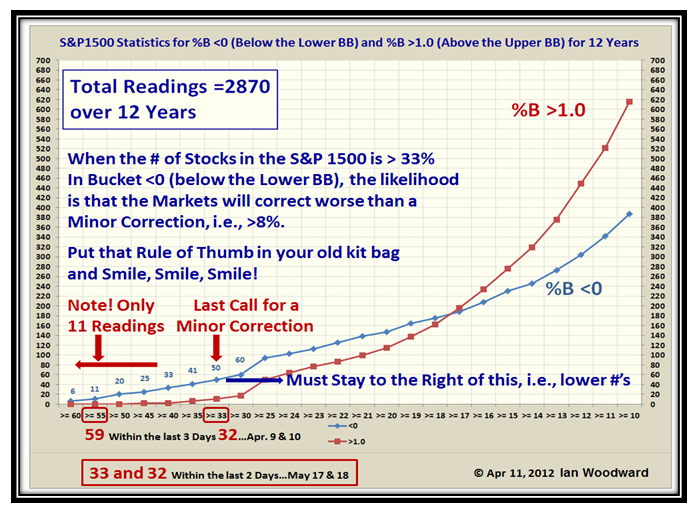
92% of the S&P 1500 Stocks are with %B <0.5 which is a rare occurrence.  We have now had two days in a row with 32% and 33% in the Bottom Bucket of %B <0, which also spells more gloom:

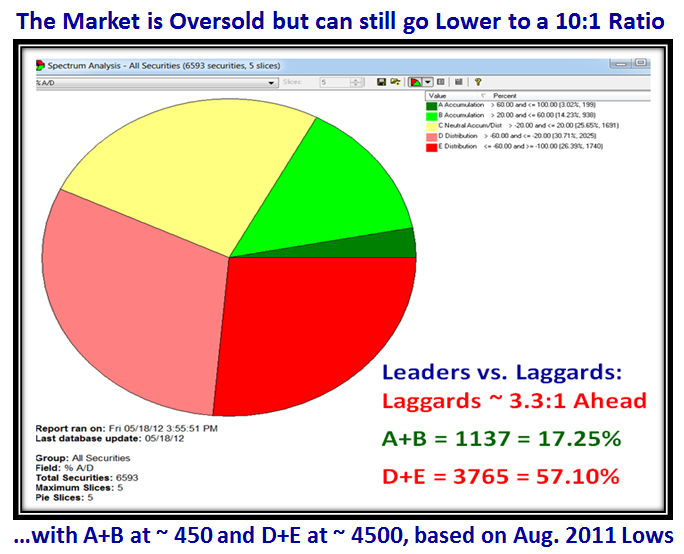
The next three charts show the extent to which the damage has been done this last week:

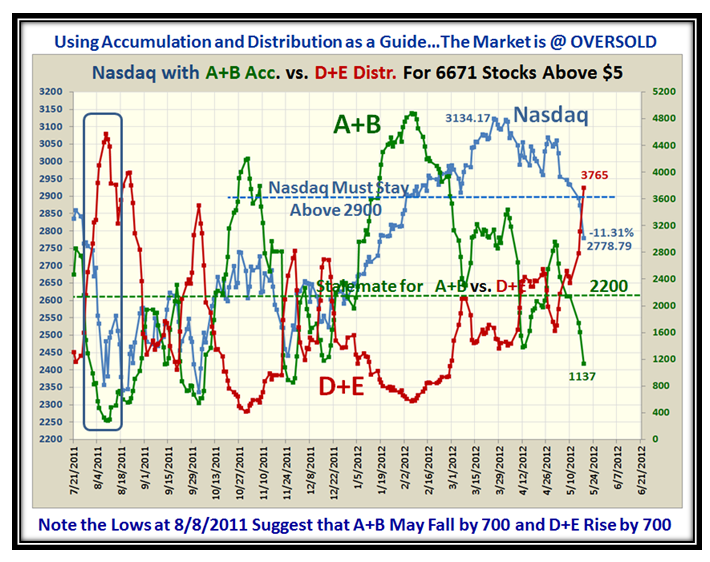
We now show a 3.3:1 ratio between Laggards and Leaders, but it can still go lower based on our experience from the Debt Crisis back in August 2011.  The next two charts show why and how much:

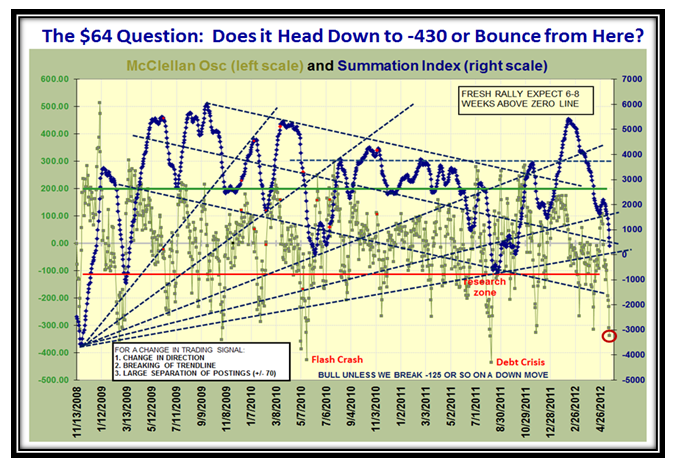
We are getting close to Capitulation and the key question is whether we already are there or still have more to go in light of all the troublesome News both here in the US and abroad in Europe.

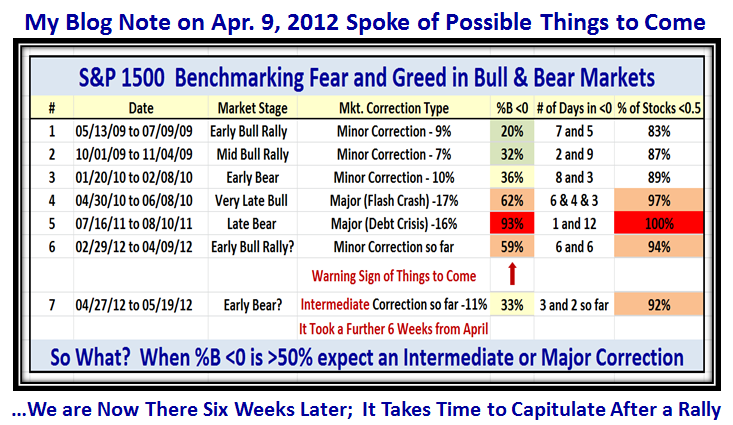
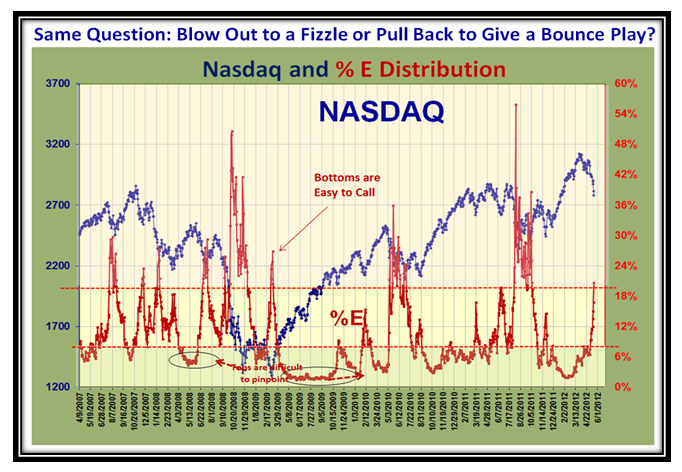
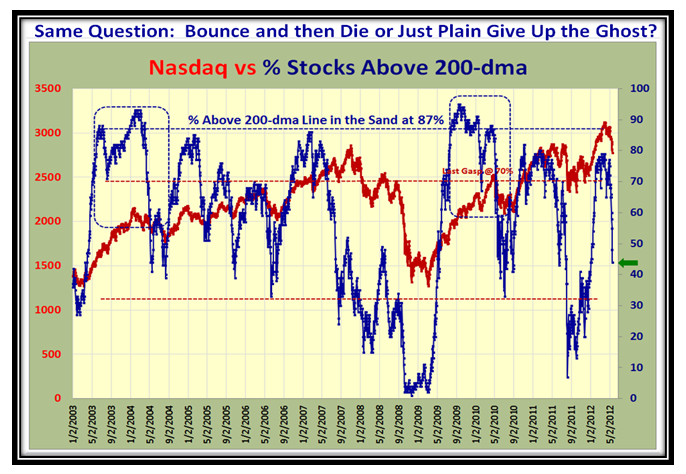
I first presented the next two charts and their implications all of six weeks ago in the April 9 Blog Note, and it is good to see confirmation of being on guard with these clues of what to look for:

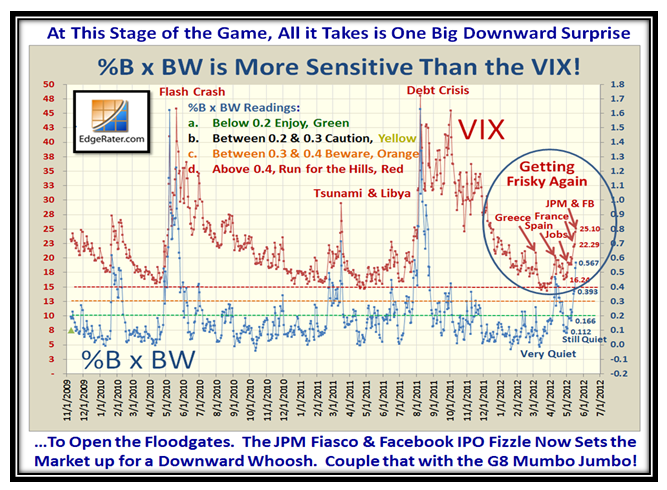
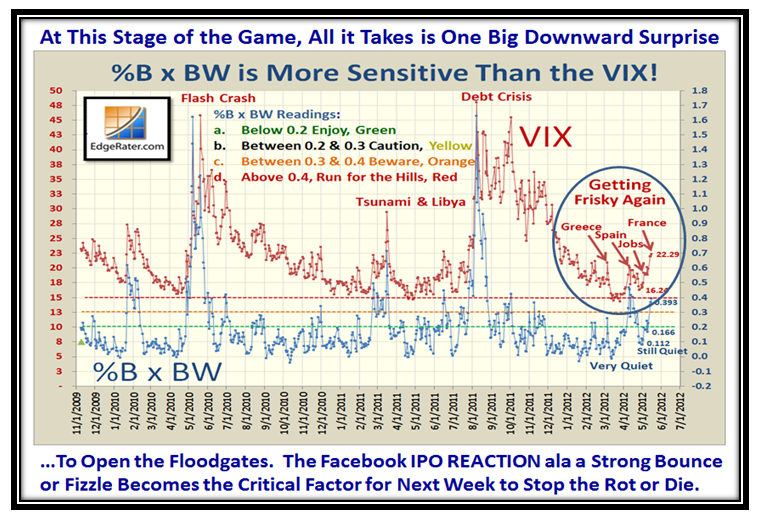
Now let’s look at our favorite charts of the VIX and Learning your ABCDE’s which confirm that we are now on the hairy edge of either Bouncing from here or going down for a “Major Capitulation”:

There you have it…Chapter and Verse to help you stay on the right side of the Market.  I’m backing  “I’ll Have Another” for the Triple Crown having just won the Derby and now the Preakness today during writing this Blog Note.

Best Regards,

Ian.

Stock Market: Last Call at “Custer’s Last Stand”?

Wednesday, May 16th, 2012

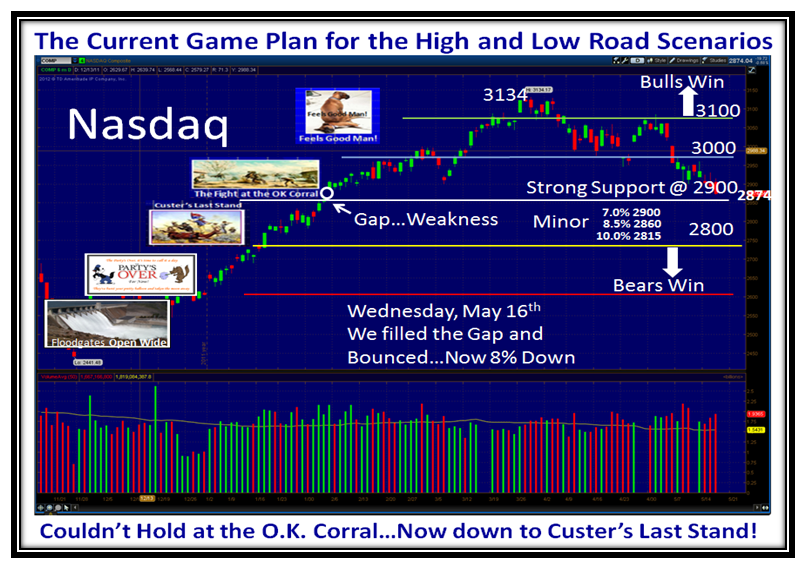
As the Stock Market has trotted down over the last ten trading days, it is now sitting essentially at Custer’s Last Stand?”  We see Lower Highs and Lower Lows which suggest more on the downside and although we are not completely oversold, the market is weighed down by the Major Problems in Europe and a Poor Jobs Report:

The two critical items the US market is focused on are the shennagins in Europe and the Facebook IPO to come:

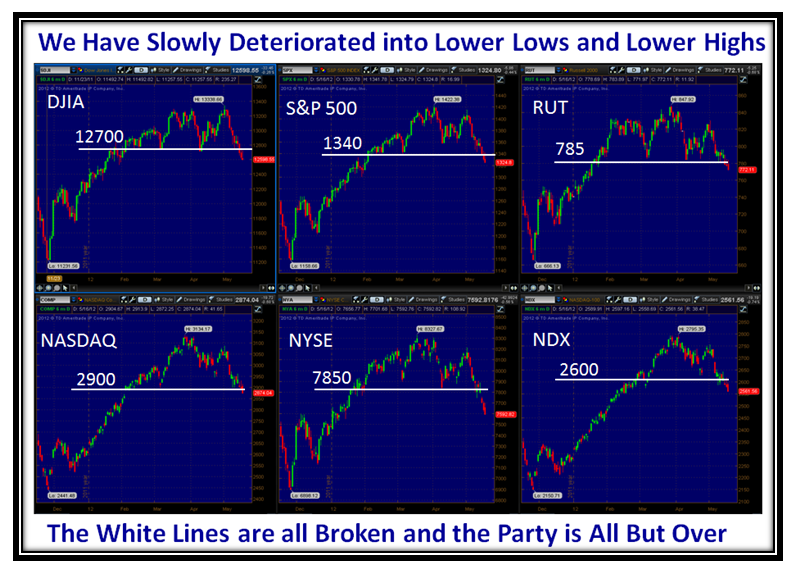
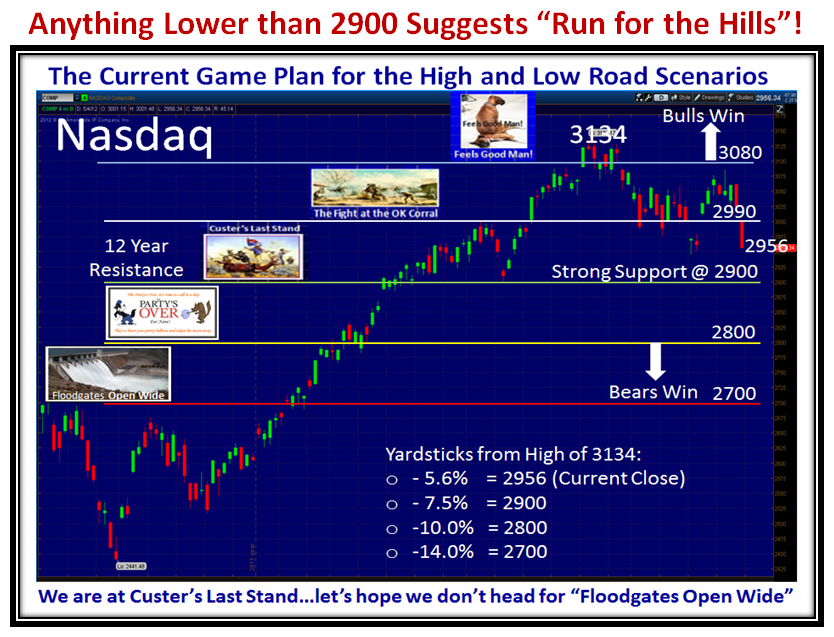
The chart of the Market Indexes shows that all key Lines in the Sand are broken today and we are now at Custer’s Last Stand:

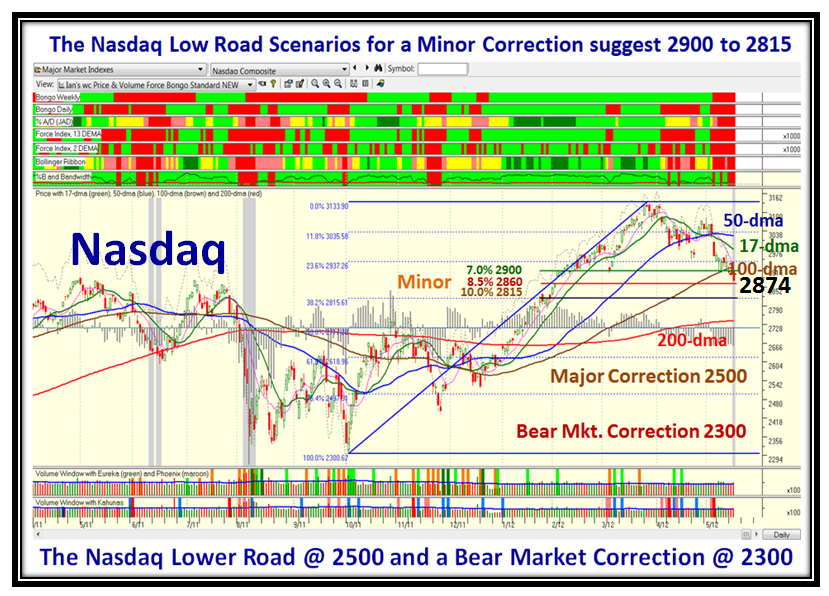
The critical 2900 on the Nasdaq has been broken and for sure we are on the Low Road Scenario at this time:

The Latest Breaking News is that we had a Bingo Signal today on the Nasdaq and that means we are either close to a bottom with an oversold signal or it is the start of heading down a lot further…just look at the previous grey bars:

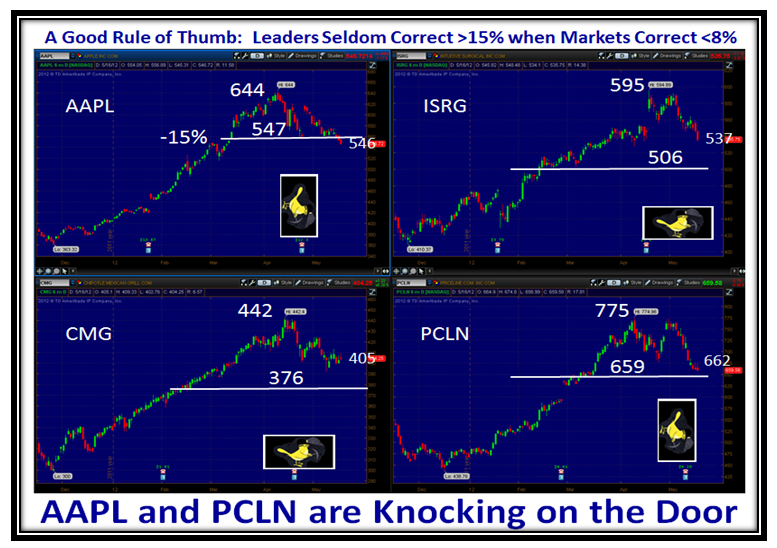
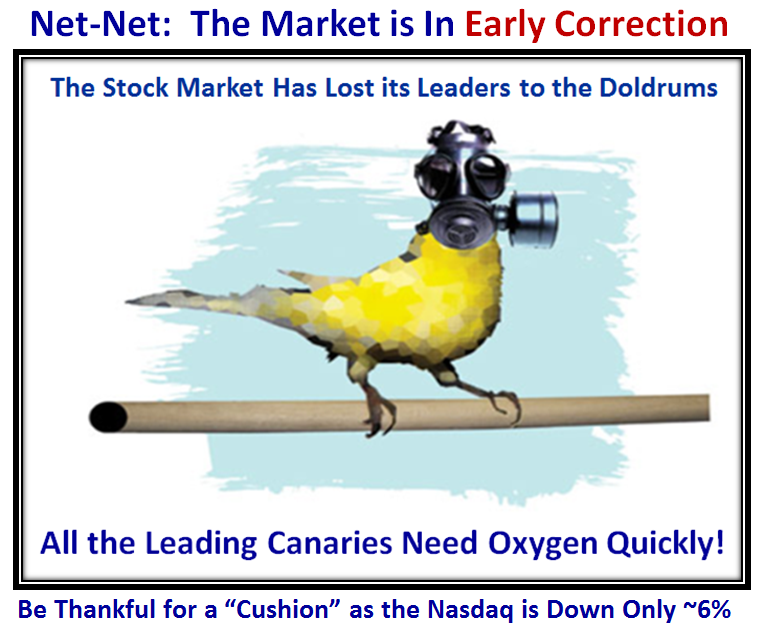
Two of the Canaries are gasping for Oxygen and they are AAPL and PCLN!

It is not surprising with all the uncertainty in Europe and the rotten Jobs Report that the VIX is stirring:

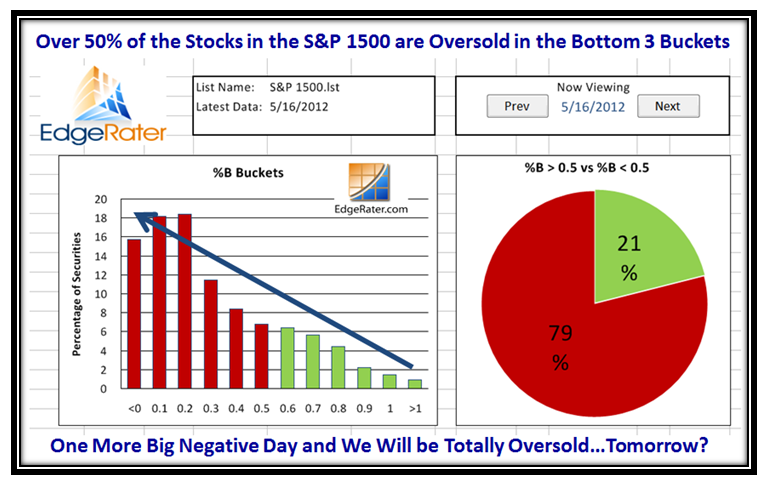
Net-net, it is no news to you that the S&P 1500 is now oversold with ~52% in the Bottom Three Buckets:

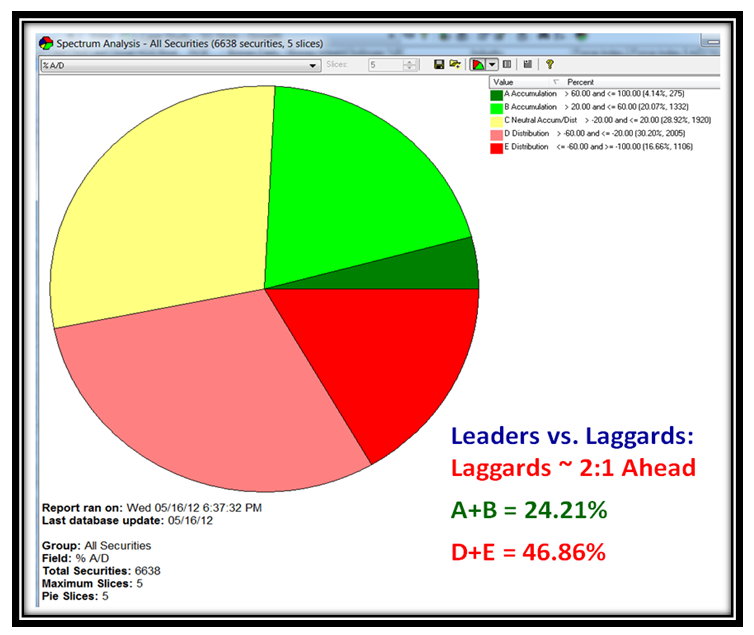
Likewise with regard to Accumulation and Distribution, Laggards are leading the Leaders by approx. 2:1.

The Bottom Line is that we are close to the Floodgates being opened and the only hope to turn this market around is to see a strong BOUNCE Rally with the Facebook IPO on Friday.  If the reception turns out to be anemic then we wait to see where the Market Indexes find support and hope that it is no worse than a 10% Correction.

Best Regards,

Ian

Stock Market: In Early Correction

Saturday, May 5th, 2012

Everything was looking promising this time last week, but the Jobs Report on Friday was very bleak.  The Bears are rubbing their hands with glee as they have been thwarted several times the past month since we had that strong warning sign on 4/9 and 4/10/2012, when the poor Jobs Report last month first gave a strong signal and the Market swooned.

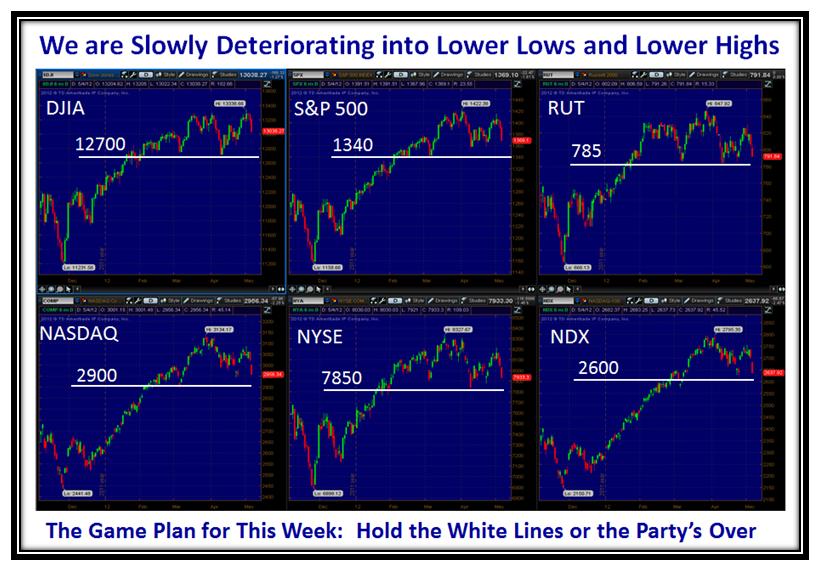
The Game Plan I have given you before shows that we have now slipped down to Custer’s Last Stand and the real test will come if the Nasdaq droops down to 2900, the 12 Year Line in the Sand between New Hope or back into the Doldrums:

2900 on the Nasdaq takes on even more significance as it is 7.5% down from the High at 3134, and as I am sure you well know by now the Nasdaq has turned back up 70% of the time at -8% down from the high.  So let’s not forget that this statistic coupled with it being the 4th Year of the Presidential Cycle where there has been only one occasion in 72 Years or 18 Presidential Cycles that we suffered a Bear Market to not panic yet.  However, you are forewarned to be on your toes, especially if all the Market Indexes and Leading Canaries give up the ghost:

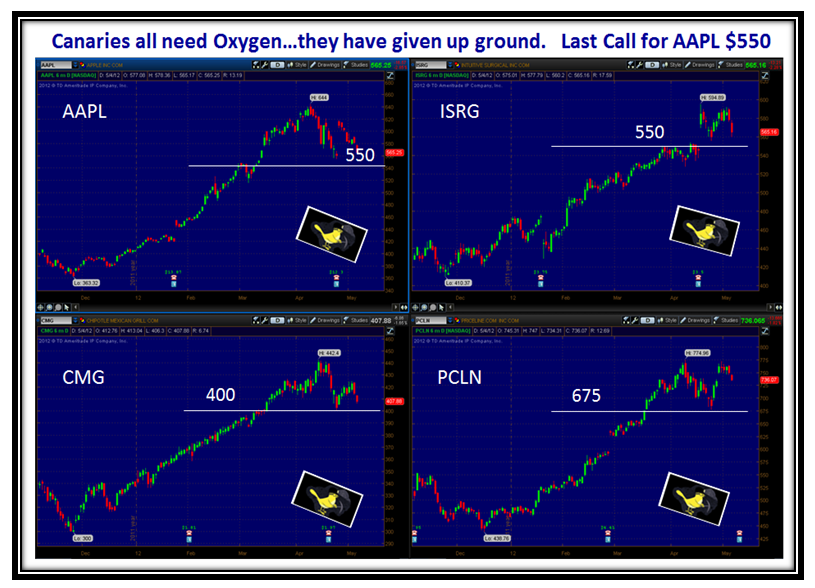
…And here is the picture of the Canaries which are tilting down:

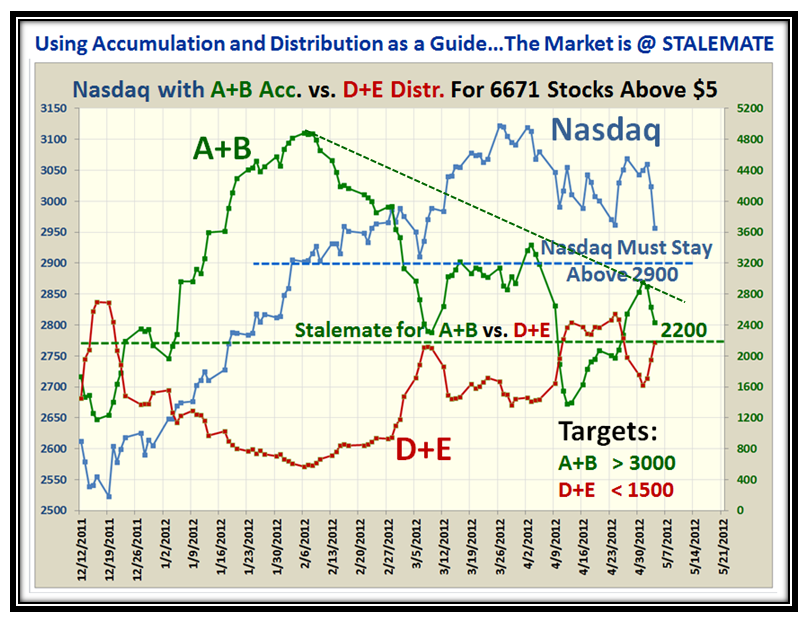
Here is a New Chart to chew on…I have combined the A+B Accumulation  and the D+E Distribution stocks for above $5 for the past five months history and you can readily see that Leadership stocks slumped this past week to the point where we are at Stalemate on this score.  We need to quickly get above the down-trend line to 3000 and higher for A+B.

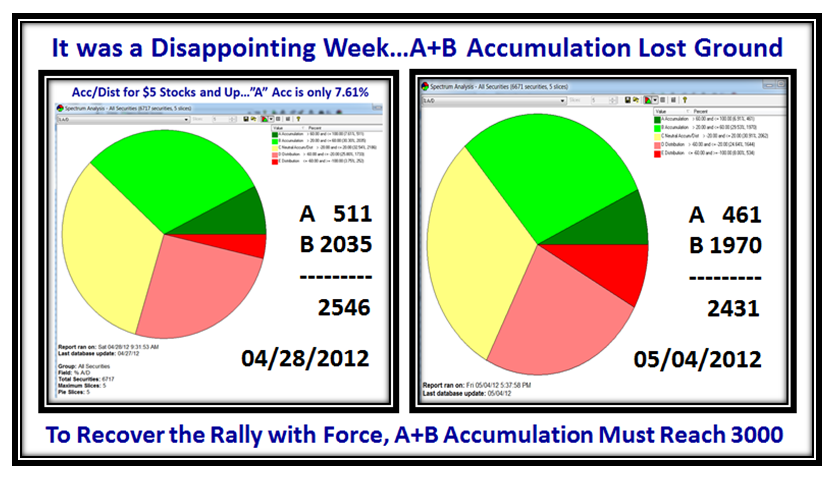
The next Pie Charts show the deterioration last week in leadership with A+B Accumulation giving up ground:

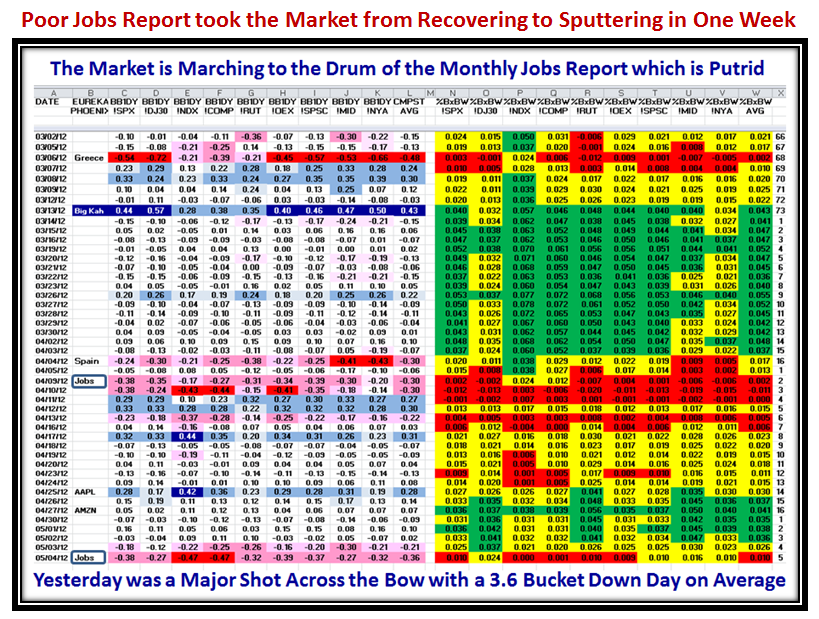
What’s new?…the Monthly Jobs Report was dismal and we finished Friday with a 3.6 Bucket down day…bad news:

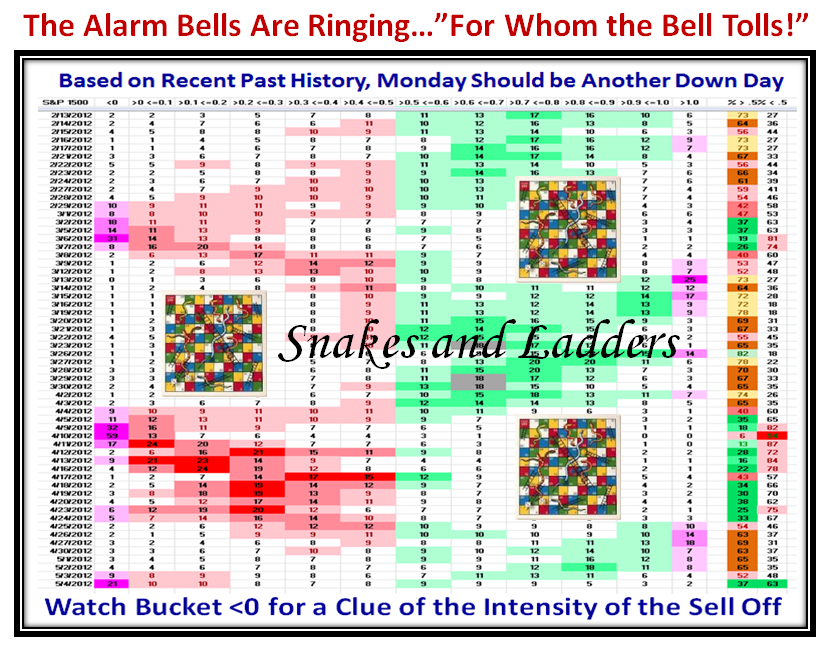
Yes, we are Playing Snakes and Ladders and we are once again in the doldrums:

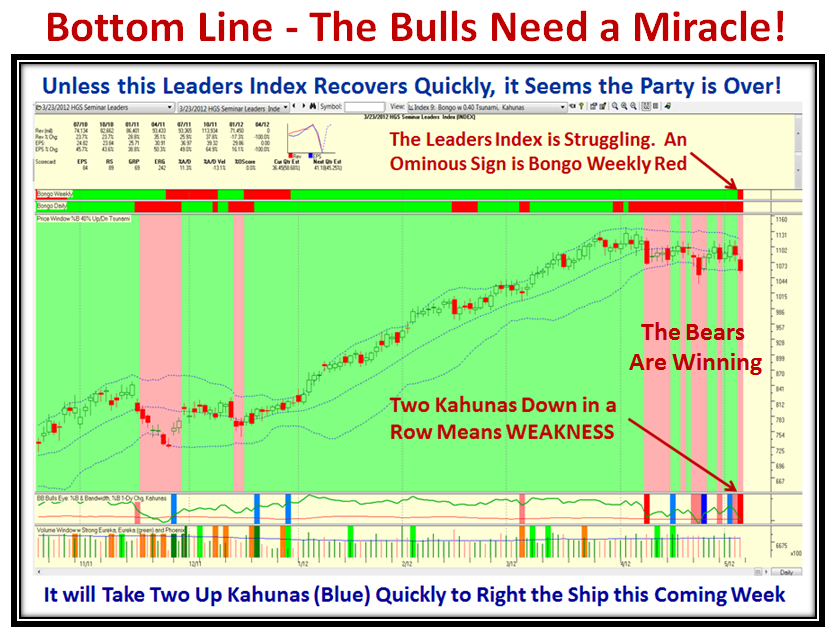
The Leaders Index looked promising a week ago, but it doesn’t take five seconds to see that this Index is Struggling:

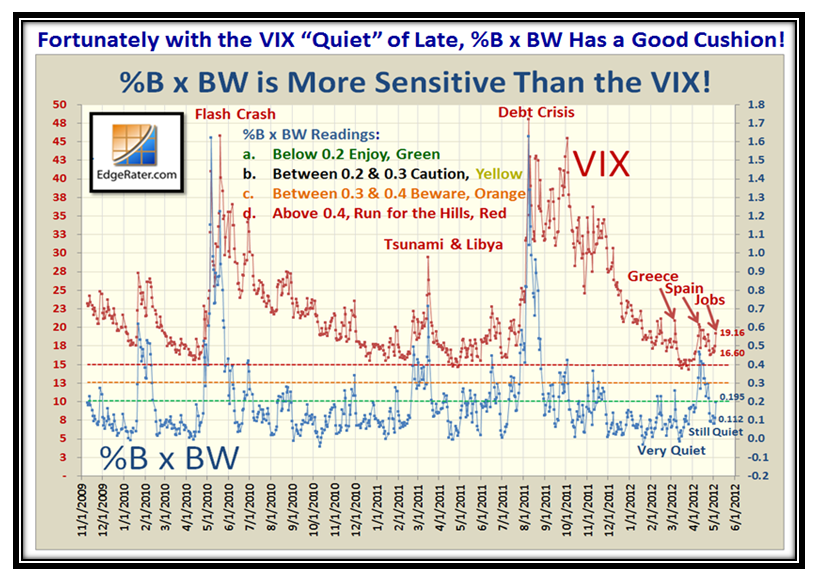
…And last but not least, the item to watch next week is the VIX as it has NOT Exploded as yet and therefore if there is a big down draft and a run for the exits, the earliest clue of Major Abnormality will come from the picture below:

Let me once again thank the Worldwide viewers of the Blog for their support…Today I had 17 hits from Thailand!
Best Regards,

Ian.

Stock Market: Bounce Play on Stellar Earnings

Sunday, April 29th, 2012

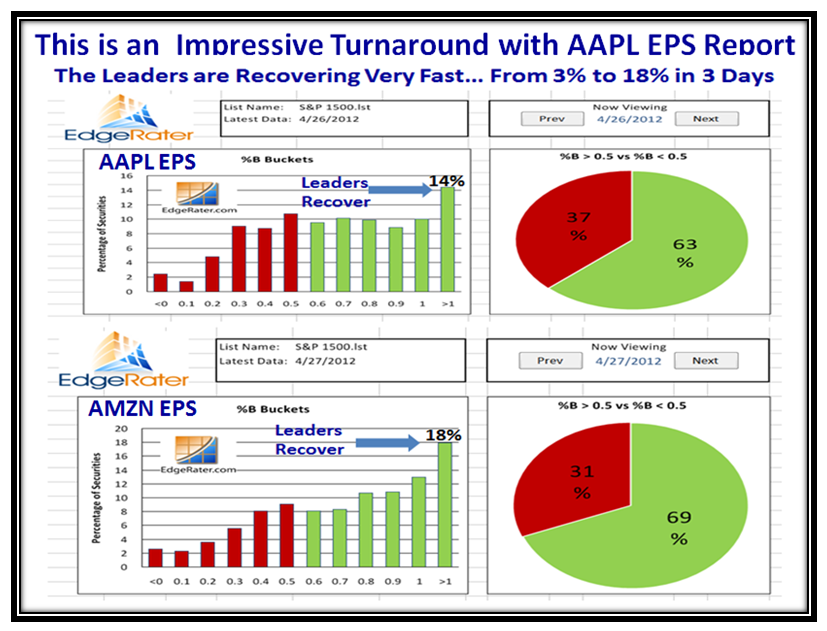
The Stock Market bounced back with excellent Earnings reports from AAPL and AMZN to mention two and now we are in a quandry as to whether this is the start of something big or we fall back into the doldrums and head down once more:

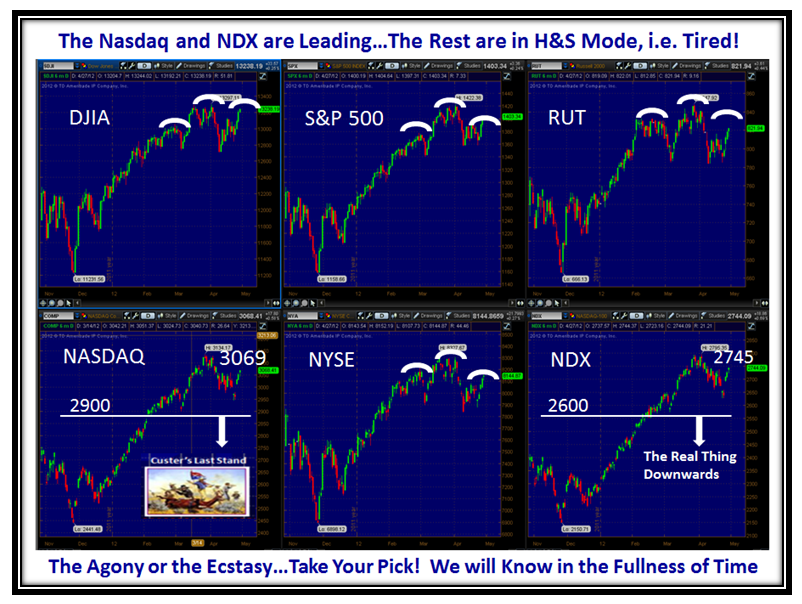
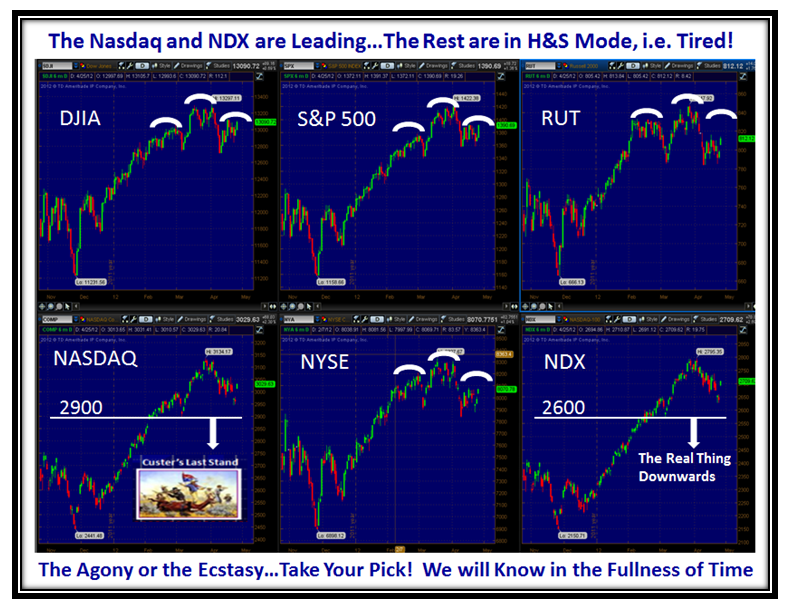
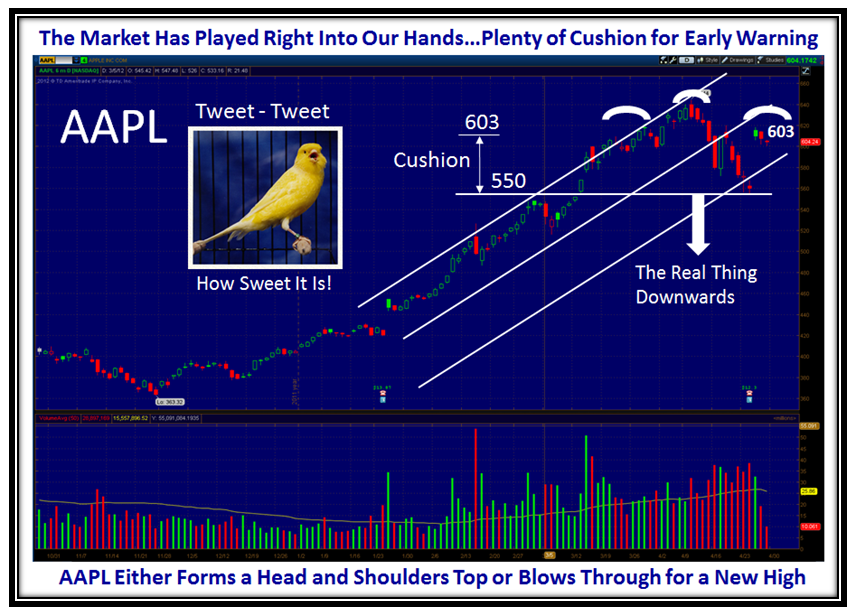
Although the Market Indexes are a stone’s throw from their recent highs, we also see ominous signs of Head and Shoulders Tops, so we shall see if the bounce of the last three days will continue or fizzle out:

The extent of the Focus on AAPL is unprecedented, so it is a natural “Go To” for the Market direction:

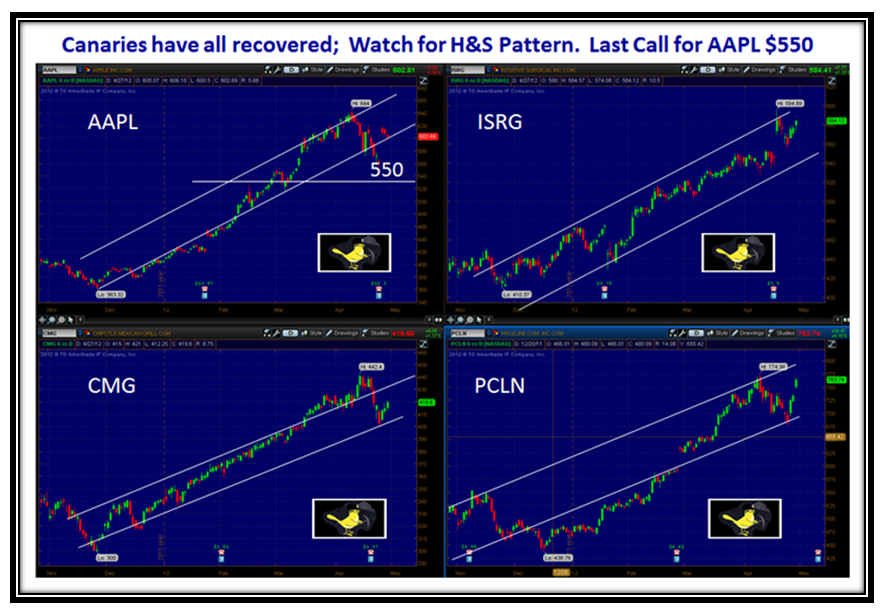
The Canaries are all chirping again, so we have another yardstick by which to judge the Market direction:

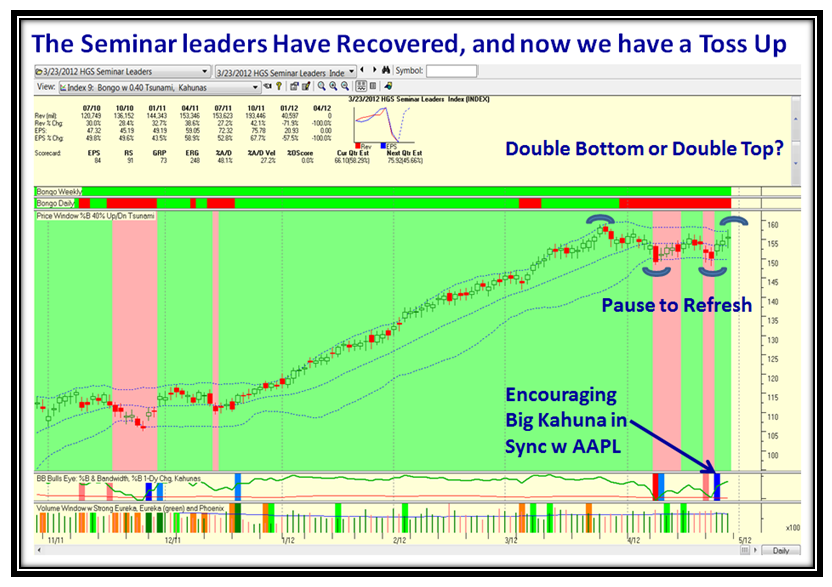
The Seminar Leaders are back in business and again we are faced with a Double Bottom or a Double Top:

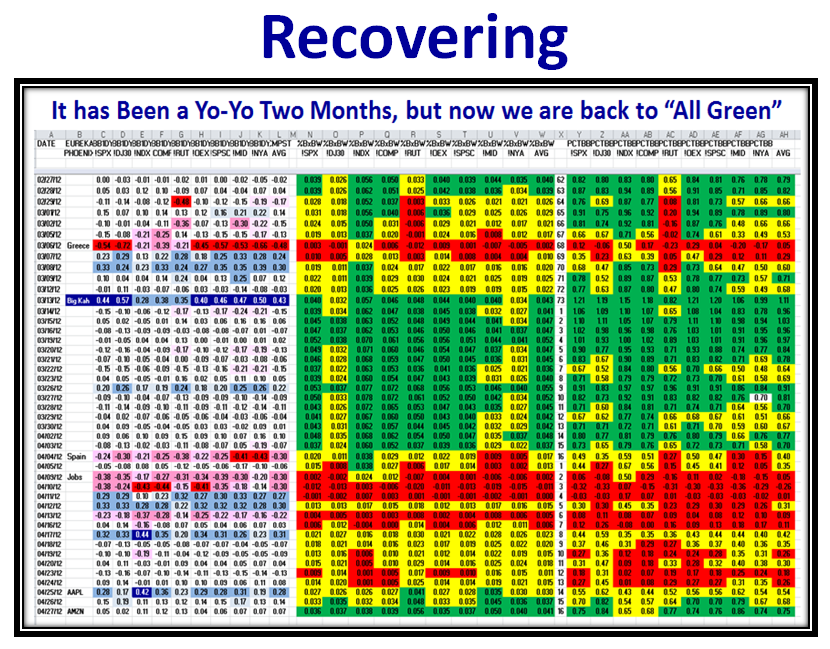
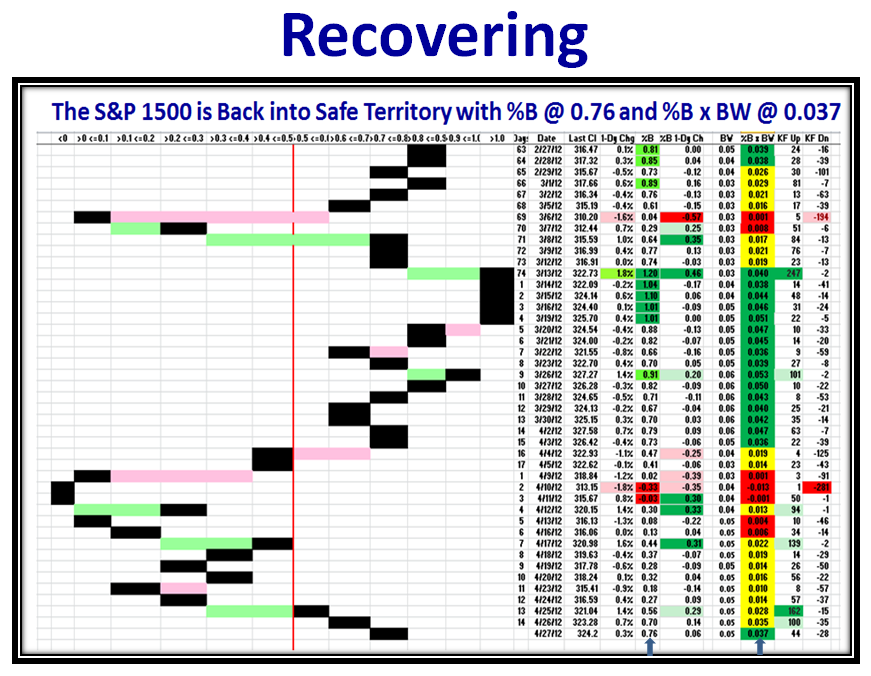
Let’s look at other signs of Recovery… Back to green on the Indexes:

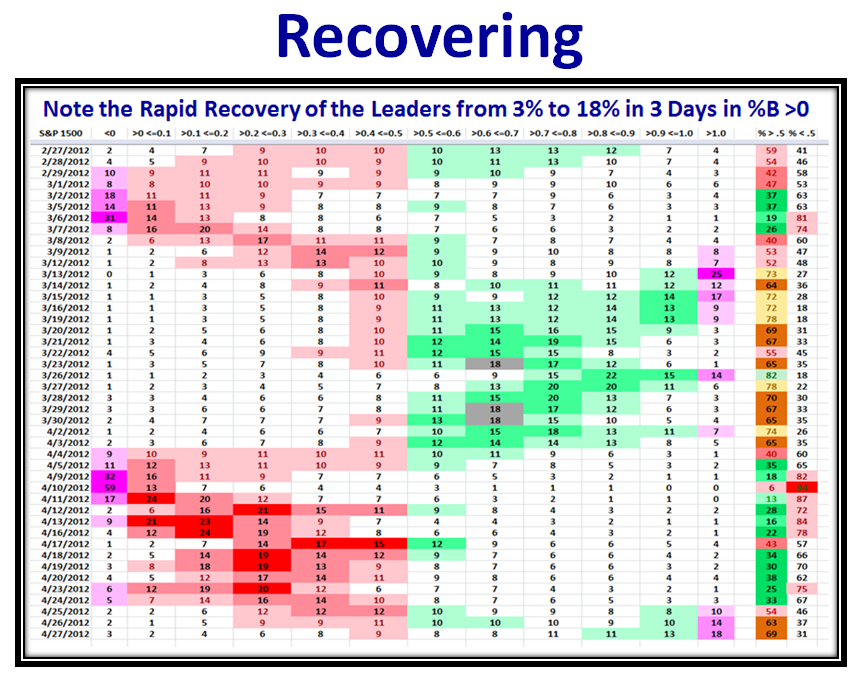
…And more of the same, Recovering:

…And one more to confirm that we can stiffen our backbones:

Look at the big move from 3% to 18% in %B >0 in three days as a result of the pull from AAPL & AMZN:

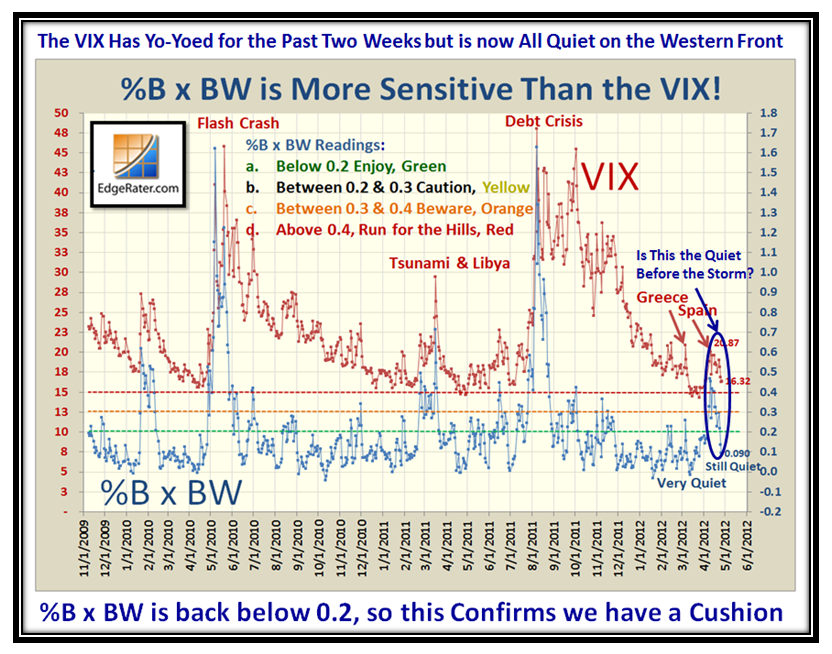
Likewise, after a couple of shots across the bow from the VIX, it is back down to “Quiet” Territory:

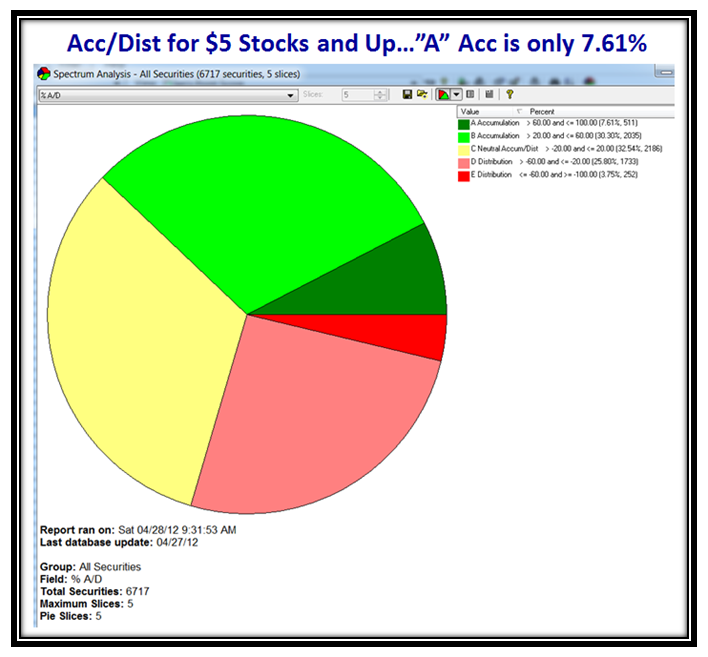
So much for the good news resulting from the positive moves in the last three days.  The $64 question is “How do we establish the INTENSITY of the Positive or Negative Move this coming week to decide whether this is the Real Thing Upwards or another ‘Fakey’, and we head down?”  At this stage of events the best clue will come from the Movement in Accumulation or Distribution of the stocks in the Database above $5.  Let’s first see where we stand as of Friday:

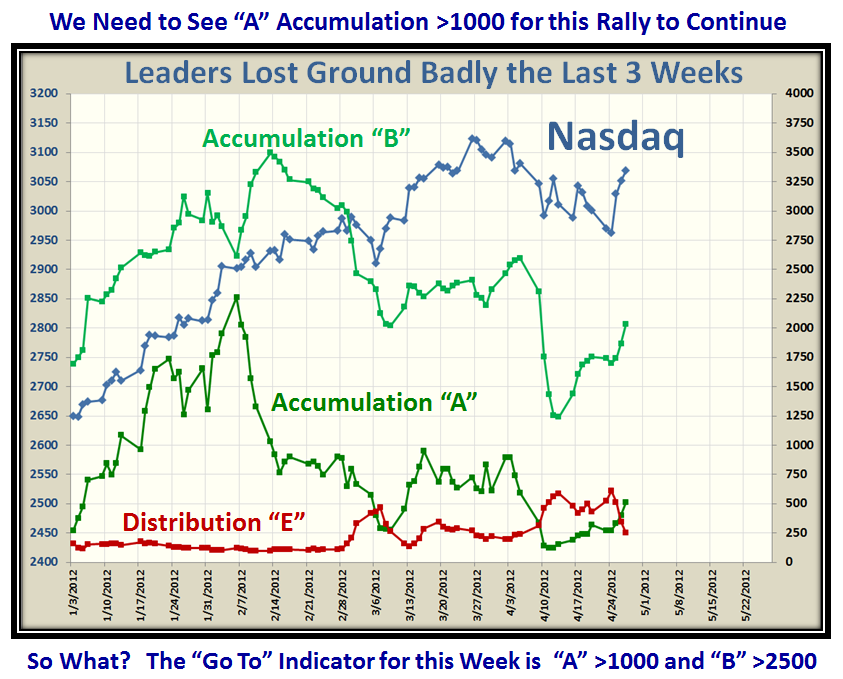
If we look at the recent History of segments “A”, “B” and “E” we can quickly arrive at targets for next week:

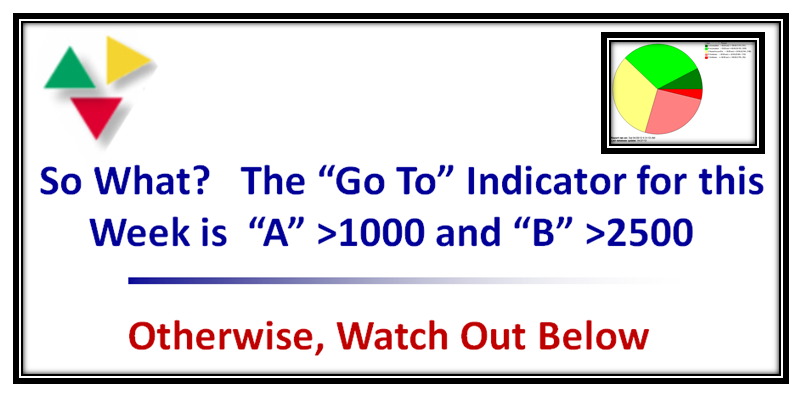
Let me repeat that so that it is emblazoned in your memory.  At times like these focus on one thing that will help you the most to understand which way the wind is blowing and with what Intensity.  It won’t change overnight but it better be strong to the upside this week or the market will fizzle again:

Best Regards,

Ian

Stock Market: AAPL Just What the Doctor Ordered!

Wednesday, April 25th, 2012

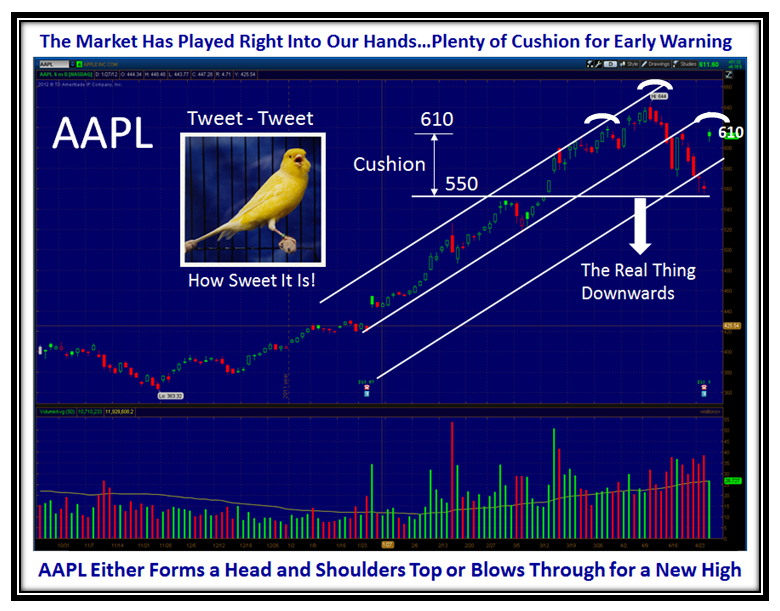
Now we know that the Stock Market is driven by the focus on just one stock.  We have had this situation before but not to this extent…think of IBM, MSFT, INTC, AMGN, YHOO, AAPL, GOOG, AMZN  in their Hey-Day and now AAPL again…but never to this extent.

Now we know for sure “As AAPL goes, so goes the Market.”  A whopping 2.3% rise in the Nasdaq, 2.69% in the NDX, and 8.87% in itself, together with a Big Kahuna, a humongous 5+ Buckets up in one day, and a Gap Up that took it from below the 50-dma to above the 17-dma.

But now comes the real test…Can it avoid a Head and Shoulders Top and pull the Major Market Indexes up by the bootstraps as they are showing the  same formation?

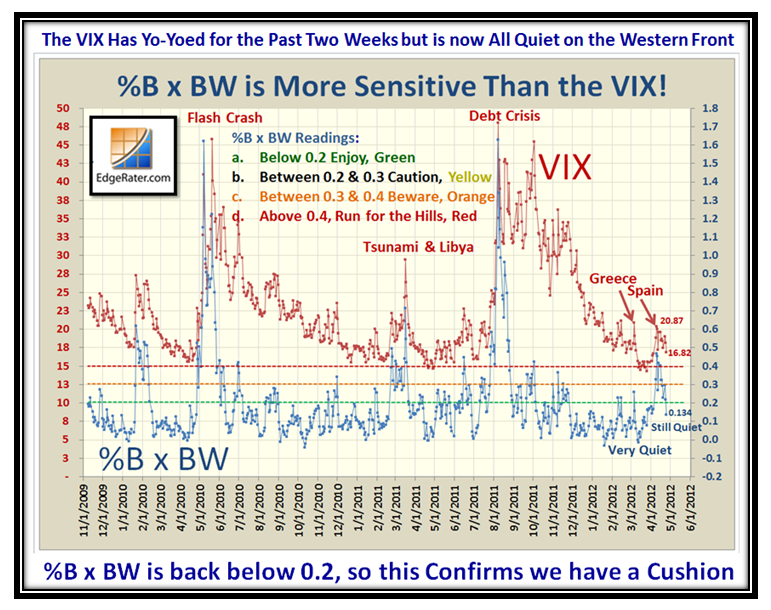
At least we have a “Cushion” all around, and especially with the VIX which after a turbulent two weeks has calmed down to the Quiet Zone again:

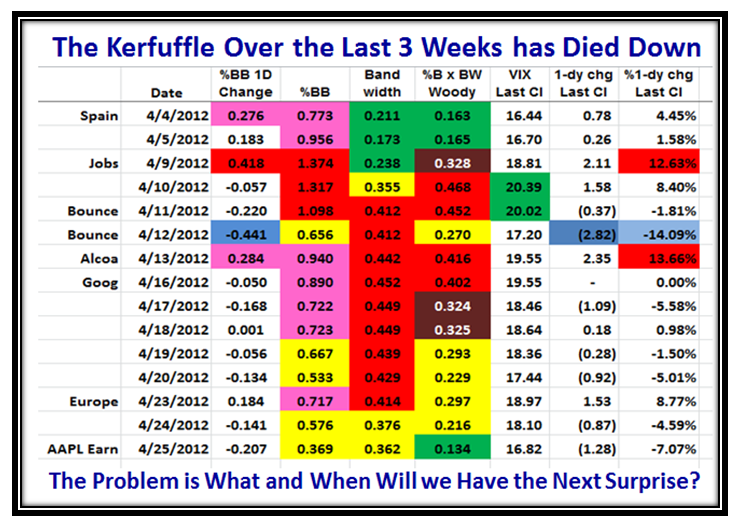
…And here is another view showing the kerfuffle over the last three weeks, but the %B x BW (Woody Indicator) is back to green territory confirming that we have a cushion:

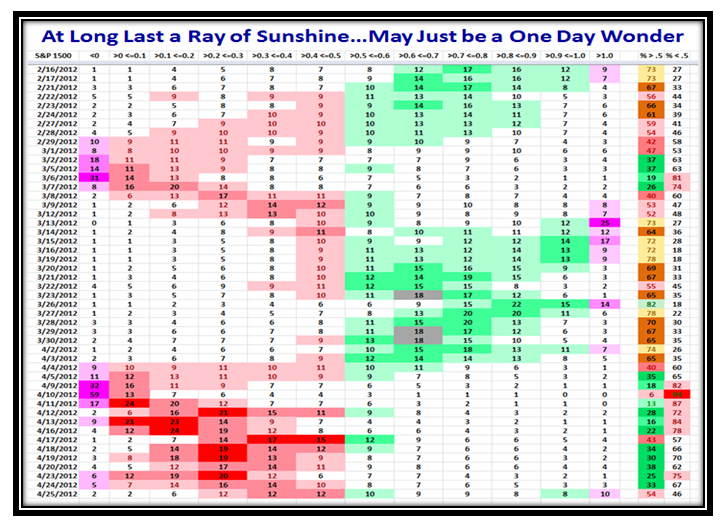
This next chart is again encouraging with the numbers improving to the right with a dash of green.  Of course there has to be a follow through with similar strength for this not to be a one day wonder.

Let’s see what the next couple of days bring, but the Bulls can be thankful for small mercies!

Best Regards,

Ian

Copyright © 2007-2010 Ian Woodward
Disclaimer: Commentaries on this Blog are not to be construed as recommendations to buy or sell the market and/or specific securites. The consumer of the information is responsible for their own investment decisions.