It has been a while since I posted a Blog Note, but I am sure you understand that I was busy with the HGS Investor Seminar last weekend. Fortunately the Market has stayed up and dwardled around since my last note and we are now at the stage of either a well deserved “Pause to Refresh” or a Market Top with hopefully no more than a small correction.

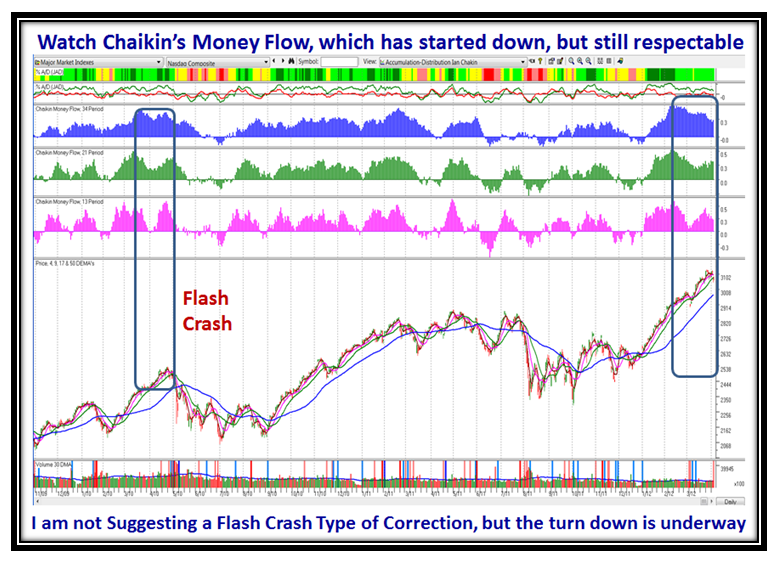
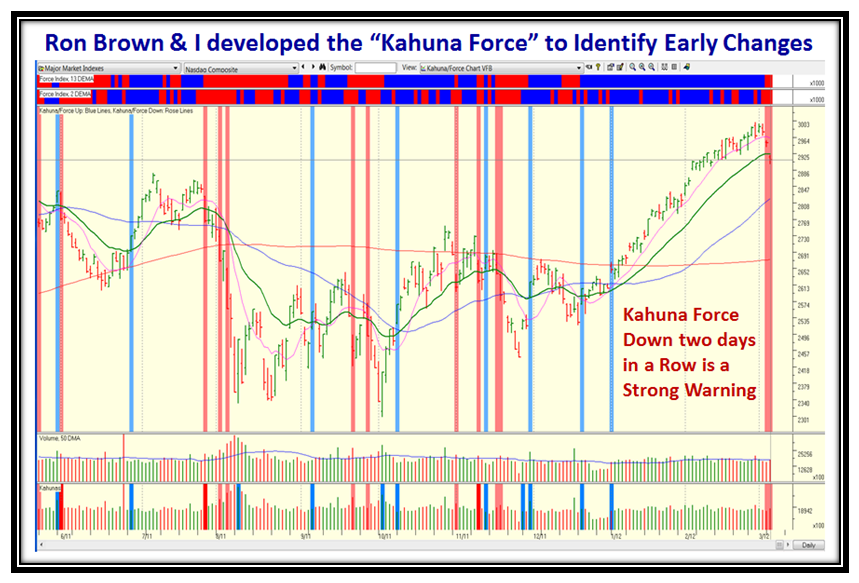
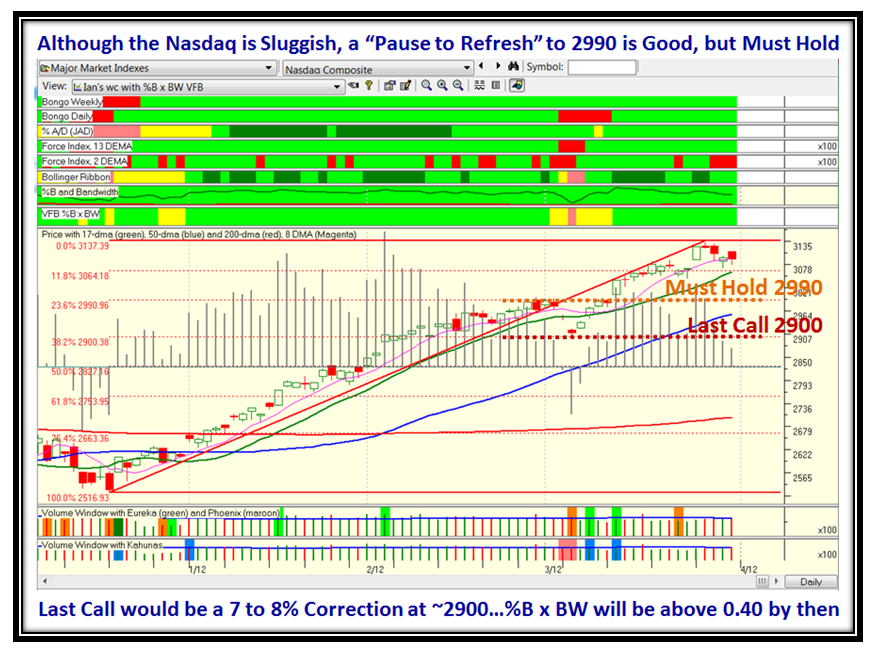
As we look at the next chart we quickly see that although the general trend is up the Market Indexes have been see-sawing for the past ten days compared to the previous ten, and this breather may be just what the doctor ordered before the Rally continues. It is now all of four months in a tight upward move, which has at long last brought some respite for the 401-K Nest Eggs you all have:

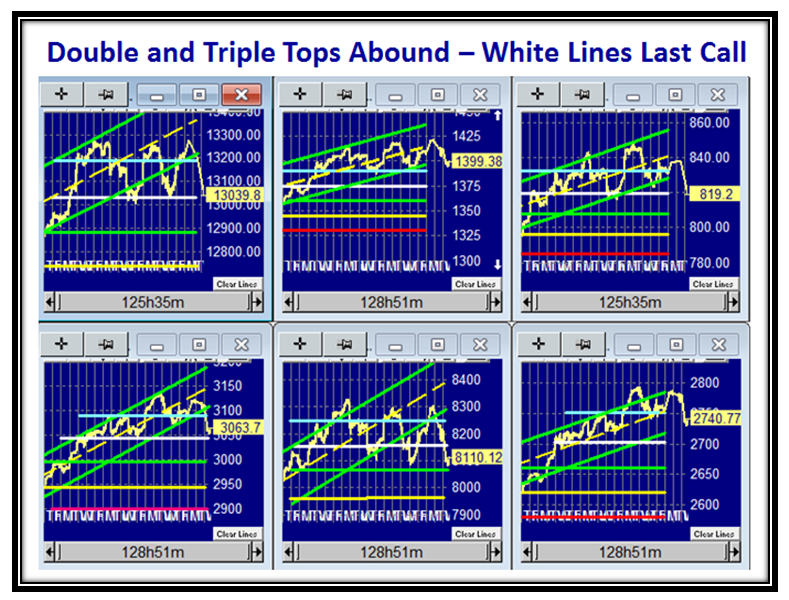
The $64 question is whether the Market will continue to Pause to Refresh with a slight correction or continue up further. As long as the Nasdaq stays above the 17-dma (green line) the Market is intact. If the 9-dma (pink line) crosses down through the 17-dma, that is an early warning sign that we are headed down and is your “Get out of Jail Free” card. By then the Nasdaq Index itself should be down to around the 23.6% Fibonacci Line at 2990 and must hold there. Last Call would be at the 38.2% line or around 2900 which is also 7% to 8% down from the high and as Seminar attendees learnt is where 70% of all pullbacks hold for the Nasdaq. These are Rules of Thumb that have served us well over the past twenty years, so the Game Plan is very simple given that the Volatility Index VIX has been so quiet!
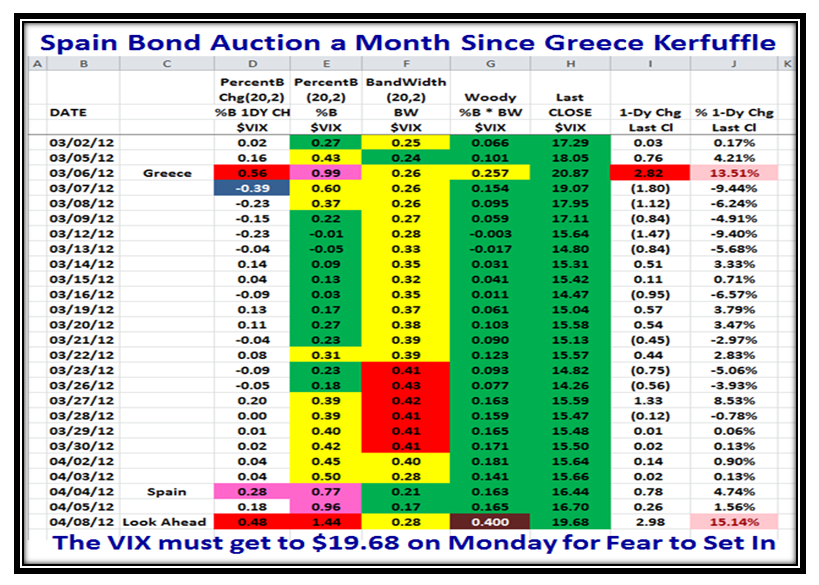
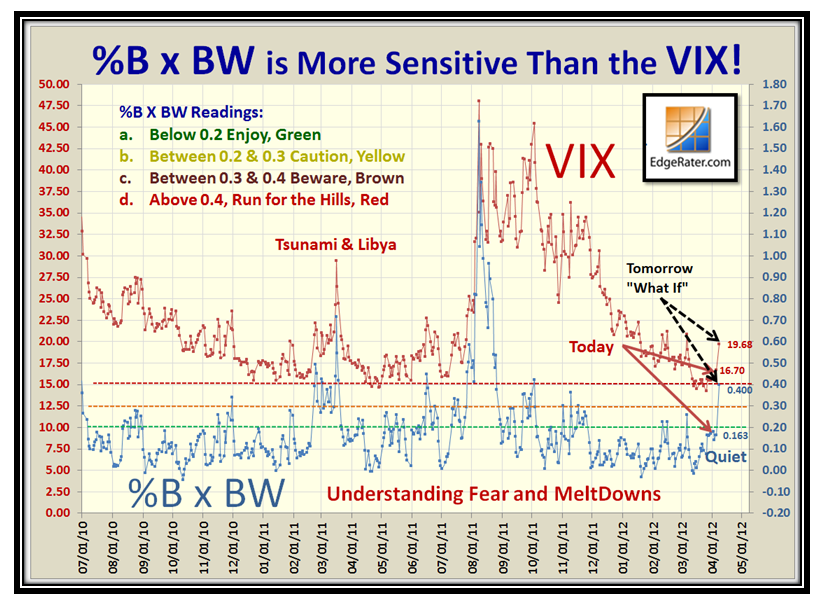
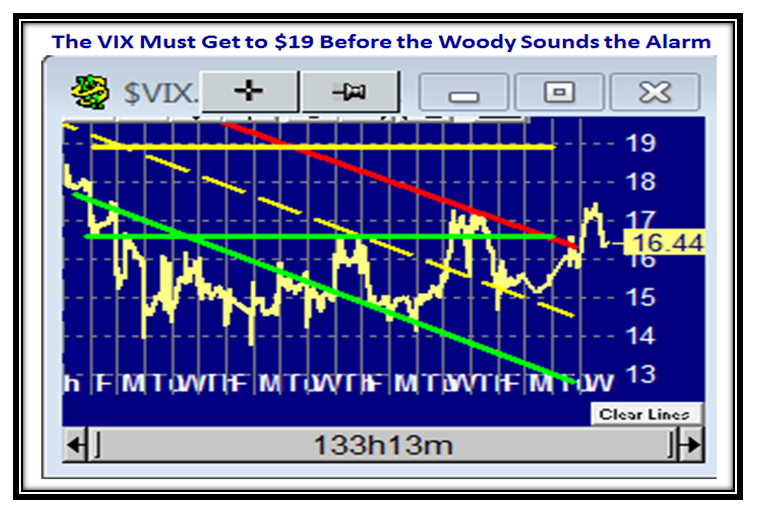
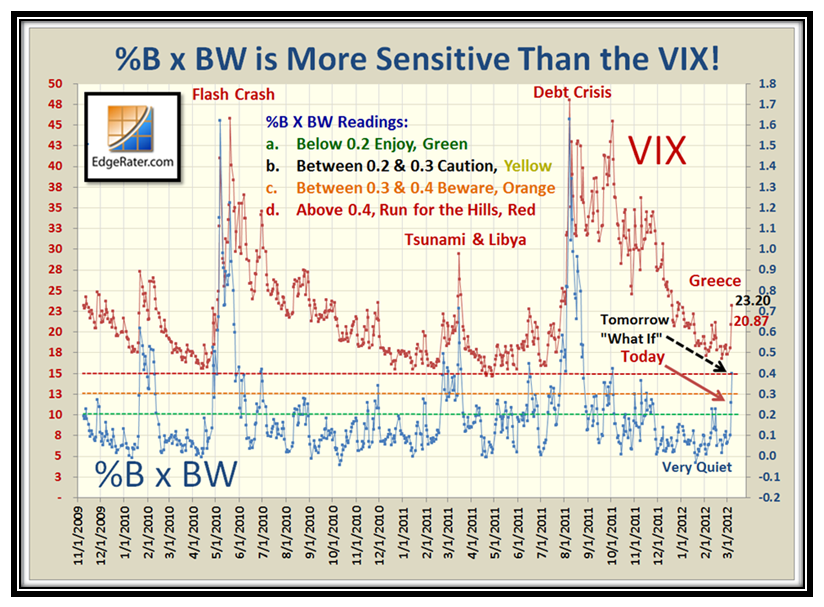
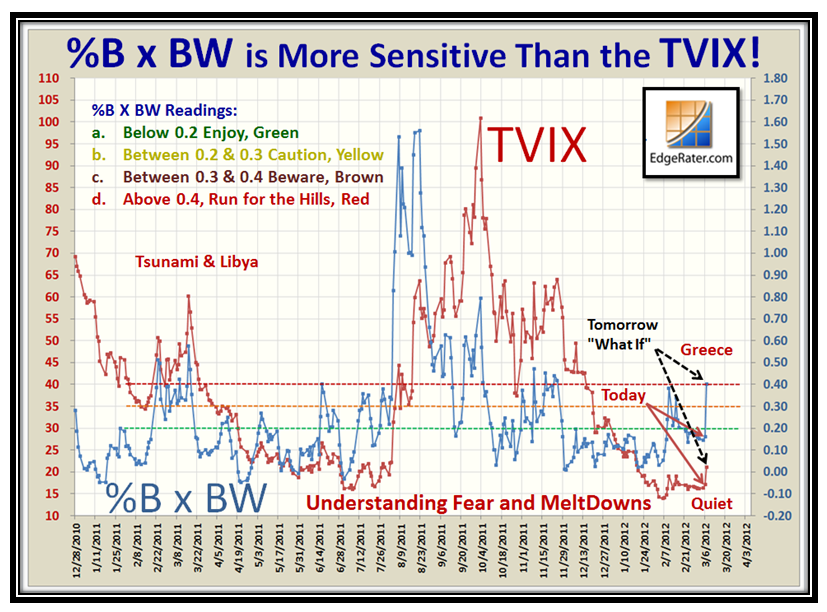
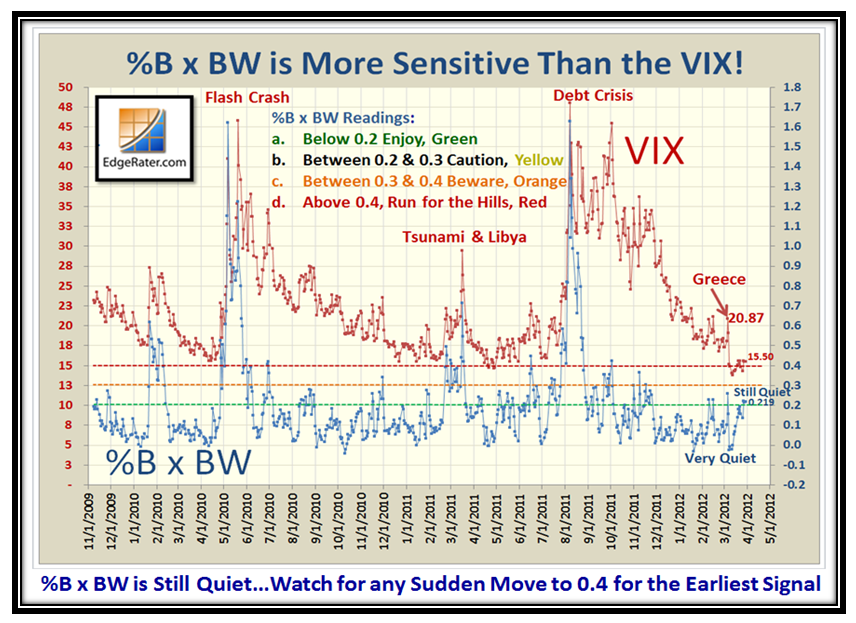
As we learned at the Seminar, Earnings Report season does not really get underway until the last two weeks of April and the first week of May. Those who are Bullish will recall a favorite Yorkshire saying “Ne’er Cast a Clout Till May Be Out”, which means don’t get rid of your woolens, or in this case your stocks until May is finished. That goes in concert with the Long Tails Mustache Scenario I mentioned some time ago, where an extended Market to the upside can get more extended ala March 2003 and 2009, respectively. If there are no Global surprises, that is the High Road Scenario. However, the go to indicator will be %B x BW, and a reading that shoots up through 0.4 coupled with a strong push upwards in the VIX which has been unusually dormant will be our first clue that all is not well and we are headed for a correction, small or large:
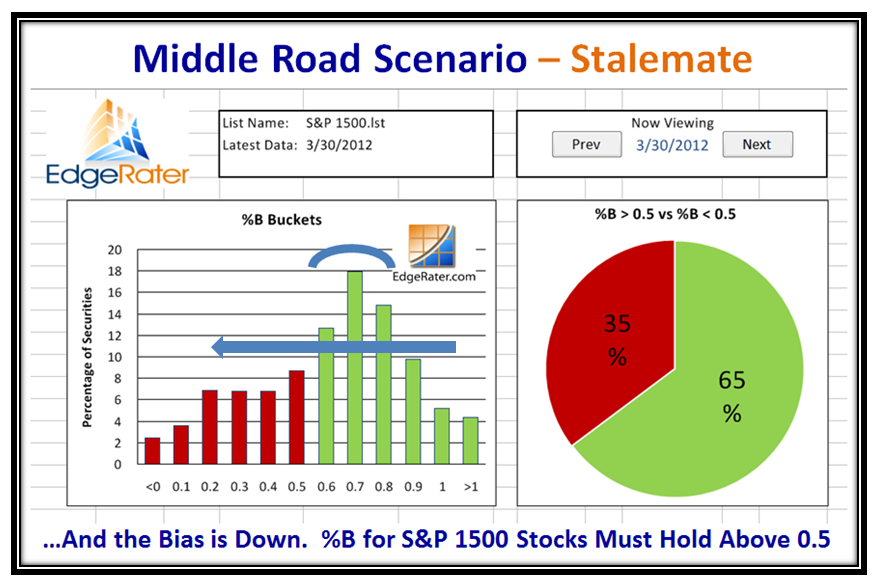
Using the Three Road Scenario, you know full well that we are in Stalemate…the Middle Road Scenario waiting for a signal one way or another:

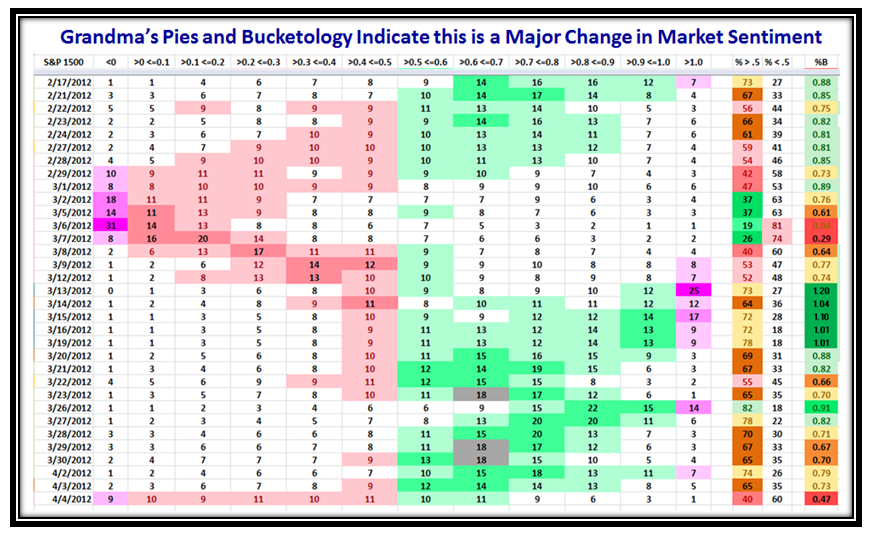
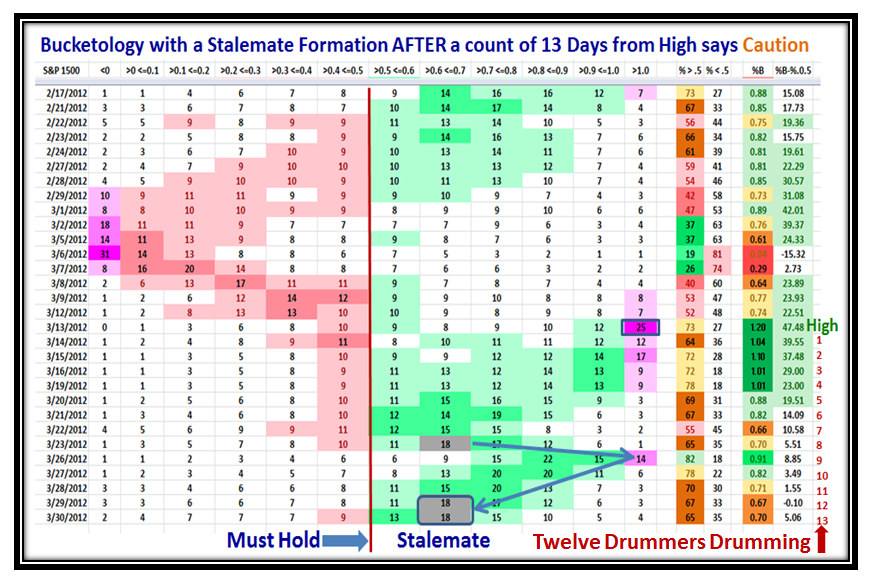
So, stay light on your feet, find the ponies, and let the Market tell you which way it is headed while watching the clues for which way the wind is blowing as I taught you to watch to stay on the right side of the Market. The first clue is Grandma’s Pies which is at 65:35…getting a trifle soggy. Note also that the % of Stocks in Bucket 0.6 to 0.7 is the highest of the bunch and sitting at 18% with the market having reached a high 13 days ago. I also taught you that 12 Drummers Drumming and Sweet Sixteen (>16%) or more in that bucket is a warning sign that the BIAS is downwards as I show on the next chart:
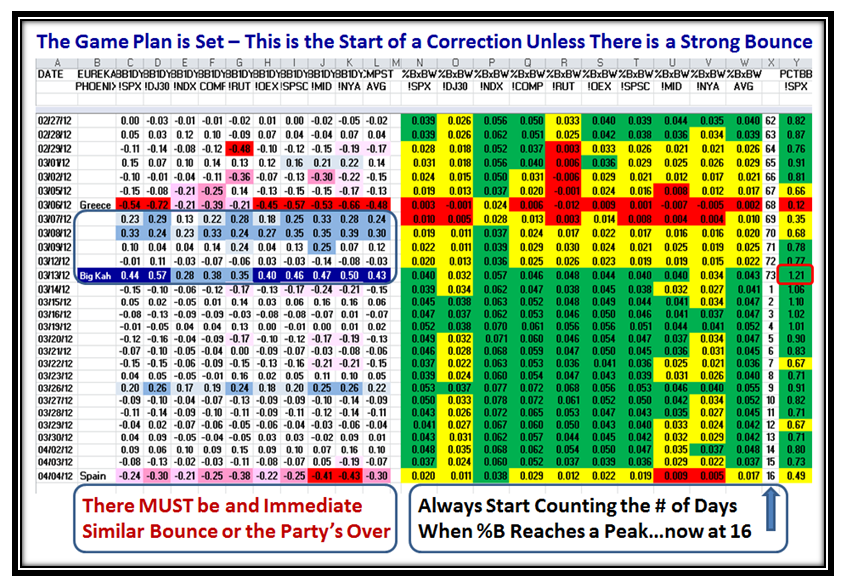
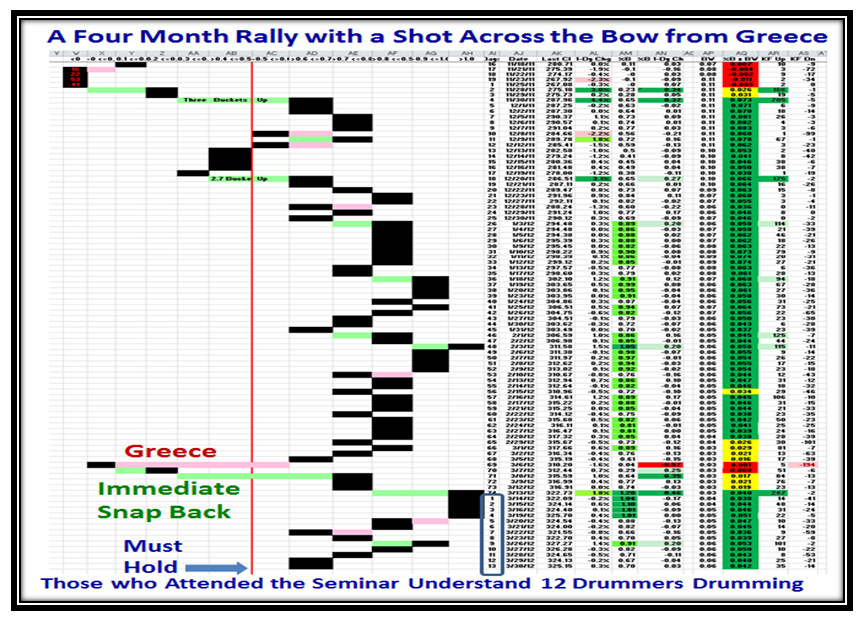
This next Chart shows that we have had a four month rally and except for a shot across the bow with the Greece kerfuffle, it has been mighty strong running into a top on 3/13/2012, when we start the count for twelve drummers drumming. It has now been 13 trading days since then and we have gradually trotted down, where it must hold at the 0.5% middle Bollinger Band line if this rally is to continue as shown on the chart:
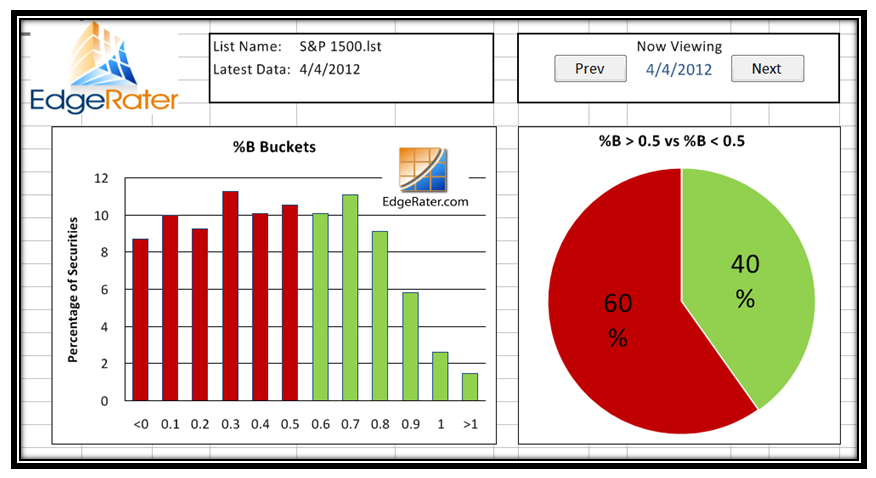
…And another look at the % of stocks in each of the twelve Buckets confirms the to and fro of the Market to show you how it is not difficult to know which way the wind is blowing as you use the Rules of Thumb from past experience:
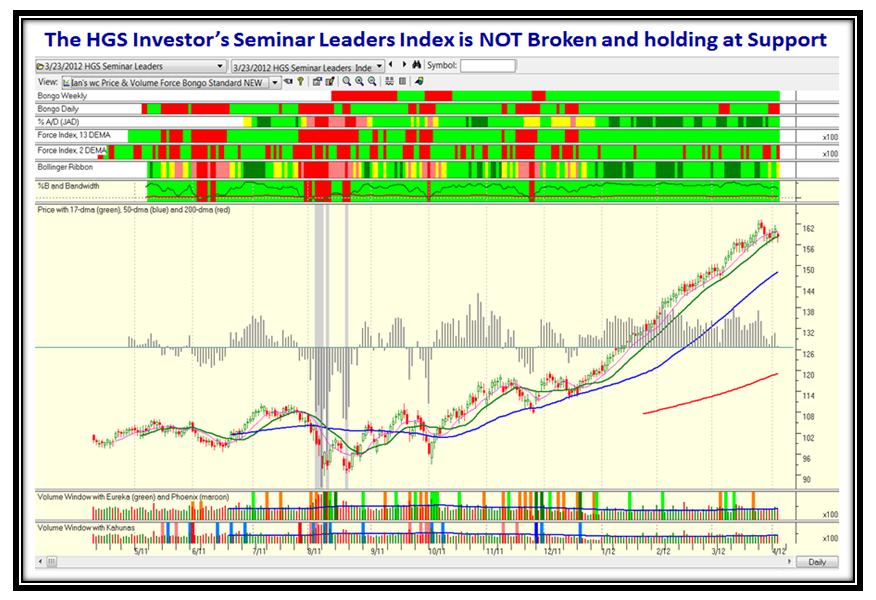
So there you have it. Ron and I wish to thank you for your support at another successful seminar where these Blog Notes should be duck soup to you who attended and made it such a wonderful experience for us all. Those who are regular viewers of Ron’s Weekly Report will do well to insert the Leaders Index into the HGSI software we established at the Seminar with Dr. Jeffrey Scott leading the way, as that list will give you a quick clue if and when the Market Breaks.
Best Regards, Ian.
 Ian Woodward's Investing Blog