Ian Woodward's Investing Blog

Archive for the ‘HGS Principles’ Category

Stock Market: Doom and Gloom or Plain Sailing?

Sunday, September 25th, 2011

There is always a Market of Stocks, and although we have had a major blow to the budding Bounce Play with the two days massacre of the Stock Market last week, there are always opportunities in the short term when the Market is oversold.  However, Types 1&2 near term traders can have fun, but Types 3&4 must wait one more time to opt in.  This Blog Note shows the current status and then portrays the alternatives for how to ferret for opportunities while getting early clues of which way the wind is blowing:

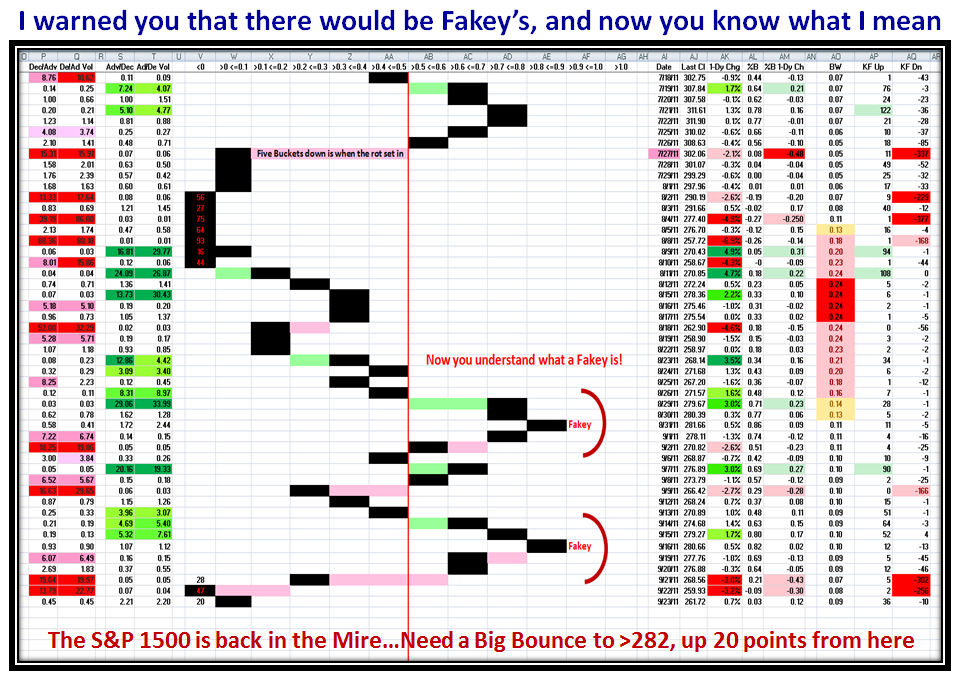
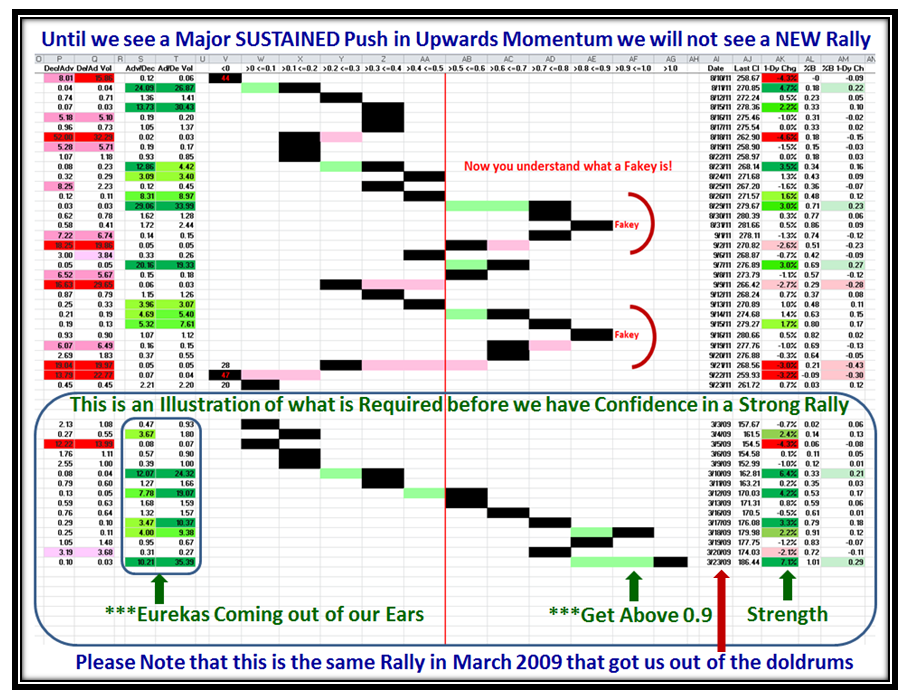
So let’s start with the bad news and show you that we have now suffered from two Fakey’s while ending down in the dumps of despair once again.  Those two heavy down days on Wednesday and Thursday just took the wind out of the sails of the Bounce Play.  Some Technical Analysts would suggest that we have now experienced a Double Bottom and that the Market is Oversold, so the near term opportunity is to the upside.  Others would argue that we haven’t seen the worst yet, particularly with little consolation from Helicopter Ben which started the rot down, and the uncertainty in Europe with the knife edge for the Greek Economy and Debt Crisis:

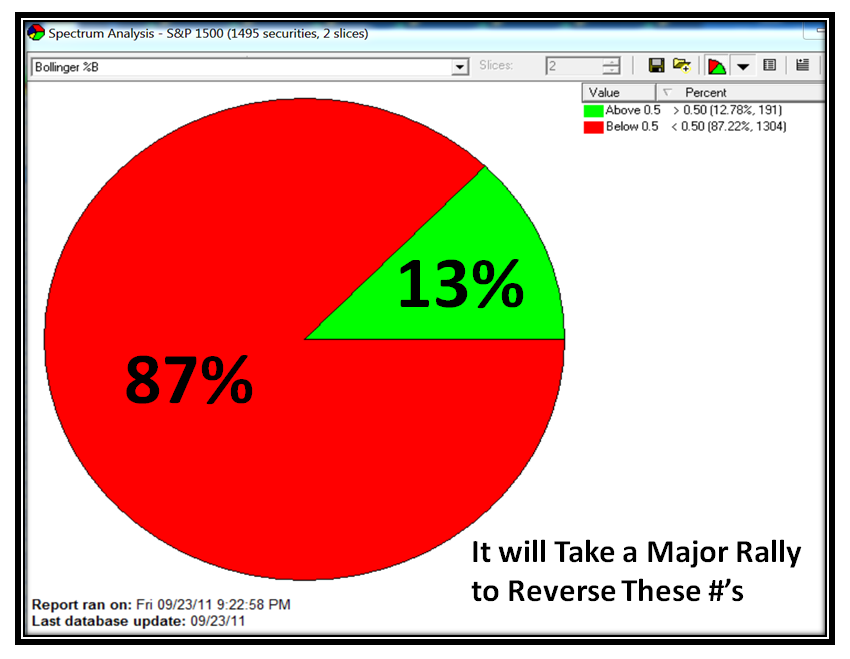
…And just to show you the damage in terms of the % of Stocks in the S&P 1500 that are above and below %B of 0.5, i.e. the Middle Bollinger Band, here is that picture, which will take a Major Rally to reverse:

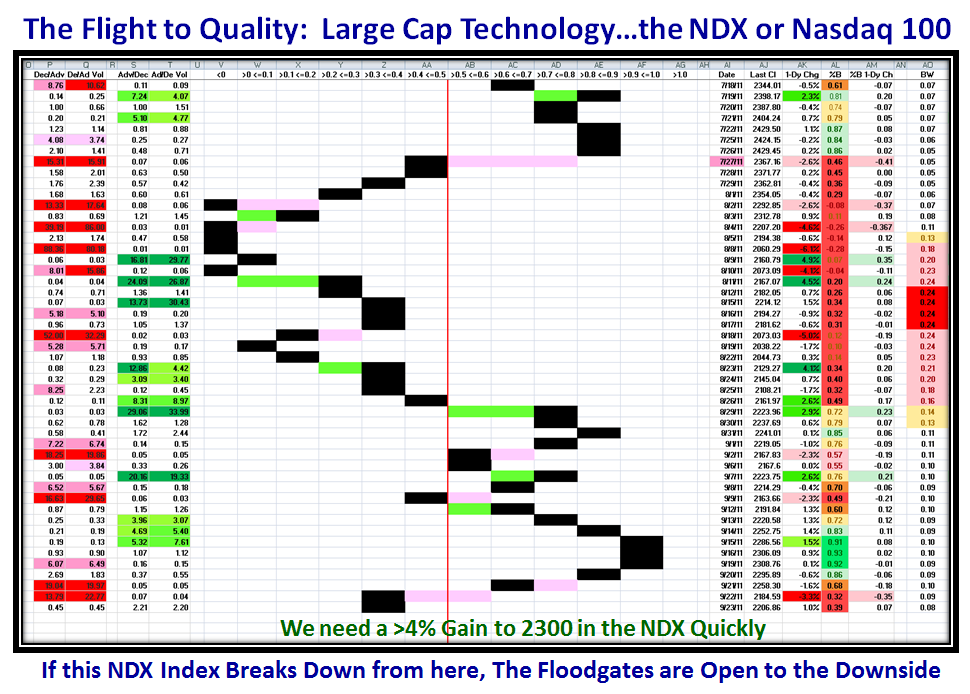
At times like these, it is important to understand the Flight to Quality, and naturally we would expect to see that in either the OEX or the NDX.  This time it is Technology that is holding up the fort from a Market Index point of view and here is the NDX:

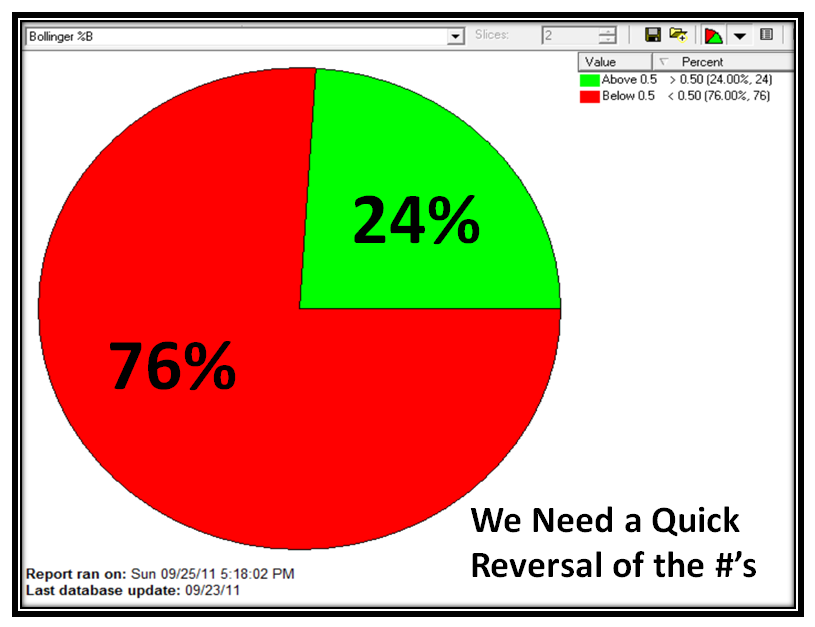
This shows a slightly brighter picture, but we still need a quick bounce play to get us back to respectability of %B above 0.7:

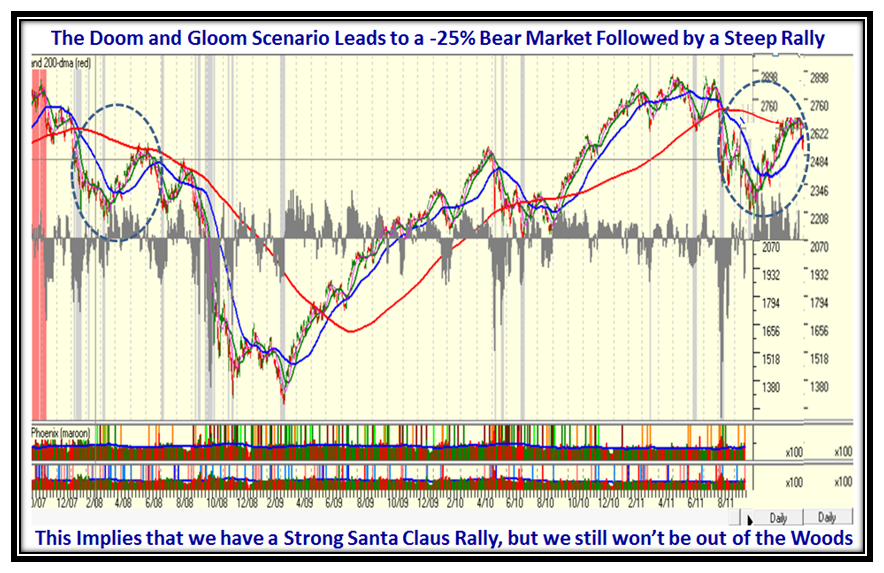
It’s not quite as sick as the S&P 1500, but that is what we should expect.  So now that we have a feel for the status, the next job at hand is to look at the Alternative Scenarios as I have taught you.  I warned you that the Death Cross was looking ominous and with that drop last week it has widened the gap between the 50-dma and 200-dma to the downside.  So now we know the extent of the challenge we face in getting back to a Golden Cross where the 50-dma comes back up through the 200-dma.  If we zoom out to a long term chart,  it doesn’t take two minutes to see that we are way past the dynamics of the Flash Crash Scenario and that the challenge looks more like the early stages of Black Swan as I show below.  I have superimposed the left hand side dotted circle on the right hand side, and it suggests two points, unless we have a miraculous recovery from these depths…which I will show you what that will take later:

1.  The expectation with this scenario is a further drop into Bear Market territory of around 25% (say), before we perk up for a Santa Claus Rally.

2.  It will take a strong Santa Claus Rally in his Red Car with no Grinch or Moose Droppings along the way!

This is the Low Road, Doom and Gloom Scenario:

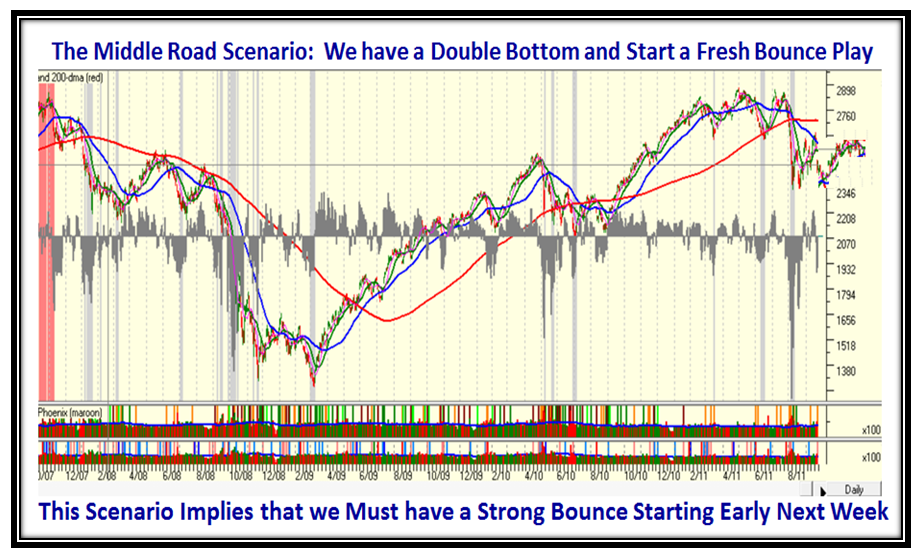
So let’s now take a look at the Middle Road Scenario, which dictates that the Double Bottom HOLDS and we bounce back with vigor this coming week to at least reach the highs we hit before the disaster of last week:

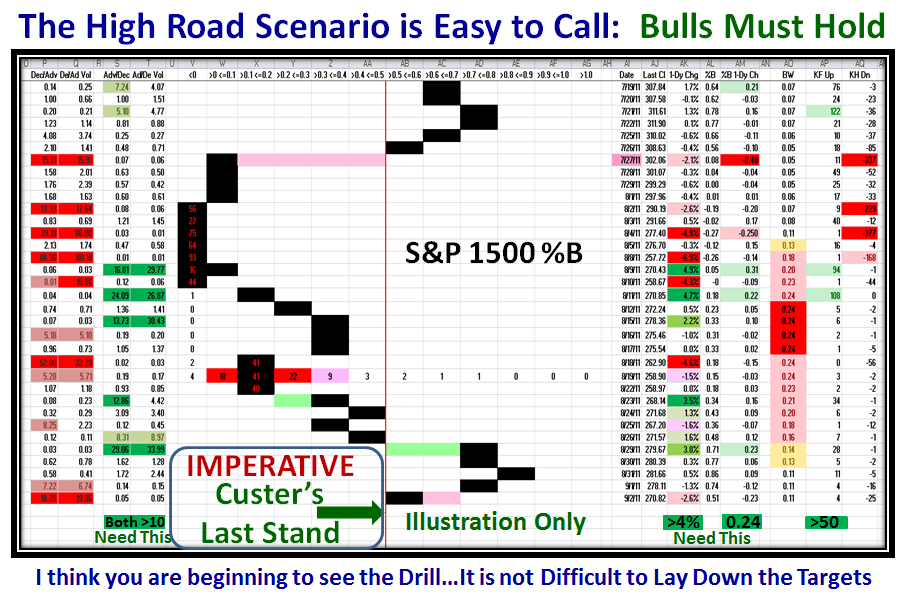
Earlier, I promised you what the High Road Scenario looks like.  If you are so optimistic as to believe that this double bottom is the clue for you to dive in with both feet, be my guest.  However, it is not difficult to identify the challenge that must be met and there is no better way to show that than to go back to the start of the Rally back in March 2009.  I have superimposed what that should look like on the S&P 1500 chart I showed you earlier and the bottom half of the chart below shows exactly what I am talking about.  As I say, “We need Eurekas and Kahunas coming out of our Ears.”  Unless we see this kind of performance don’t get fooled into dipping your toe in the water:

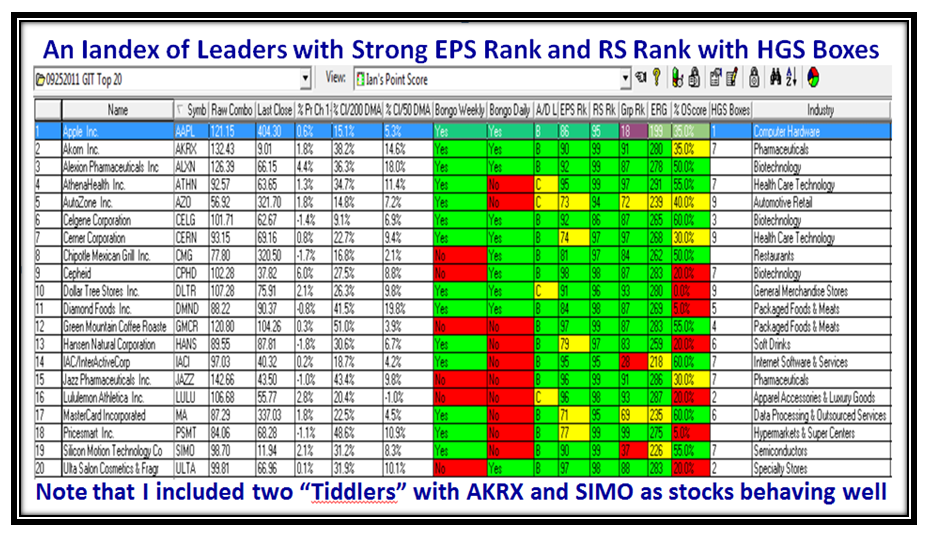
I’m sure at this stage many of you are saying “That’s all very well, Ian, but how can I keep an eye on Leading Stocks in Wolf Pack Industry Groups that will give us a clue of whether this market will start to blossom or will continue to crater.”  It’s been a while since I have done the “Iandex” Index for you which selects current Leaders in various Industry Groups that are currently above their 50-dma and 200-dma and can potentially lead us out of the mire or fall back to earth and die with the rest which are already underwater.

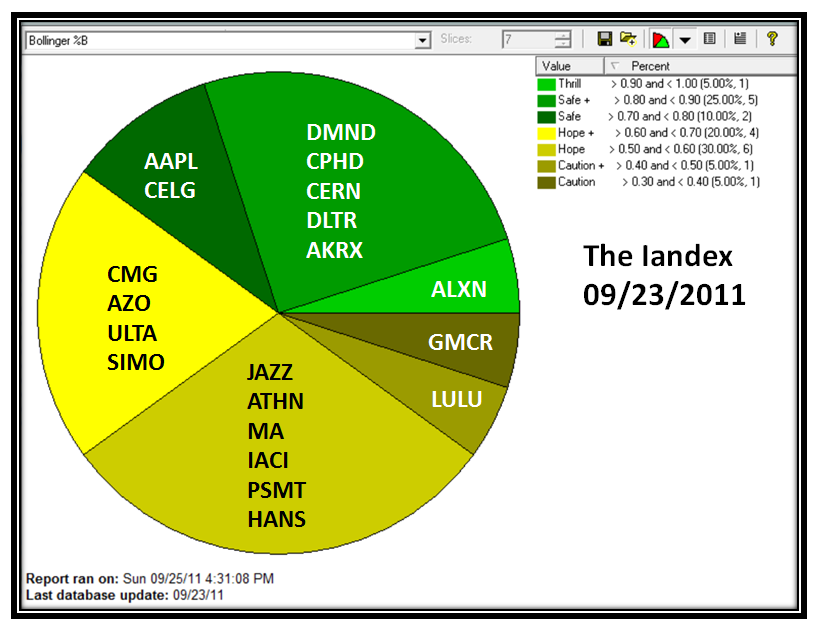
We are exactly one month from the HGS Seminar on October 22 to 24, so the performance in the next month of this Iandex will give us a good yardstick of where we stand by then.  Put these stocks into your HGS Investor Software and you can follow along and judge for yourself.  Remember that its main purpose is to see if the Market Craters, but if these Stocks hold up then the other purpose is to zero in on the Wolf Packs.  The first Chart shows the familiar Pie Chart as to where the Stocks in the Index sit now:

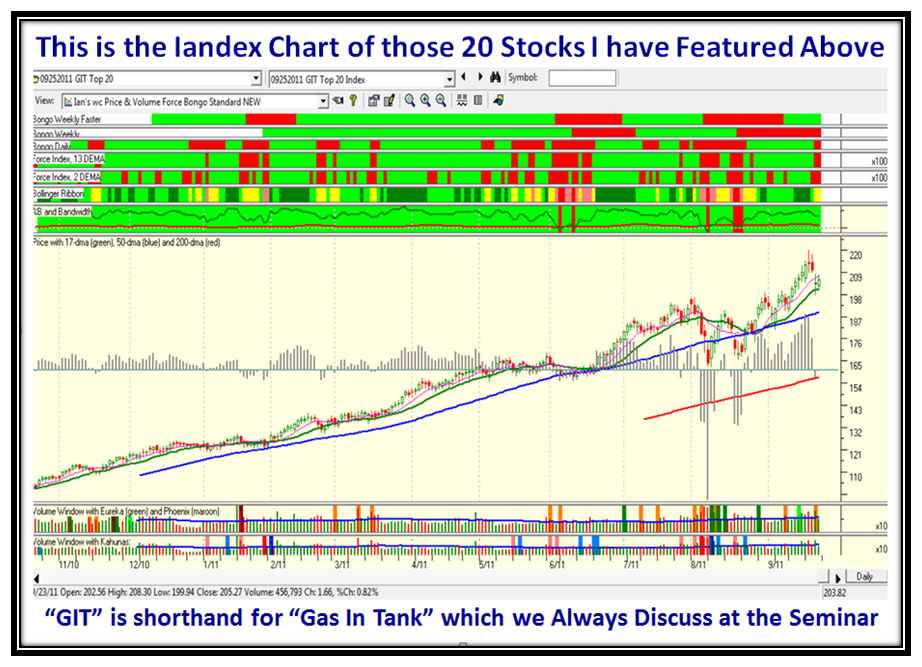
The chart below is the Index of these twenty stocks and one can see that as a group it shows current strength:

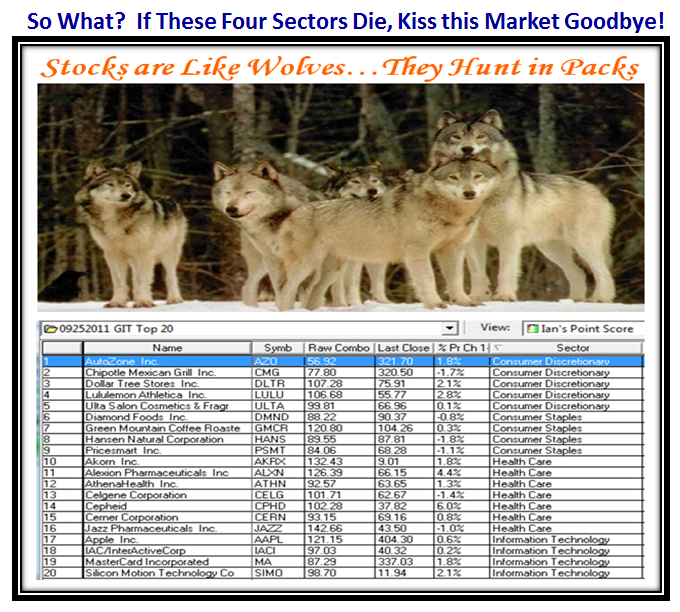
This Blog Note would not be complete without getting to the answer of the “So What?”  Always remember that Stocks are like Wolves…they Hunt in Packs!  There are currently Four Wolf Packs as shown below.  That should please some of my regular viewers who use this slogan to look me up!  Enjoy:

If these Wolfpacks survive, we have hope for a new rally; if they die, the party will be over for now.  Ron and I look forward to seeing all of you in just four weeks…hurry, hurry, hurry there is plenty to learn and master to keep your Nest Egg safe and growing.

Best Regards, Ian.

The Fed’s Twist is No Chubby Checker!

Wednesday, September 21st, 2011

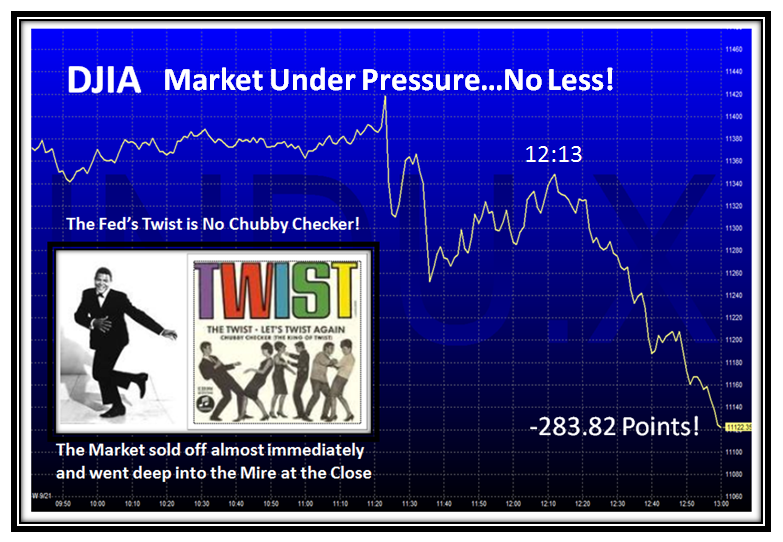
I know you folks have been eagerly looking out for my take on the two items I told you to watch ten days ago and now we have both items behind us, the American Jobs Act and the Fed Meeting which ended today in a flop as far as the Stock Market is concerned.  I didn’t want to disappoint you so enjoy the charts which speak for themselves as I want to get this out early enough so that the East Coast supporters can chew on this before they go to bed:

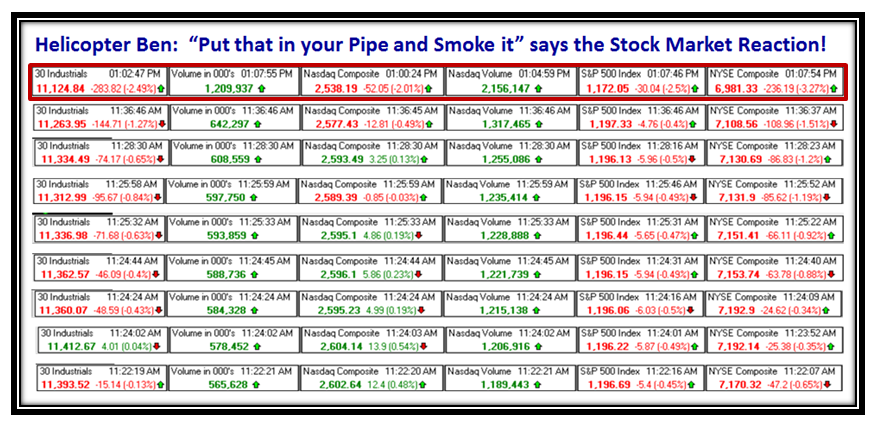
One of my favorite pastimes is to record the Market Action on the day of a FOMC announcement, so true to form, here is what Ron and I observed as we chatted on Skype at 11.15 am onwards:

It didn’t take but two minutes to see we were headed down, and it was a landslide all the way down to the close:

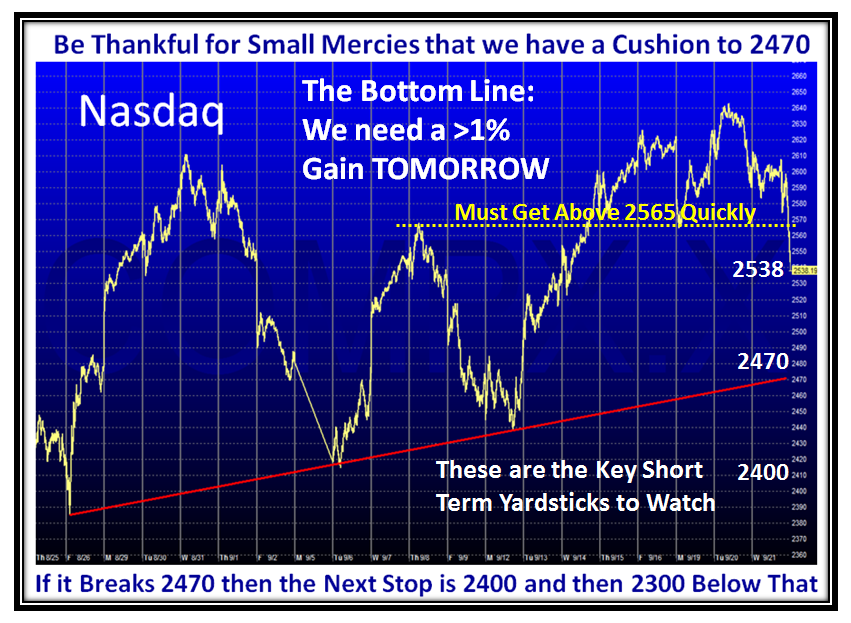
This Next Chart has all you need to know for the immediate short term these next few days.  Make no mistake about it, we are extremely fortunate to have a BIG Cushion from the lows of 2300 or so.  We need a >1% Bounce Play tomorrow:

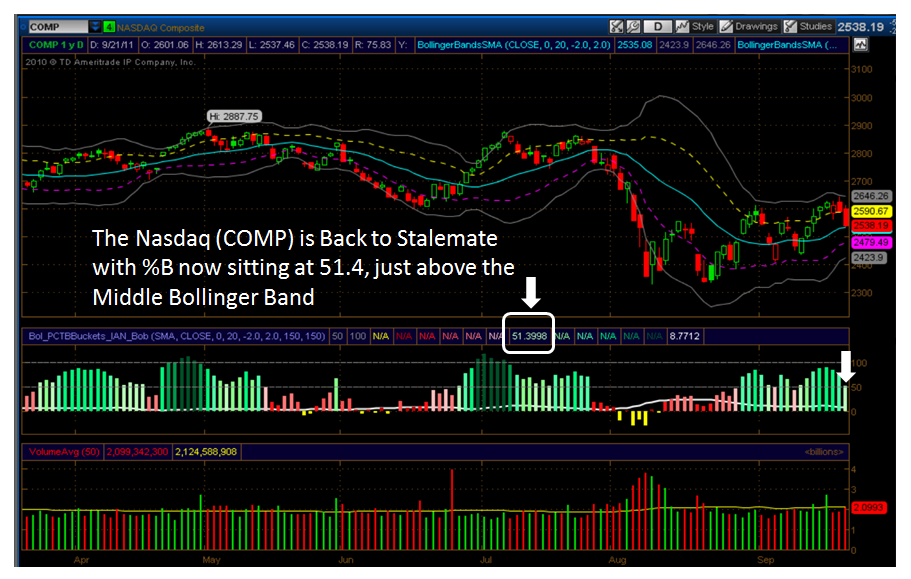
Now let me show you a different view relating to %B and Bandwidth as developed in Think or Swim by my good friend Bob Meagher who will be at the HGS Investor Seminar in just four week’s time, and will be only too glad to help you when you see him there.  This picture is in real time and the bar at the end of the chart for %B wiggles up and down with the market so that I can tell when we are due for a Bucket Skip to the upside or the downside.

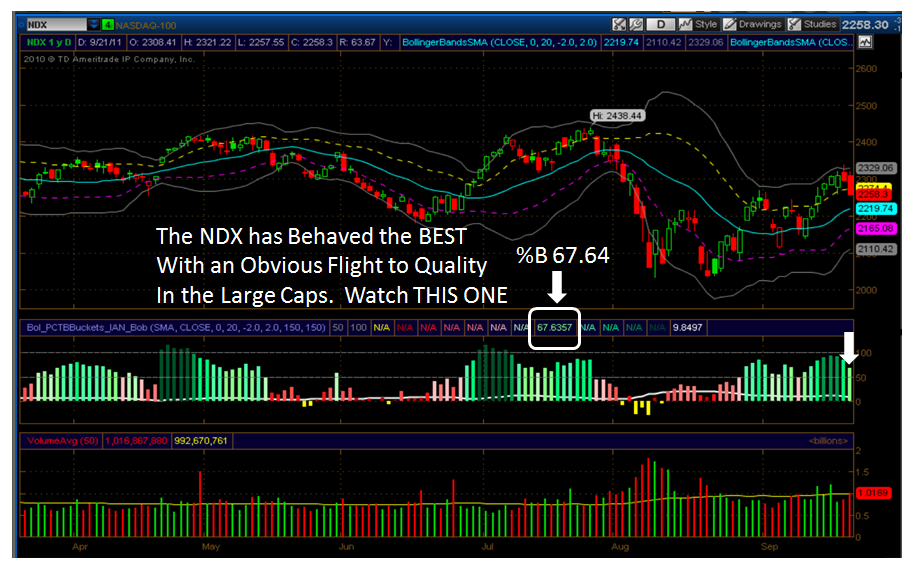
If you have been watching the various Market Indexes as I do, I am sure you will have noticed that the NDX has behaved the best with a flight to the Big Cap stocks for safety.  I strongly advise you to watch the NDX as it will be a true guide as to the health of the Market and if it can weather the storm created by today’s reaction to the Fed’s attempt at a cha-cha-cha on the twist.  Start dancing Helicopter Ben:

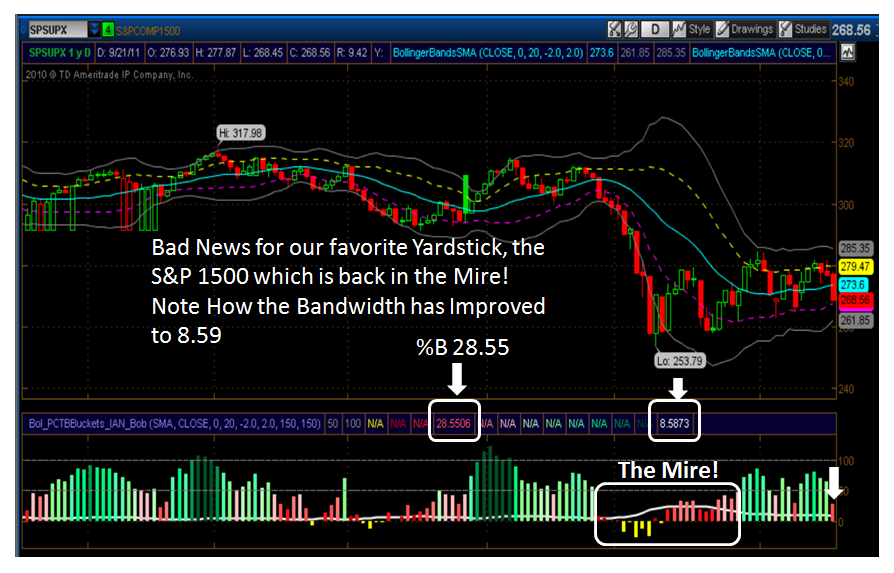
…And now for the bad news relating to our favorite surrogate for the market, the S&P 1500, which is back once more in the Mire.  Judge for yourself:

If we break down below the Lower Bollinger Band, the Bandwidth which has recovered nicely to <9.0 (8.59 to be exact), will quickly grow and if it heads back to 24 or more you know that we will be back to Black Swan days!

So the Game Plan is very easy.  If the S&P 1500 breaks 261.85…the Lower Bollinger Band, then you need to either short the market or run for the hills.

It is no secret that HFT’s (High Frequency Traders) rule the roost, so be mighty careful where Angels Fear to Tread:

What is the Moral of this Story and the lesson learned?  Always keep an eye on impending Fed Actions and Political Decisions that may affect the Market’s reaction, especially when the Market itself is very jittery and is primarily NEWS DRIVEN.  40% to 60% of your Portfolio’s movement depends on the Market, 20% to 30% depends on the Industry Group and the remainder is due to the Security itself…therefore, always watch the Market and Industry Group FIRST!

Best Regards, Ian.


Stock Market Focus: Greek Default and American Jobs Act

Saturday, September 10th, 2011

Yet again when all eyes were focused on the Speech by President Obama, we woke to another whamo from the concerns of a Greek default and all hope of a decent week were shattered with another 300 point drop in the DOW on Friday. The entire situation is on a Knife Edge, so watch out below:

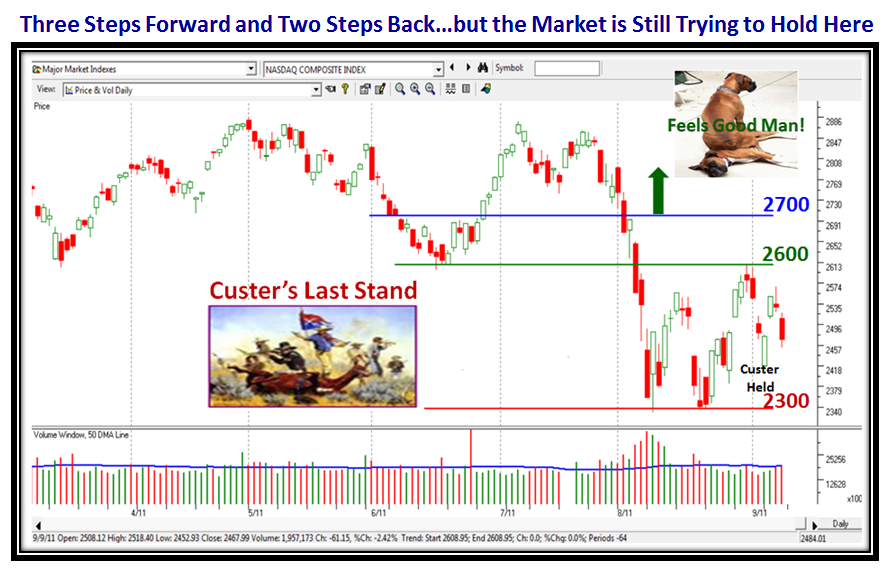
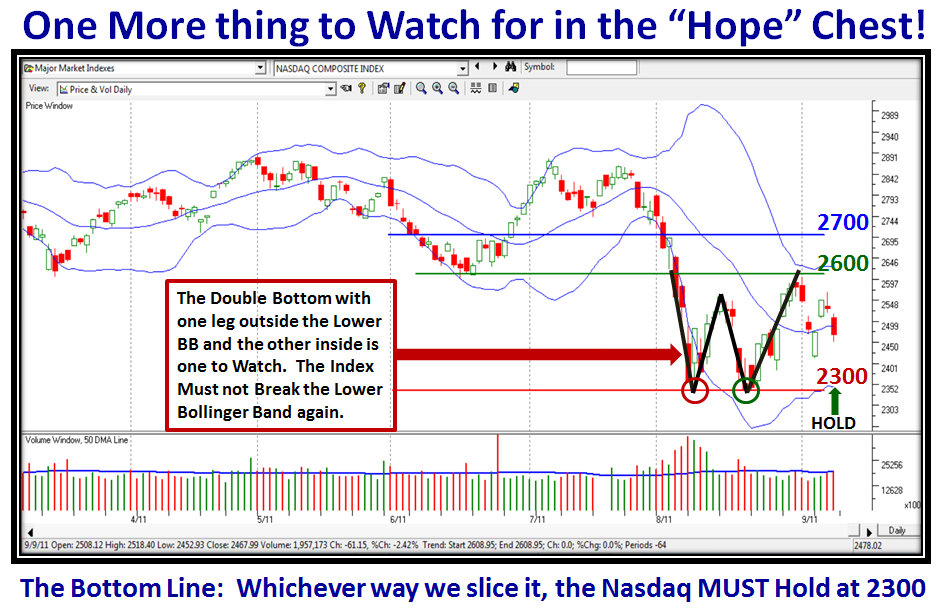
Don’t expect anything earth shattering from Helicopter Ben who also disappointed with no real news last week, so he is in hiding until the FOMC meeting in ten days time on September 20-21, which will coincide with the full roll out of the American Jobs Act Plan with more details.  However, that is an eternity for the Market and unless we see a surprise out of Europe to turn the Greek default fears around, the Nasdaq will have a tough time holding the line at 2300, which is now the crucial line in the sand before we fall further into the Mire:

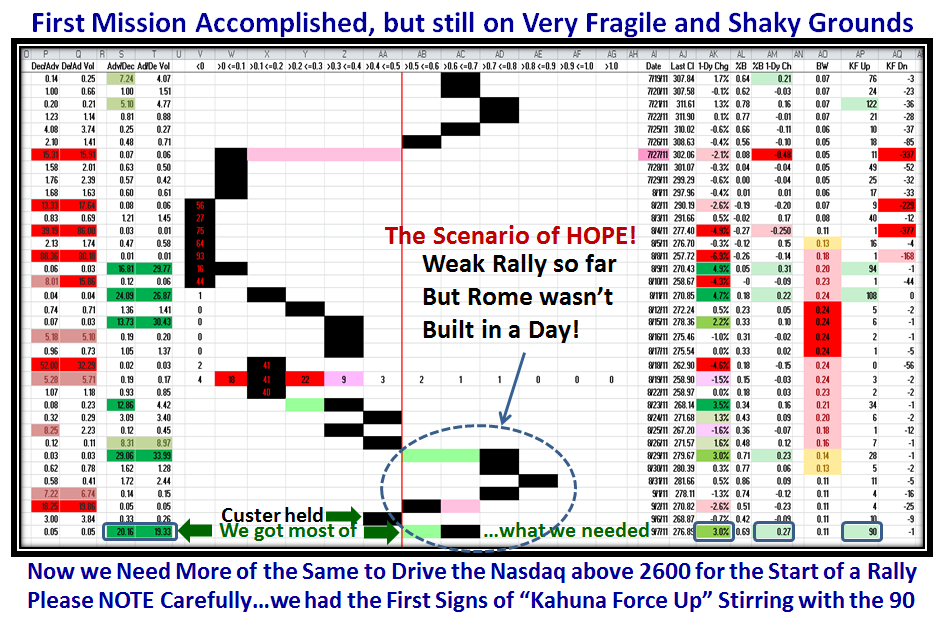
So now that you understand the Emotions driving the Market for the next couple of weeks, let’s review the bidding on what I told you must happen last week and how all of that panned out, first to the upside and then into the Mire on Friday.  Here, to refresh your memory were the targets I set:

…And, true to form, we got what we needed almost perfectly.  Everything looked rosy at the start of the week with Kahunas galore on 9/7/2011:

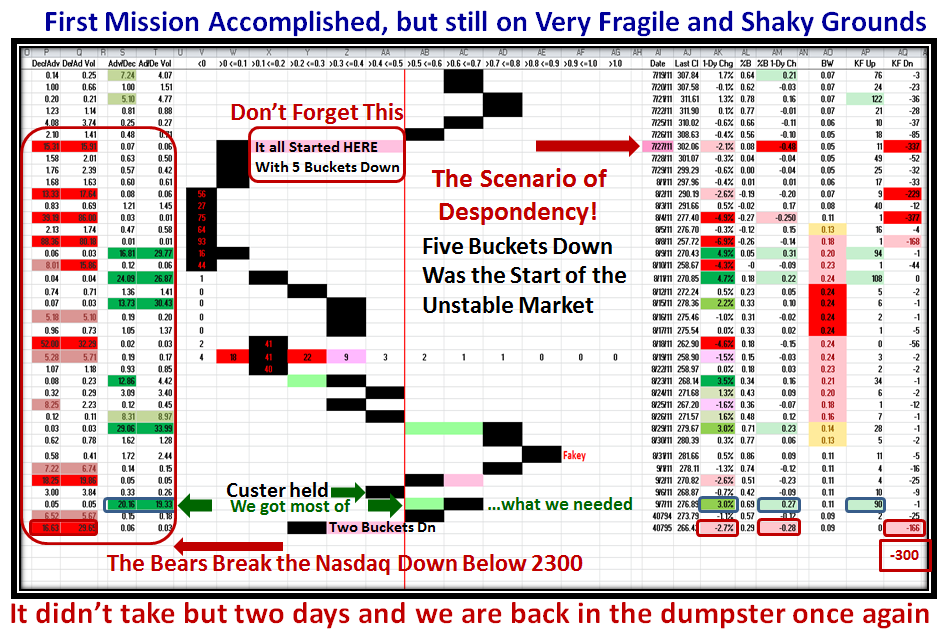
But then the Market lowered the boom on Friday with all that kerfuffle on the Greek default situation and we go into next week sitting on a knife edge:

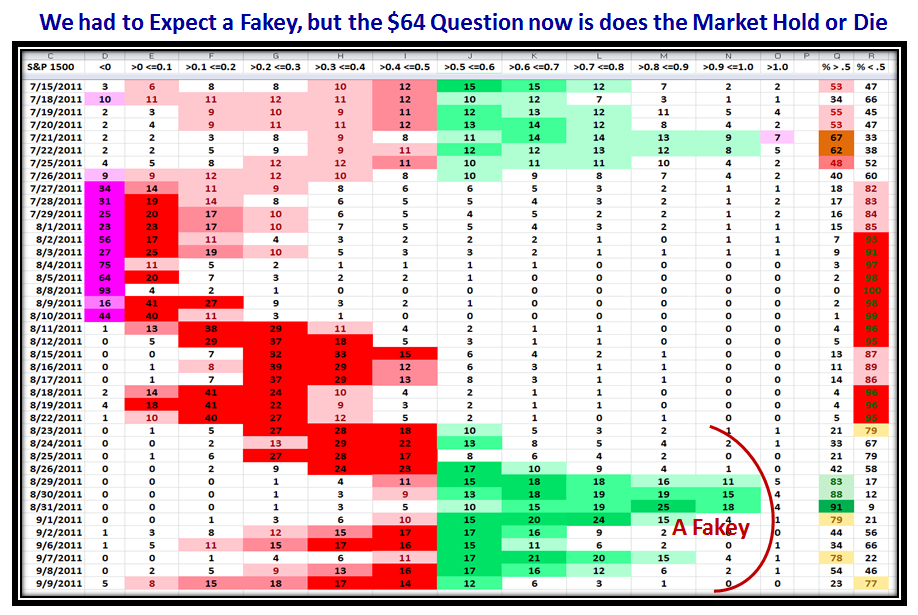
One more day like Friday and we can kiss the so called “Market in Uptrend” goodbye, and the Bears will start their jig again on the short side.  So the bottom line of all the efforts of the last three weeks has turned out to be a Fakey, which was to be expected as we have learned since Flash Crash Days:

However, there is a sense that unless there is catastrophic news, this market is marking time, zig-zagging back and forth with an edge to the upside:

…And here for those for whom Hope springs eternal, is an idea which my good friend Maynard Burstein gave me a winky-winky on.  Keep an eye on it:

As I close this blog tonight, I spare a thought for the families of the victims of 9-11.  Out of that deep sadness came a spirit that united this country as it was never united before or since.  If only we could wave a wand and capture that feeling of comradeship again instead of the bickering we see is my sincere wish.

Best Regards, Ian.


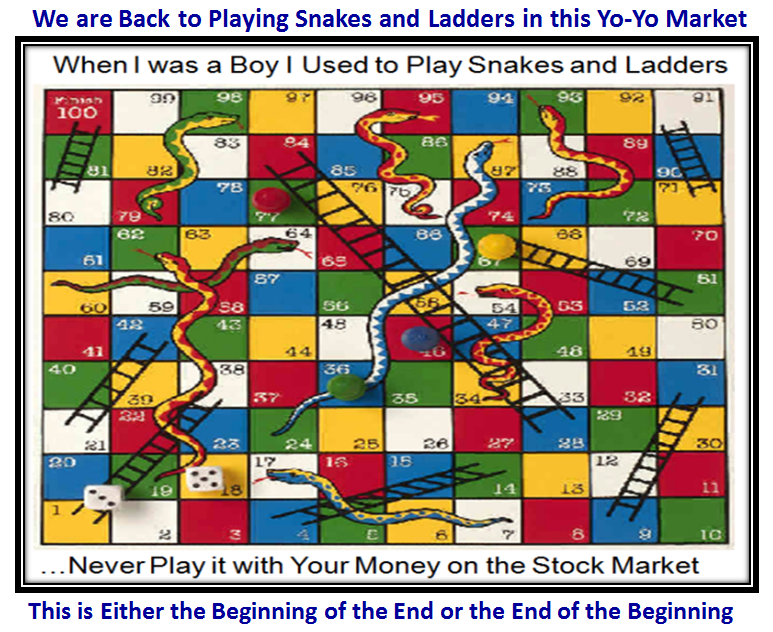
Snakes and Ladders in a Yo-Yo Market

Monday, September 5th, 2011

I need hardly tell you that this coming week is a Do or Die Week for the Bulls!  Mark my words, Friday September 9th. will be a Pivotal Day!  On September 8th, President Obama delivers his jobs/economic address to a joint session of Congress, and the airwaves will be a buzz with the Market’s and Pundits’ reaction to his speech.  We hope it will be one with reasonable specific actions to re-assure the Markets of significant improvements to come for the short and long term future of this country.  If not, expect more turmoil, as we are already in a Snakes and Ladders Market.

Hold your horses…we may not have to wait that long as Late Breaking News from my good friend Manu says ” European Stocks Fall Sharply as Debt Fears Hit Banks”, and here are the results to prove it:

Oh well, enjoy your Labor Day Weekend, and as Doris Day used to sing “Que Sera, Sera! Whatever will be, will be”:

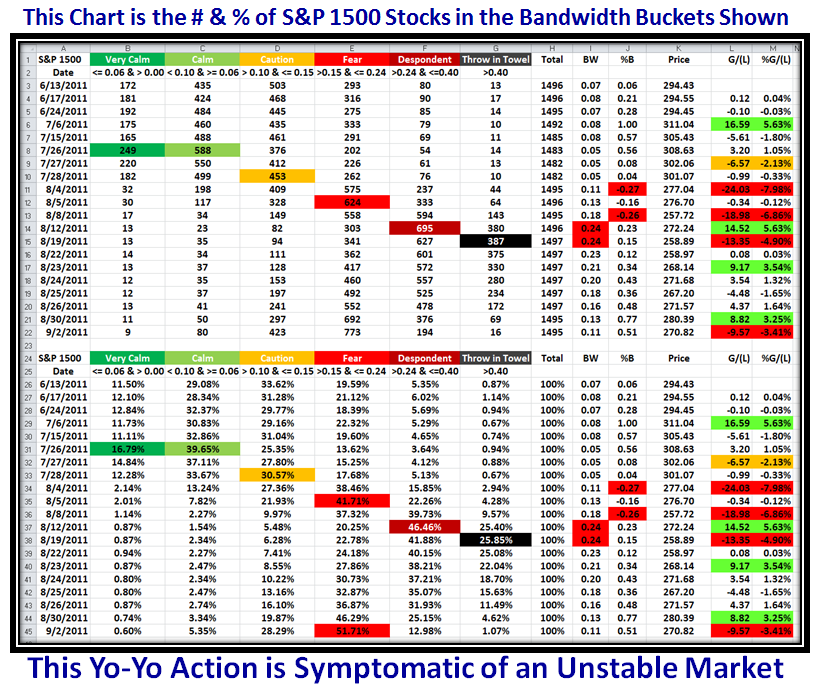
Now on to the “Good Stuff”.  Here is a dose of Bandwidth Buckets to bring you up to date on the work I have been doing on this score.  In the following chart, I have milked the Concept of Buckets and have kept a log of the progression of how the various Buckets have been filled for Bandwidth criteria as shown on the chart ranging from Very Calm all the way up to Throw in the Towel.  My good friends Ron Brown and Steve Paris filled me in with past data to help build this picture.  It captures the decay in the market very well inside three weeks from Very Calm to Throw in the Towel:

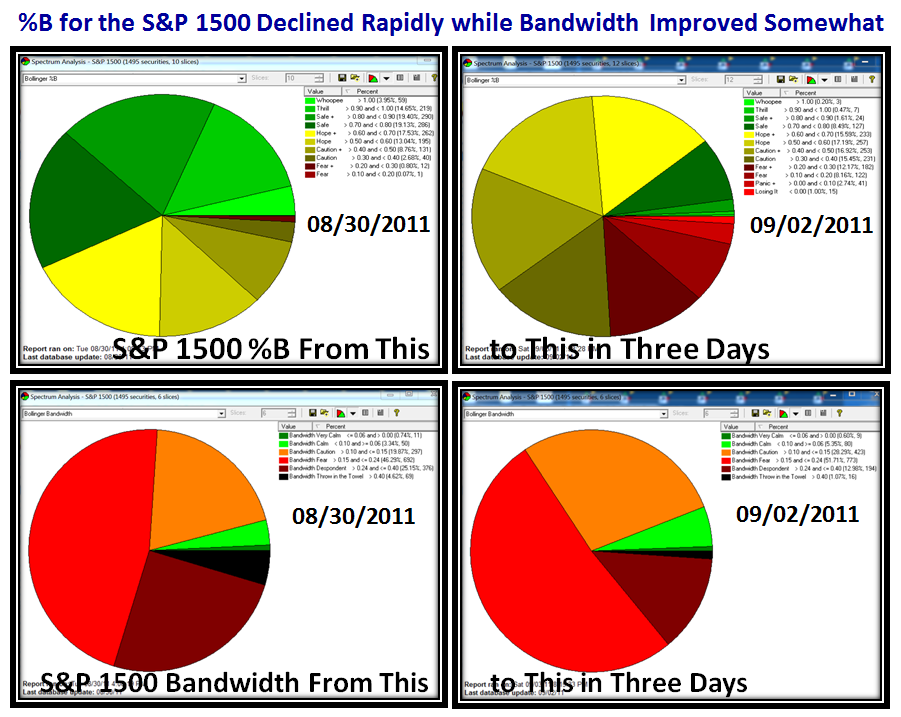
…And here for good measure are the Pie Charts for both %B and Bandwidth for the S&P 1500 comparing the change in three days, where things were looking rosy on 08/30/2011 and then took a major turn for the worse on this last Friday, 09/02/2011.  You can immediately see the Sensitivity of %B as it changed from Sunshine to Gloom and Doom:

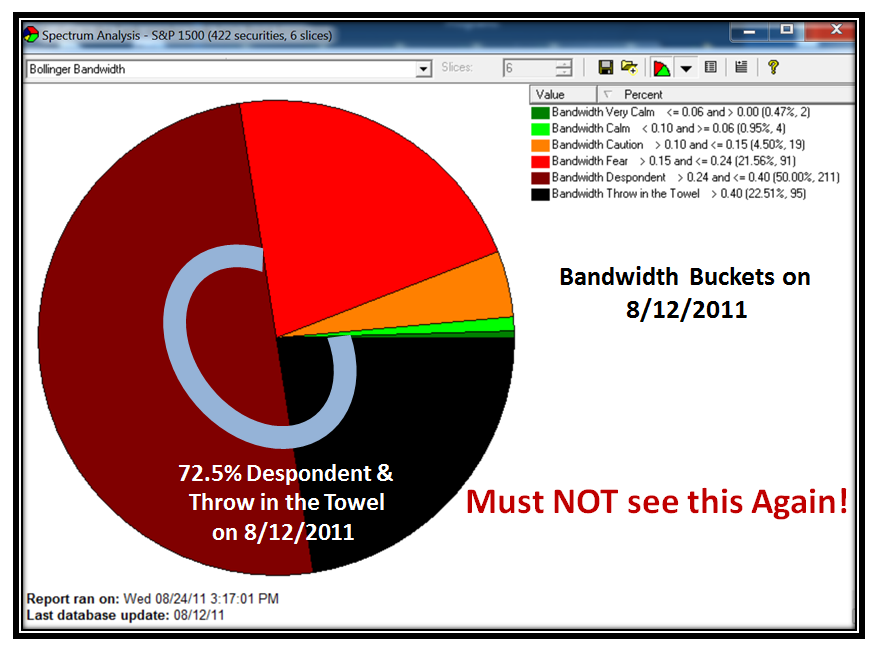
Just as a reminder, here is what the picture looked like for Bandwidth Buckets on 8/12/2011 when the Cave was falling in, and I remind us that we don’t want to see this same picture any time soon, or else it is curtains for any Bounce Play, Tepid Rally or Market in Confirmed Uptrend or whatever name you choose to call it:

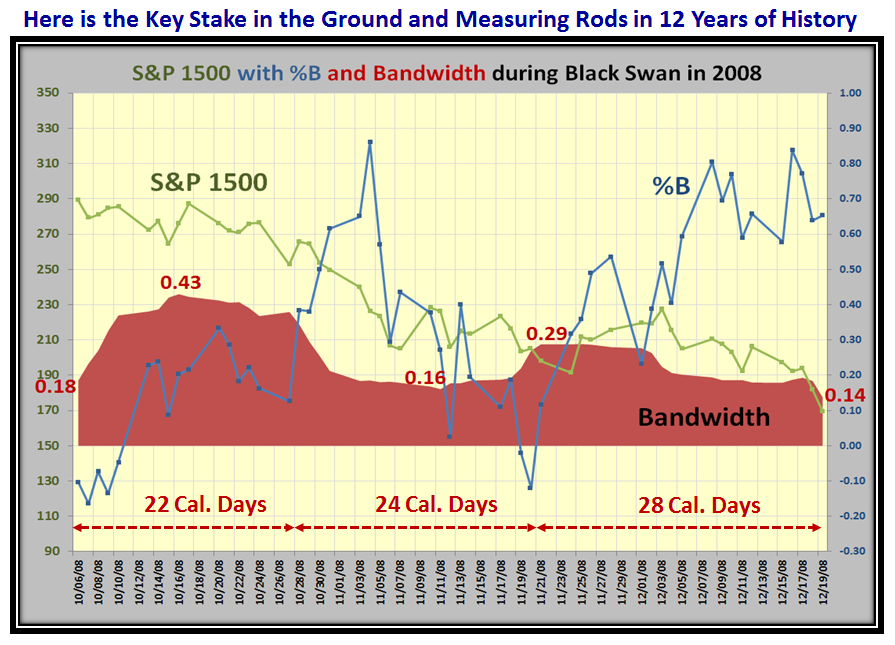
Now here is the picture of what we endured during those dark days of 2008 when the Market fell like a rock to become known as Black Swan.  It gives us the Key Picture for any Benchmarking on Bandwidth for the future…let’s hope we don’t dwindle to this picture:

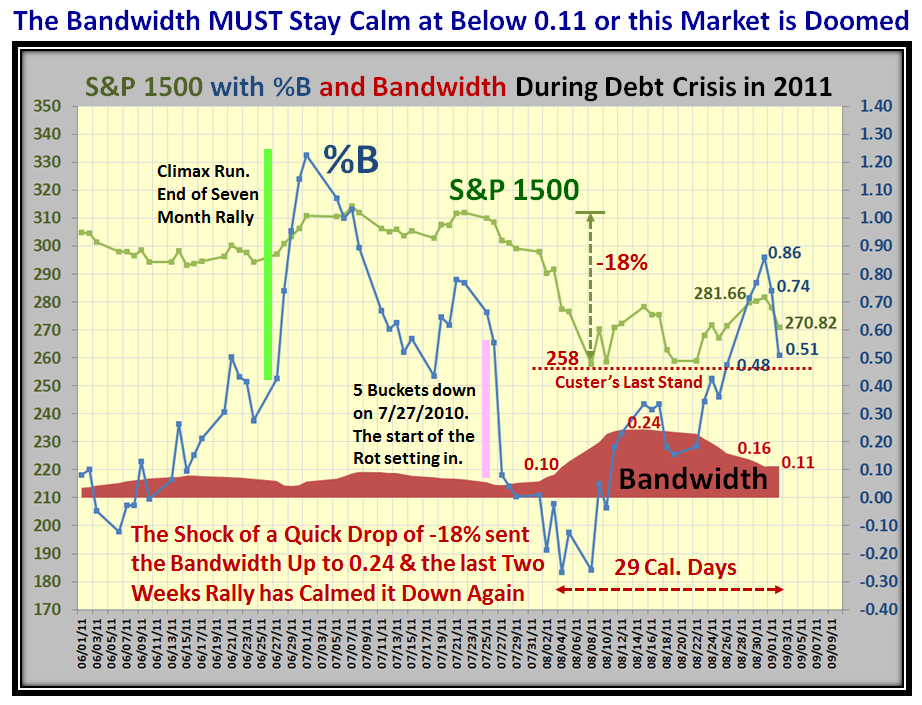
…And, here is the picture as we sit today.  Notice that I show the early warning clues for the Climax Run we experienced at the end of a seven month rally, and then the notorious and unprecidented five bucket fall that came on 7/27/2011 to wash out the entire Market with a -18% drop in a matter of a few days:

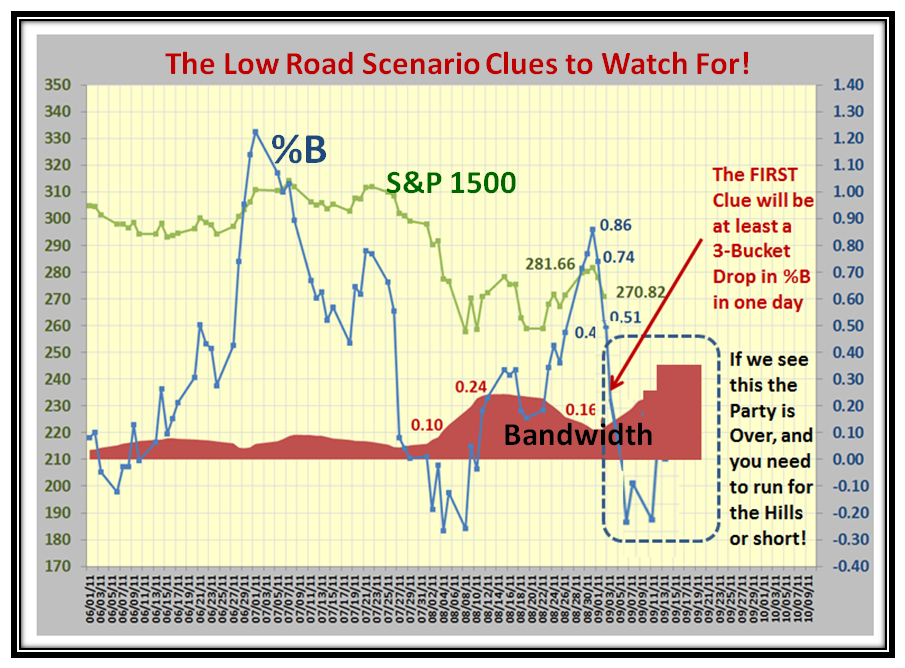
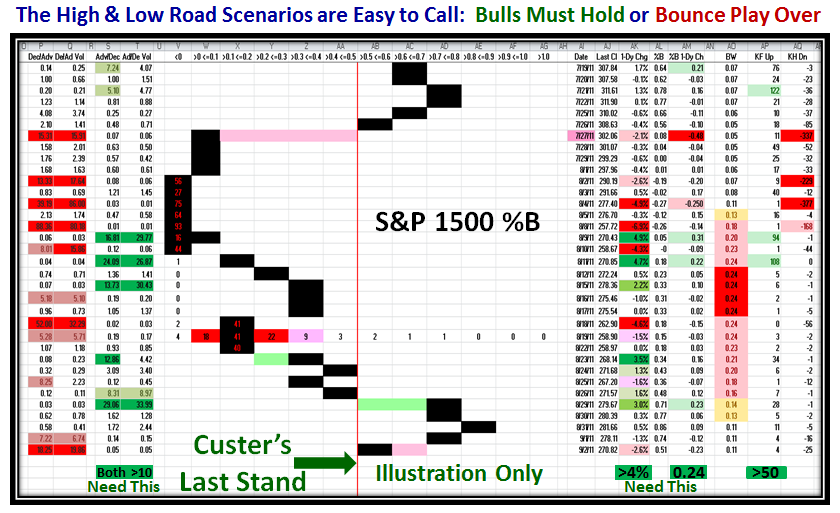
So  I am sure you are asking “What are the Low and High Road Scenarios for next week?”  Here is the Low Road:

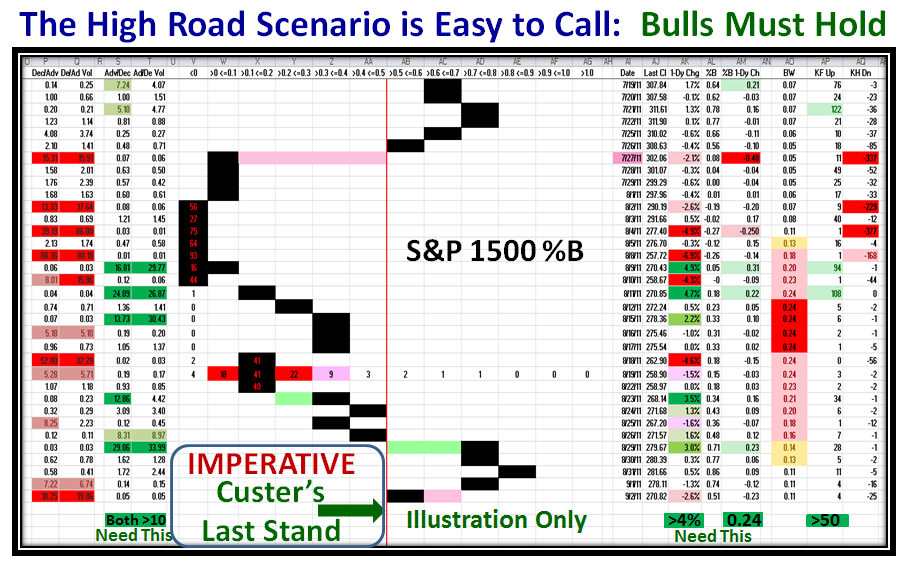
…And here is the High Road which I gave you just yesterday to make sure you keep this one in mind…Custer’s Last Stand for the Bulls for this round:

My sincere thanks to all of you who wished and wish me for hitting a milestone of an octogenarian tomorrow…I hope it is a good day on the Market!

Best Regards, Ian.


Bulls Must Defend the Island Gap, or Else!

Saturday, September 3rd, 2011

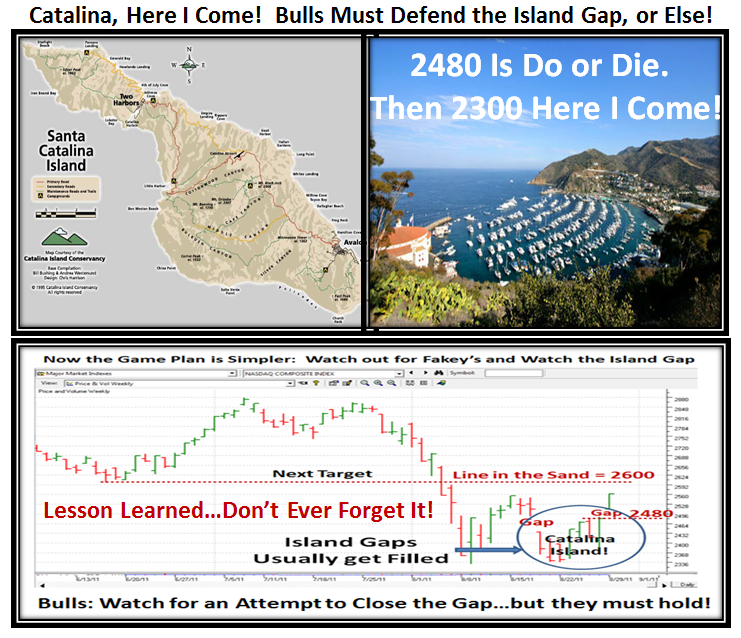
The Bounce Play lasted a few days and then the Island Gap I discussed last week was too enticing for the Bears to fill, and fill it they did with a vengeance on Friday.

So now the Real Fight begins at Custer’s Last Stand.  Ideally the Bulls must show strength and MOMENTUM to continue the Bounce Play above 2600 and on to 2700, or fizzle out and then watch out below 2300 as shown on the next chart:

…As we can see from the next chart we are at the Stalemate Line after a decent move to 0.86 and only to fall back to 0.51 for %B on the S&P 1500.  I identify  what is needed from the Bulls next week in order to maintain the Rally at Custer’s Last Stand as shown in the Illustration:

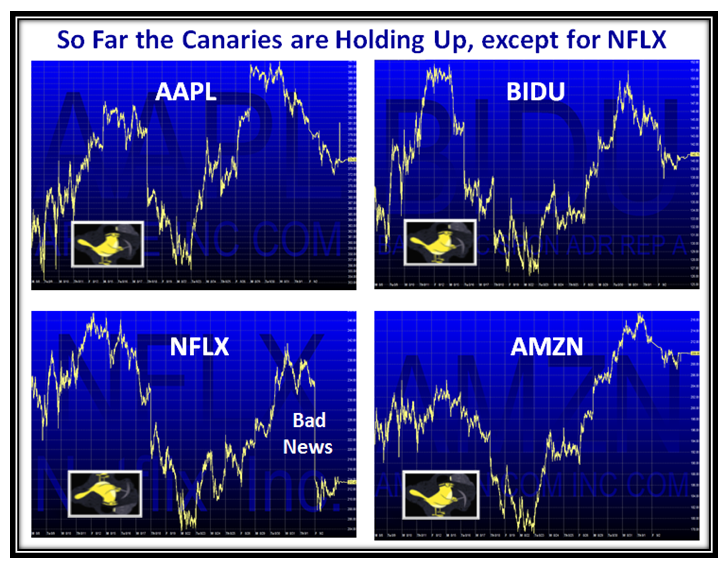
The one encouraging note in all of this is that three of the four Canaries are holding up, but NFLX had bad news last week and has given up the ghost for now:

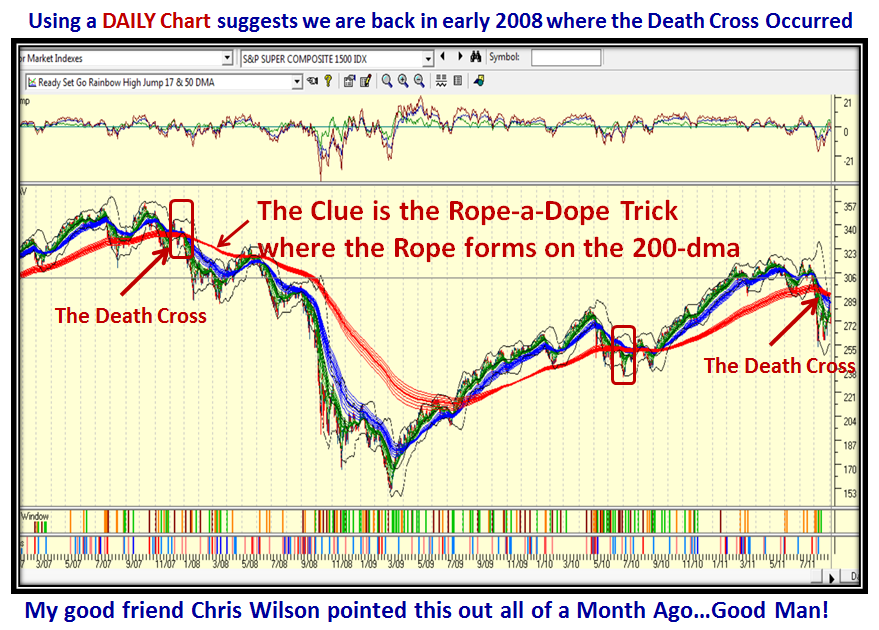
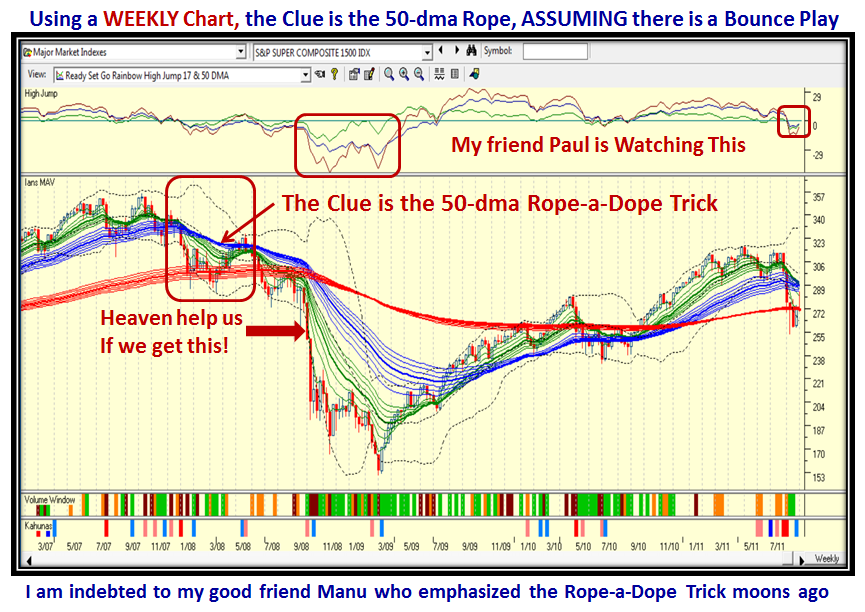
The bigger concern is that if Custer’s Last Stand fizzles out next week, then we are setting up for another big fall.  I don’t mean to be a fear monger, but the Death Cross that we have just experienced with that big 18% drop in all of the Indexes with some even hitting a Bear Market of over 20% before rebounding looks ominous as shown on the next two charts.  I am delighted that many of you know where to go to keep an eye out for early clues, and there is nothing better than the “Rainbow Chart”.  You need to try both a Daily and a Weekly Chart as I show you and the Clues are spelled out on the chart.

If you are new to this concept you can immediately see that the Moving Averages for the the 200-dma envelope on a Daily Chart and for the 50-dma envelope on a Weekly Chart must tighten into a Rope, i.e., come together.  That is the clue for momentum in the direction of either up or down, and in this case the direction is down.  If you look at the extreme Right hand Side we already have the 17-dma cluster and the 50-dma cluster fanning out due to that sudden drop.  It is imperative that the Bulls drive hard to turn this situation around or the  “Market in Confirmed Uptrend” turns to dust one more time in less than two weeks:

We can immediately see the Versatility and Power of the HGSI Software Product in making all of this a snap…try it, you’ll like it or else take two alka-selsa!

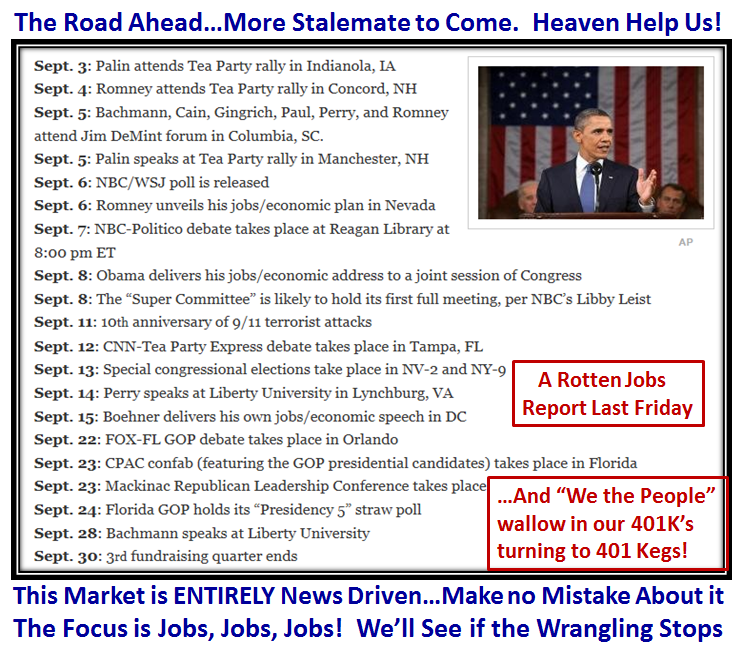
It seems we need two alka-selsa anyway given the calendar of events for this month.  We are in for another dose of the same old twaddle, but we shall see:

Enjoy the long Weekend and keep your chin up is the Sincere Wish of your friend, Ian.


Copyright © 2007-2010 Ian Woodward
Disclaimer: Commentaries on this Blog are not to be construed as recommendations to buy or sell the market and/or specific securites. The consumer of the information is responsible for their own investment decisions.