Ian Woodward's Investing Blog

Archive for the ‘HGS Principles’ Category

Stock Market: Quick Glance Barometer

Tuesday, August 9th, 2011

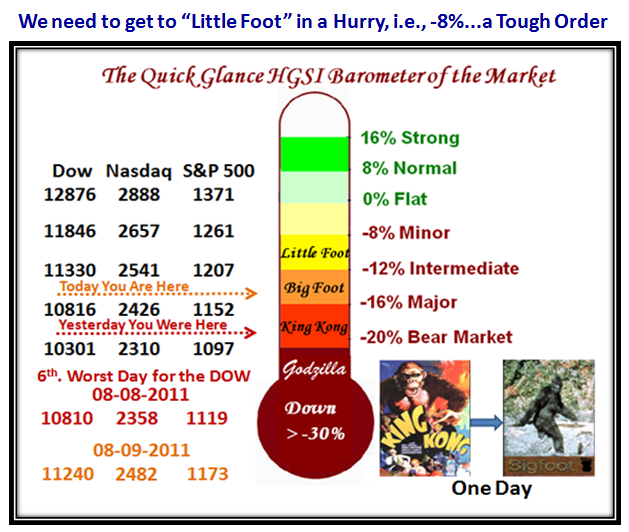
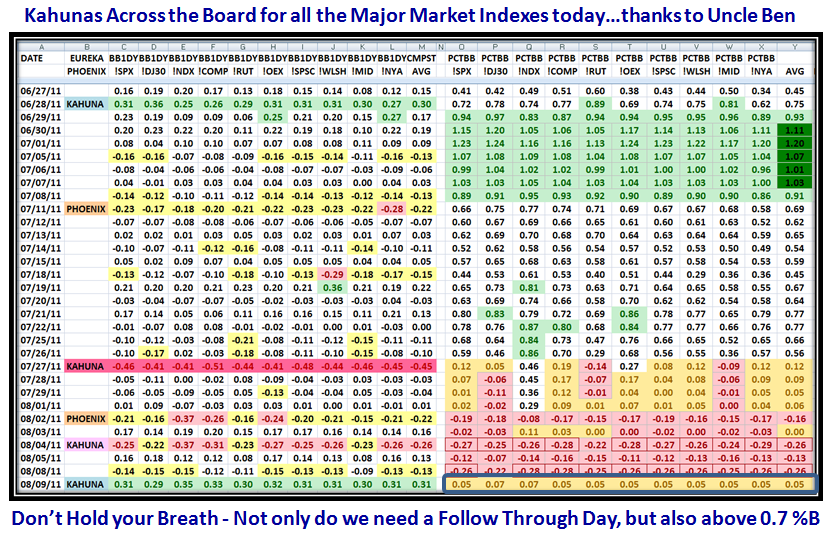
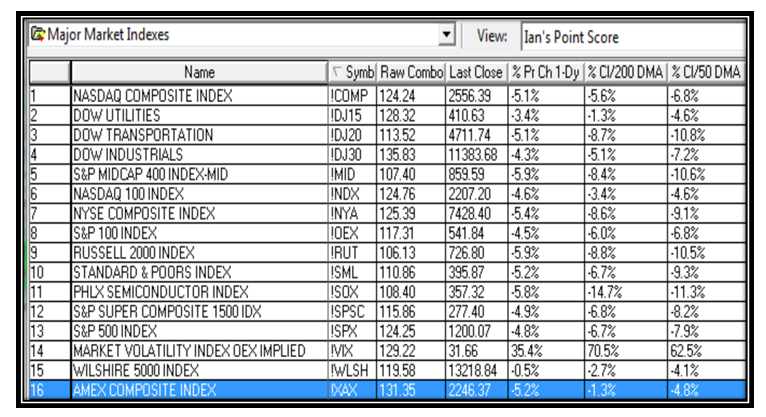
With the Major Market Indexes all sitting at around -18% down or worse, I felt it might be worthwhile to give you the Quick Glance HGSI barometer of the Market.  Yesterday King Kong ruled, but fortunately with today’s sparkling Bounce Play essentially in the last hour we are back to Big Foot!  Enjoy:

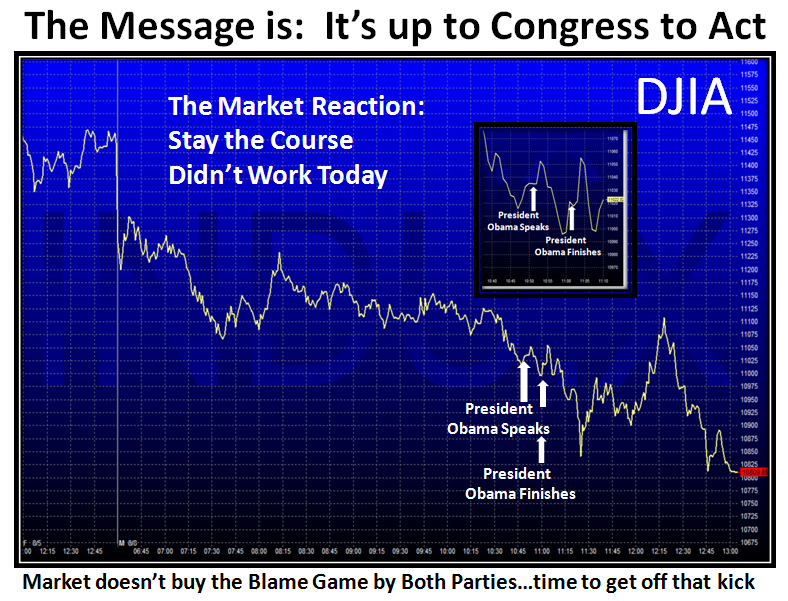
But let’s backtrack to yesterday when the DOW suffered the 6th worst day, where the mood after the Investors had a chance to digest the downgrade of the Credit Rating to AAa over the weekend and left a sour taste and a gloom and doom mood, with investors unloading their securities en masse.  Even President Obama’s assurances to stay the course could not turn the mood around as shown by the next two charts:

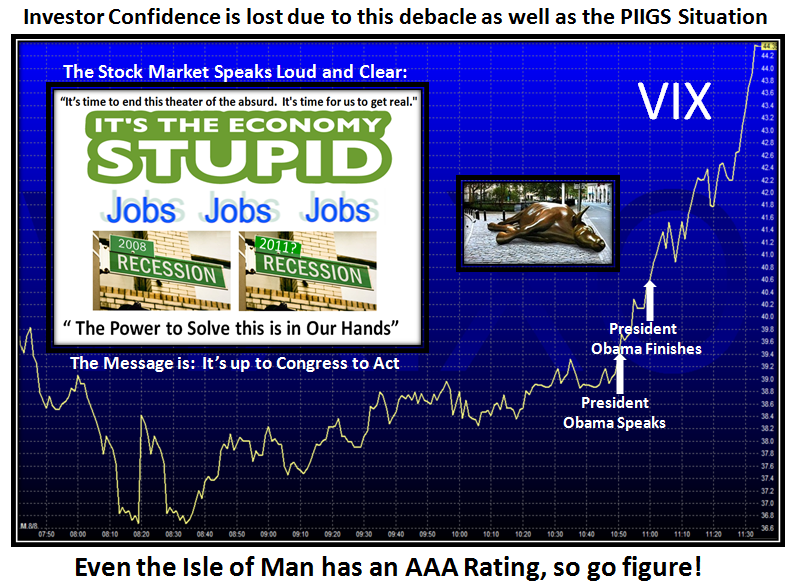
The VIX showed that Volatility was back as it hit over 40 again in a hurry and then some:

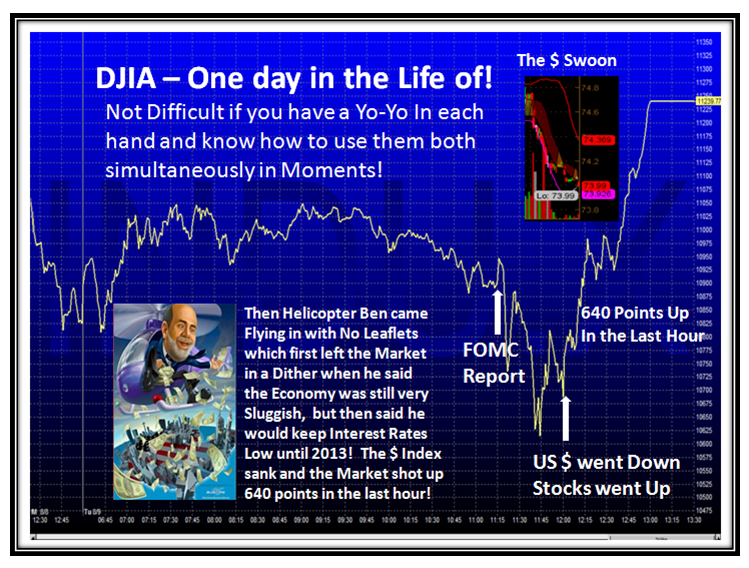
…And then Helicopter Ben appeared today with the FOMC Report with bad news regarding the Recovery of the Economy being slow and therefore more pain for the populace with regard to Jobs.  At first, this sobering news took the market down, but then the re-assuring message was that the intention is to keep Interest Rates low for the next two years.  No leaflets were dropped ala the prospects of a Q-E 3.  However, on second thoughts by the market, the reaction was to take the Dollar Index down and consequently, Stocks took off and our man at the FED became the hero instead of the goat!  Go figure.

In any event this helped “usuns” to breathe a sigh of relief at least in seeing the much expected and touted Bounce Play materialize like a Yo-Yo to drive the Market up for a respectable gain of around 5% all around for most Indexes for the day.

So with the strong Bounce Play, all Market Indexes enjoyed Little Kahunas up today as shown by the next chart.  But cast your beady eyes over to the bottom right hand side of the chart to realize we are still only at the 0.05 level on %B, i.e., just inside the Lower Bollinger Band…so don’t get too excited yet.  Of course we can expect the usual discussions from our friendly Financial Newspaper that this was a turn-around day and we should next look for the Follow Through Day (FTD) to suggest we have a Market in Recovery.  Let me remind you to go back and study the last two charts of the previous blog note to realize that Rome wasn’t built in a day, and you should be alert for the booby traps which invariably occur at the expected resistance points, be it with Fibonacci, Cycles, or just plain support and resistance levels.

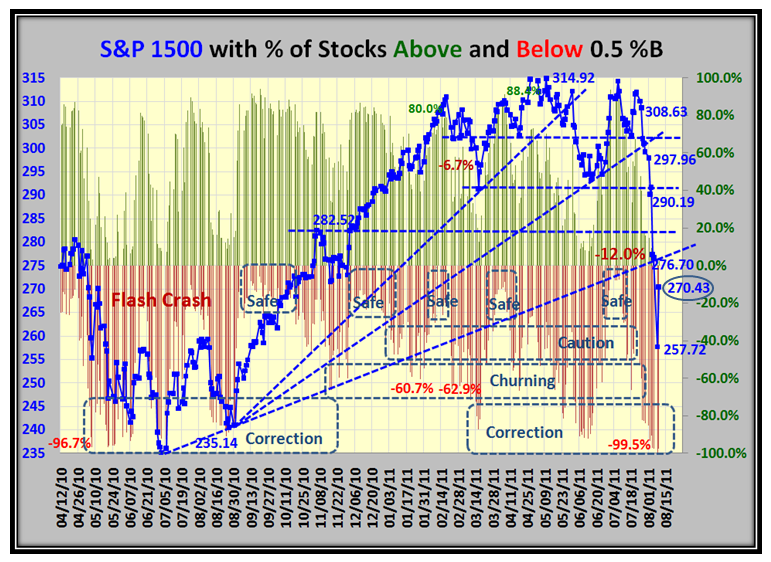
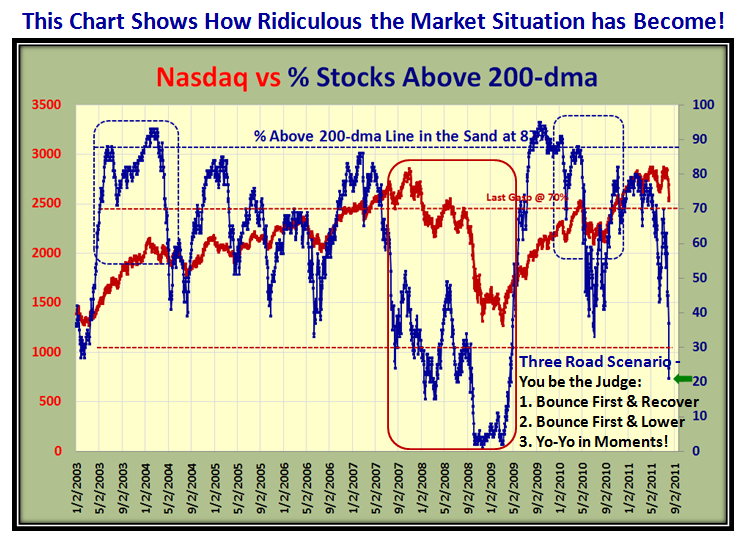
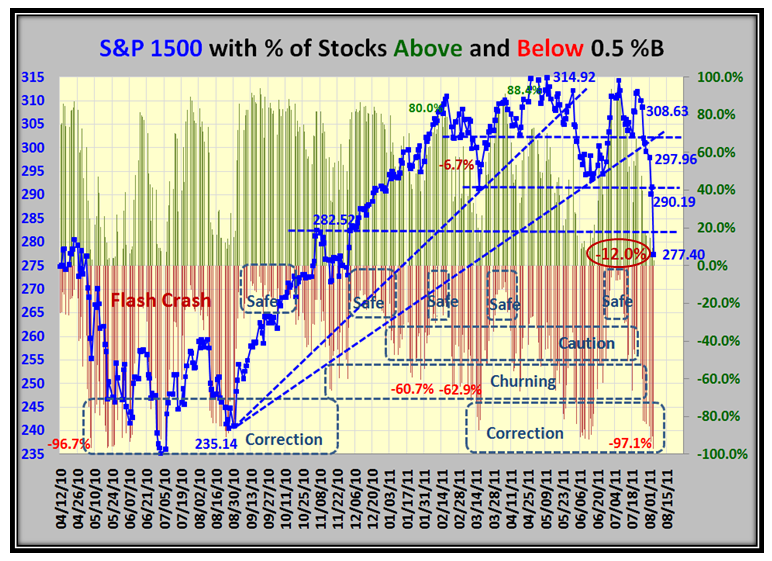
So having looked at %B for the Indexes, now let’s see what the % of stocks above and below 0.5%B looks like at this stage of the game…disaster:

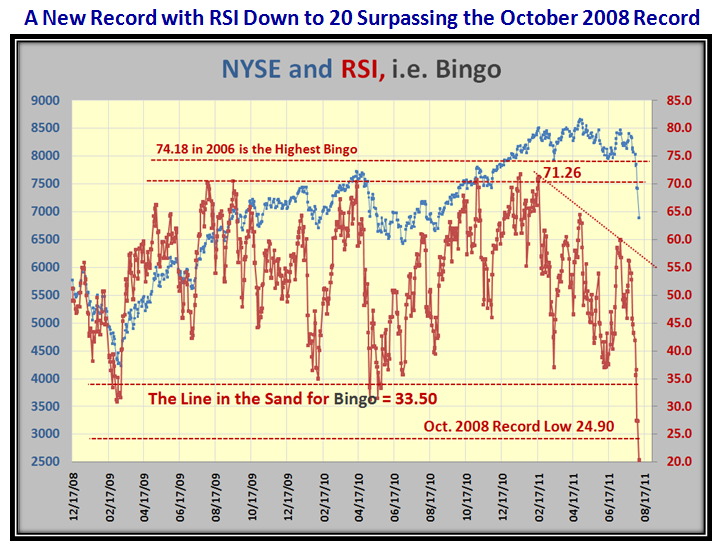
Now then, let’s see the extent of the damage with the likes of RSI, which gives us a measure for “Bingo” using the NYSE.  The picture speaks for itself and as you would expect, we reached the lowest level yet recorded during this period since Black Swan days in October 2008, beating it down by a college mile:

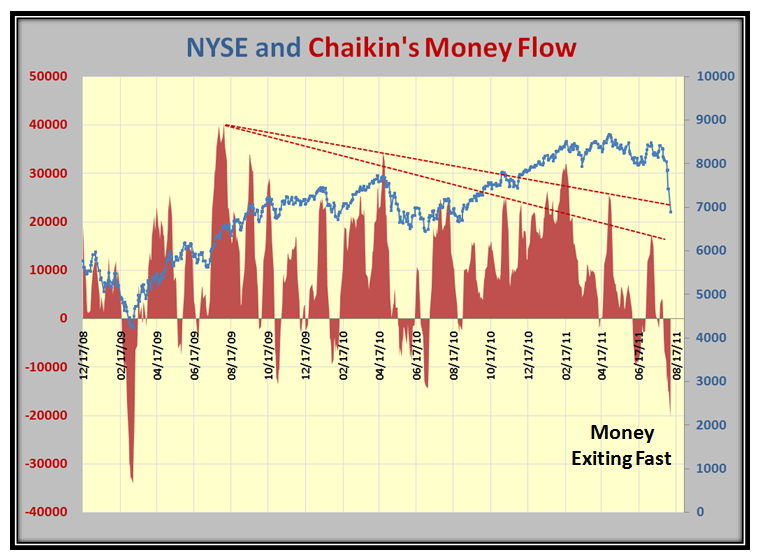
…And as you would expect, Money is flowing out of the Market fast:

More of the same:

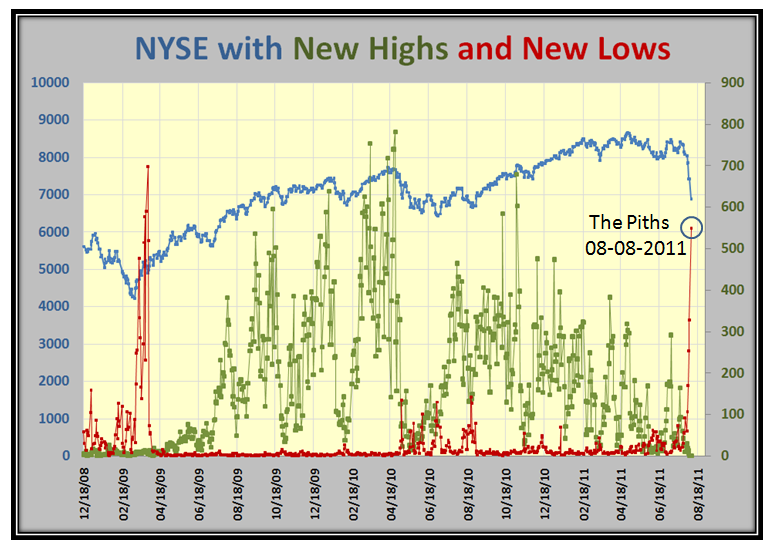
…And as you would expect, the New Lows are now reaching to the stars:

So there you have it.  Type 1&2 Traders sharpen up your Yo-Yo skills and Types 3&4 relax in the sun.

Best regards, Ian.


Credit Rating Downgraded Dampens the Bounce Play

Saturday, August 6th, 2011

It’s no news that the Stock Market is already in the toilet, but now even the chance of a decent Bounce Play from a very Oversold Market is overshadowed by the US Credit Rating being downgraded to AAa.  In any event, Markets seldom recover from V Bottom’s unless they start from less than Minor Corrections of-8%, and that invariably when the market is starting fresh rallies and not going through the topping process we have seen for the past four months.  We have only to go back to the Flash Crash of 05/04/2010 to see that with a similar oversold situation it took several attempts and “fakey’s” to finally get out of the mire after four months by 09/01/2010.

My good friend David Steckler suggested I make a Headline change to the Picture below…so with tongue in cheek, his wish is my command!  See if you can spot it, but with what appears to be ahead of us this week, it fits the bill:

Many of you have responded to encourage me to keep up the good work and so I felt I should capture this moment in history to show you the value of what I see in using Bucketology to “Harness the Market with %B” at this critical juncture.  Here is a synopsis of what I believe are the key values:

The concept of Bucketology, i.e., dividing the range of Bollinger Bands %B into 12 slices and measuring the number and/or Percentage of stocks that sit in each slice or Bucket as we call it for an Index, a User Group of Stocks or ETF’s,  lends itself very well to my insistence of having three scenarios as a Market Plan and then letting the Market tell us which road it is on…the High, Middle or Low Road.  Numbers are fine, but a Picture is worth a thousand words and when one can have both, life becomes far easier to manage the analysis and synthesis of the Market:

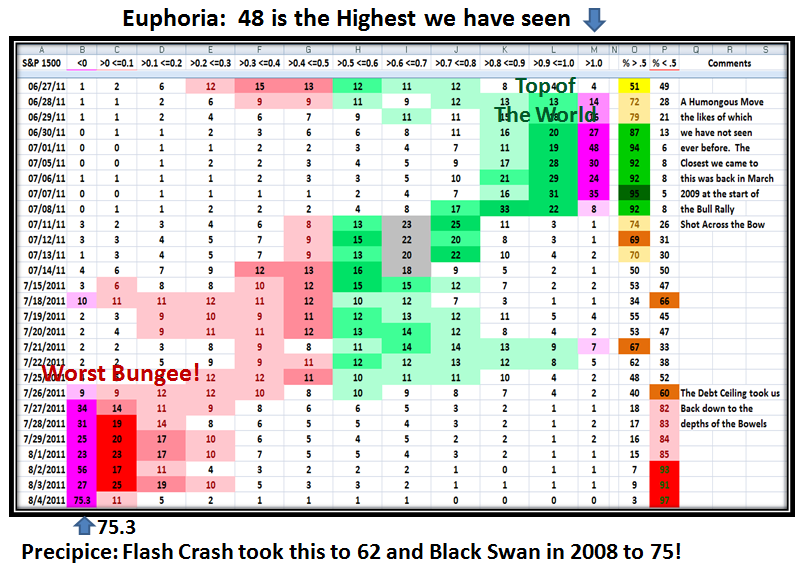
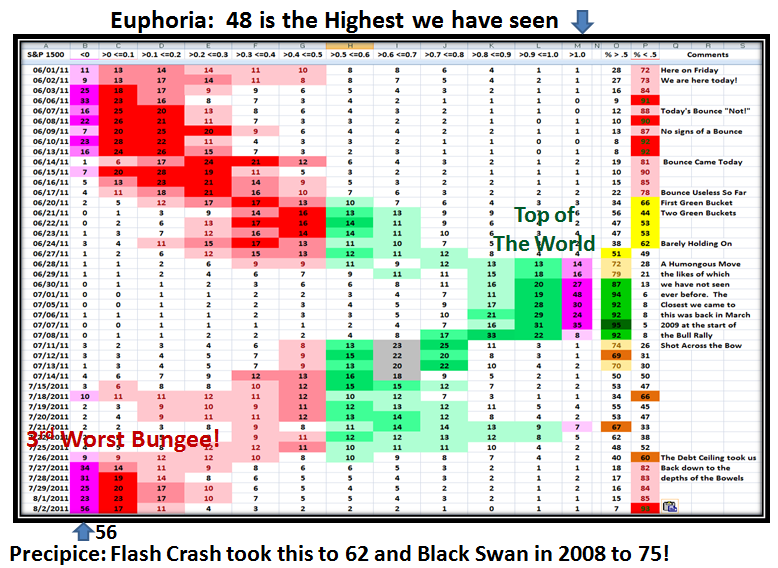
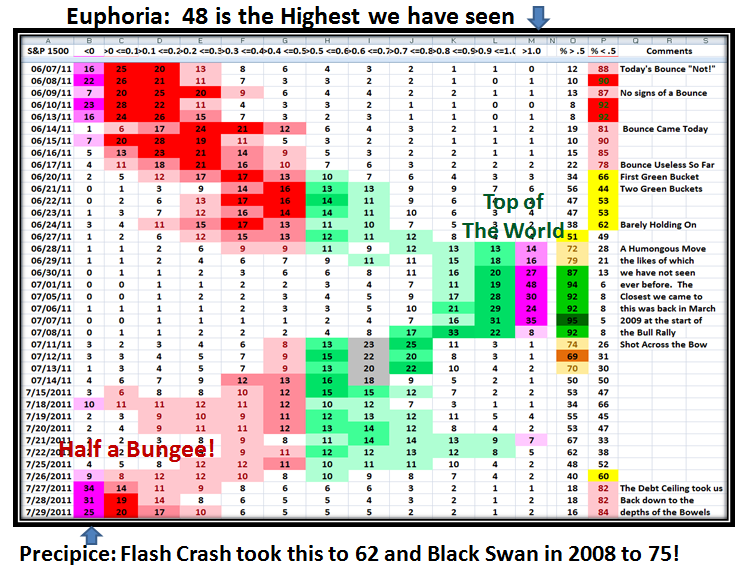
I use the S&P 1500 as the basis for most of my analysis, but as you well know I also use ten key Market Indexes in my work.  I have updated the following chart right up to yesterday so that you can see how the numbers change as the days roll by.  The color coding of red and green gives you the quick demarcation between below and above the Middle Bollinger Bands of 0.5, respectively.  The numbers in this case are the % of S&P 1500 stocks that sit in each bucket on that day, as the Market ebbs and flows back and forth in its cycles from low to high and back again:
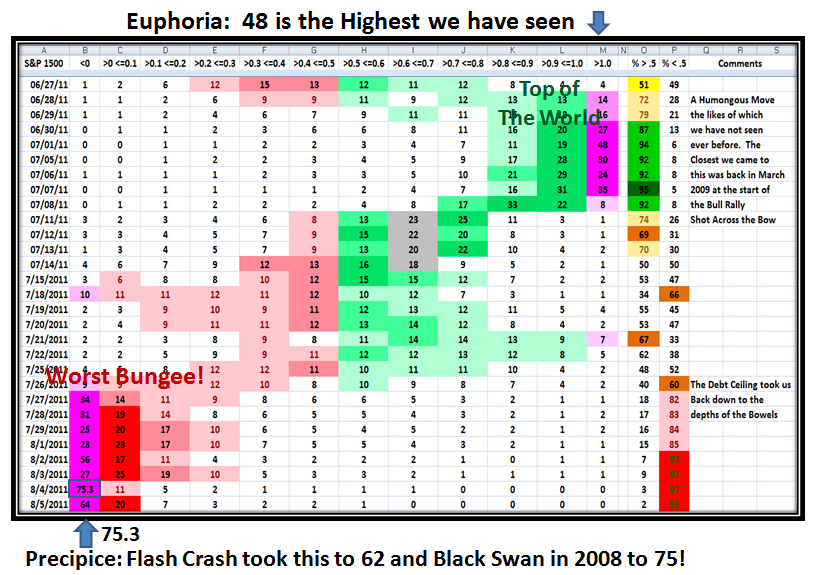
These extremes are seldom seen especially when we were at the highest momentum ever recorded on July 1 with stocks above the Upper Bollinger Band of >1.0 and the % of stocks reaching a peak three trading days later on July 7th. with a Score of 95 for Stocks above 0.5%B.  Just one month later we find the Market down in the bowels of despair, with yet another record of 75.3% of stocks with %B <0, below the Lower Bollinger Band.  It doesn’t take two seconds to see that the Markets are totally trashed by “Grandma’s Pies” and the numbers side by side:
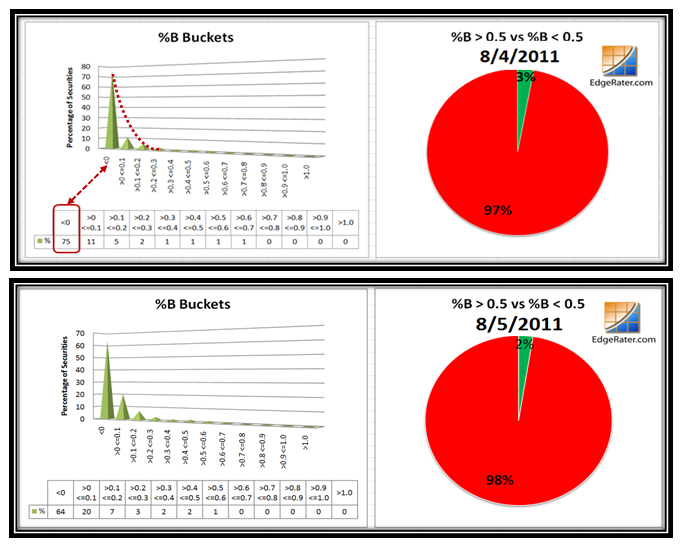
As we well know, Friday gave moment traders fits and starts with the moment to moment swings in the direction and magnitude of the moves all day, particularly on the Dow Jones Industrial Averages.  Although there were attempts all day to produce a Bounce Play, it can be chalked up as a pip-squeak although there was some movement from <0 to bucket >0 <0.1 with 75% to 64%, respectively, by bottom-fishers buying beaten down stocks.

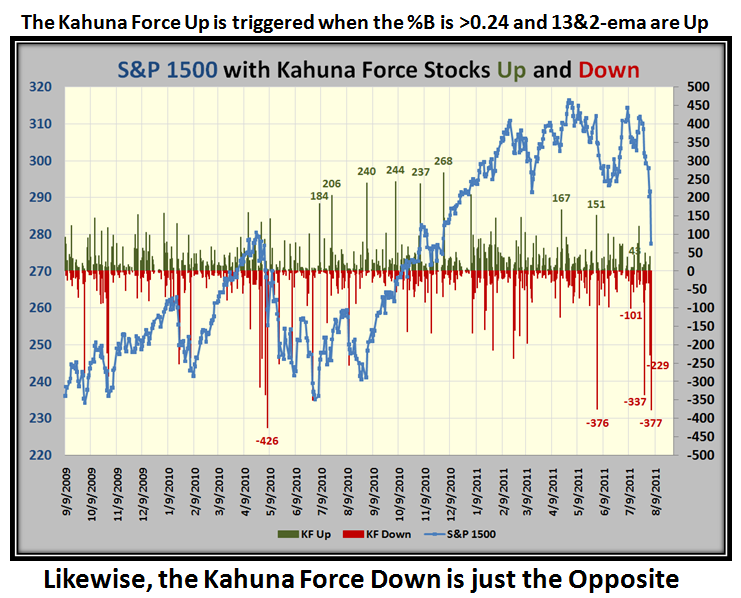
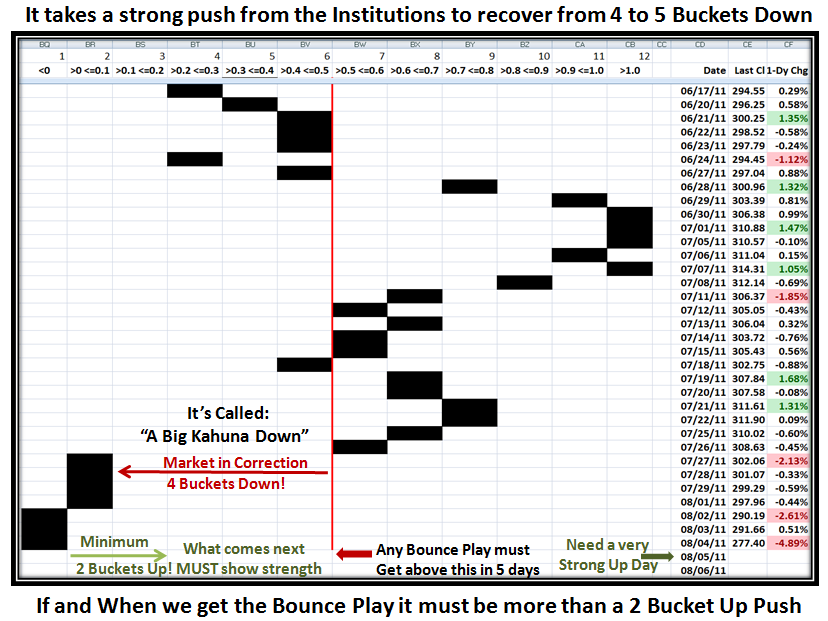
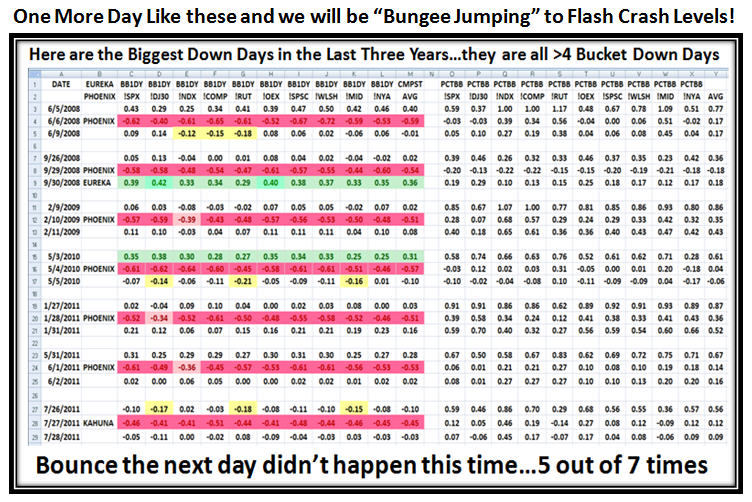
Sad to say that the news at the weekend of the downgrading of US Credit Rating by Standard and Poors will add more turmoil and pressure to the markets and could even squash any immediate attempt to give a decent Bounce Play with good momentum.  Here for the record are the Kahunas both up and down for the last three and a half years.  The message is at the top of the chart, but for emphasis it is worth repeating…Note that 4 to 6 Buckets Down signals a major change in Market Sentiment, and that it is most unlikely the Market will recover anytime soon:
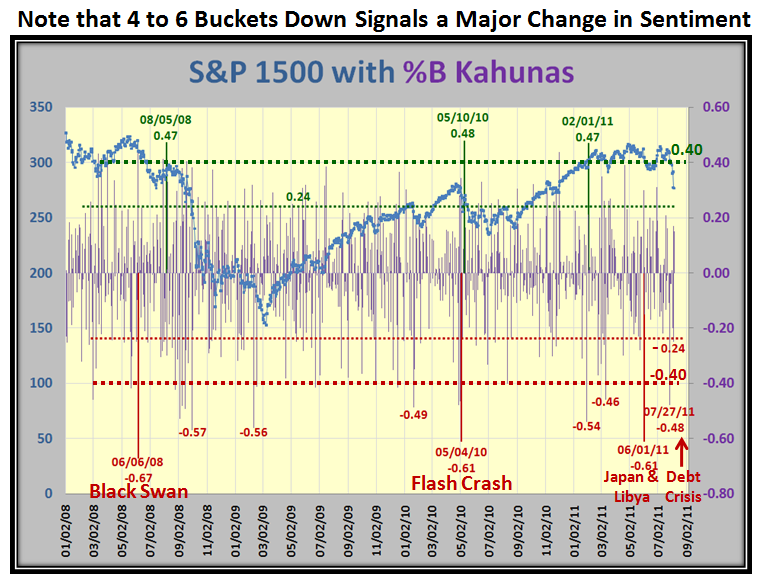
Please understand that there are two types of %B you should track…one related to bucketology for the Stocks in an Index as I have shown above in several different charts, and the other the %B of the Entire Index for the S&P 1500.  They are different and as I have shown you many times before on this blog the difference betwen the two, which I call the “Purple Chart” is very illuminating.

The next two charts relate to %B of the S&P 1500, one for the Flash Crash and the other right now for the Debt Crisis comparison:
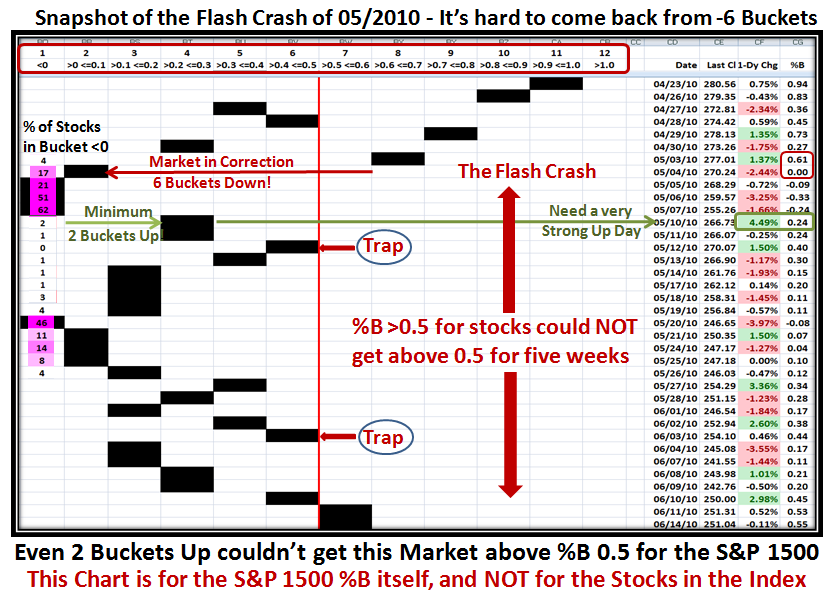
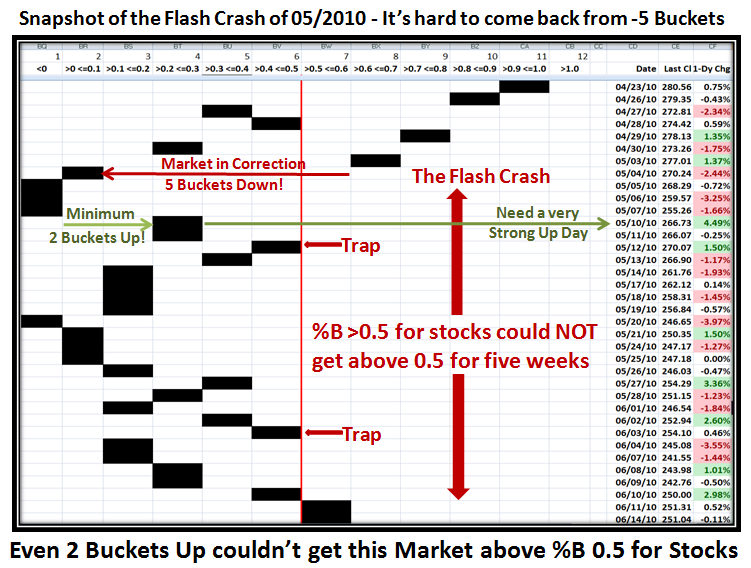
I have updated the chart I showed previously, and point you to the last column which shows the %B reading for each day.  You will note that the Flash Crash took us from a reading of 0.61 to 0.00 in one day…in other words a six bucket drop, which is depicted by the Black bars dropping from and to their respective buckets.

The second thing to note is that I have superimposed the % of stocks in the first column.  Note that immediately after the 62% of stocks on 05/07/2010, the very next strong up day lifted all stocks to give just a meager 2% in that column with a 4.49% gain in the S&P 1500 Price.  You will also notice that within three days the %B had risen to 0.40, and immediately fell back, essentially with very little lift off…a TRAP!  It didn’t take but six trading days before the Index was down in the dumpster.  Also note that the second attempt also found itself trapped and as I mentioned before it took several Fakey’s before we had a fresh rally starting on 09/01/2010.

This next chart shows the pertinent flow for this recent peak and valley we are currently in.   The chart shows the key PROBLEM with nearly FIVE Buckets down from 07/26/2011 to 07/27/2011 for %B of the Bollinger Bands, in ONE Day.  It was a humongous drop and was the signal to get out fast! That is tantamount to the Institutions and the Herd trampling over each other to get out of the Exits.
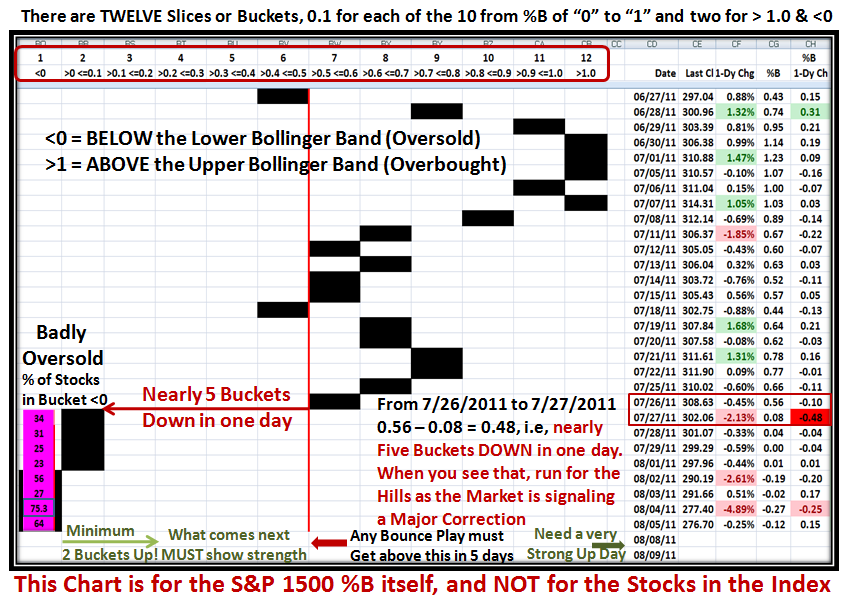
Likewise, you need a decent number of bucket skips to the upside to ensure you have the momentum and the wind at your back.  However when the Market is trashed as it is now with 75.3% of all S&P 1500 stocks sitting <0, below the lower Bollinger Band, the tide is completely out and all boats are stuck in the mud until there is a sea change in the EMOTIONS of the Market, with the tide coming back in and the wind at your back to raise all boats.  It takes several attempts to get back to a normal market, and so you must expect TRAPS along the way as I showed in the similar Chart for the Flash Crash.  It is most unlikely we will get a “V Bottom” with the market so badly trashed.

So there you have it all in one place as to how the Bucketology concept provides the instantaneous reaction to Market Fluctuations, and that it brings into focus of what to expect in the Ebb and Flow of the Market at its extremes for useful clues to call you to action.

Best Regards, Ian.

Stock Market: Biggest Bungee Jump Yet on %B Below “0”!

Thursday, August 4th, 2011

The hour is late and I can see that there are a lot of you giving me support for my work, but I am now in overload.  Anyway, this may help some of you tomorrow to have an update tonight of exactly where we sit with regard to the Market.  There are several messages in the following dozen charts so you will have to plough through them carefully.  Moment traders are even finding it hard to stay on the right side of the market.

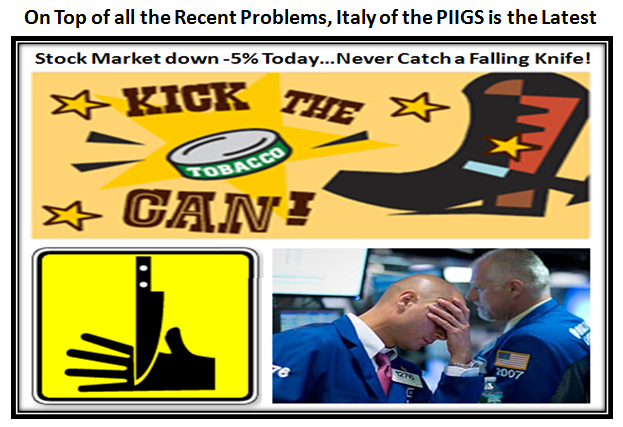
Of course there are many with ants in their pants who are itching to catch the bounce play, but be careful you don’t get cut by the falling knife syndrome:, especially as we have the jobs report tomorrow:

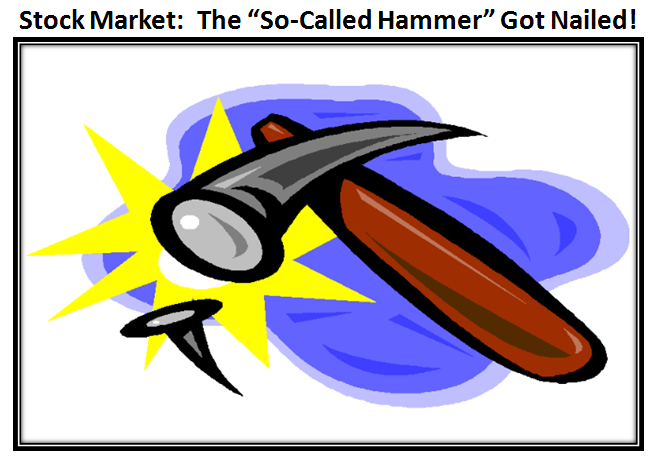
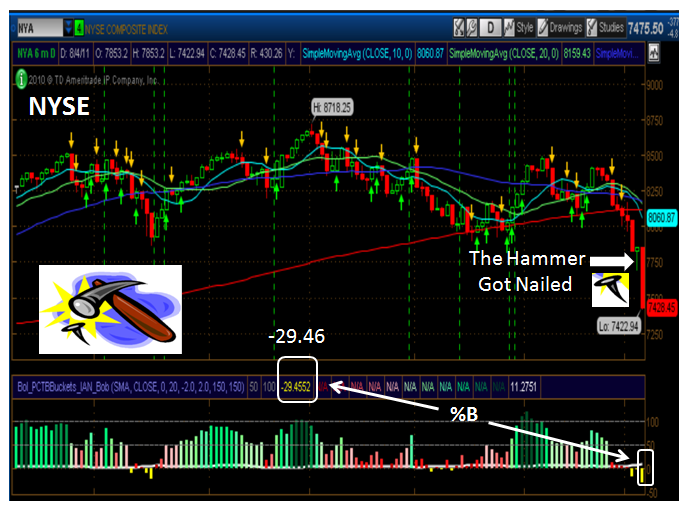
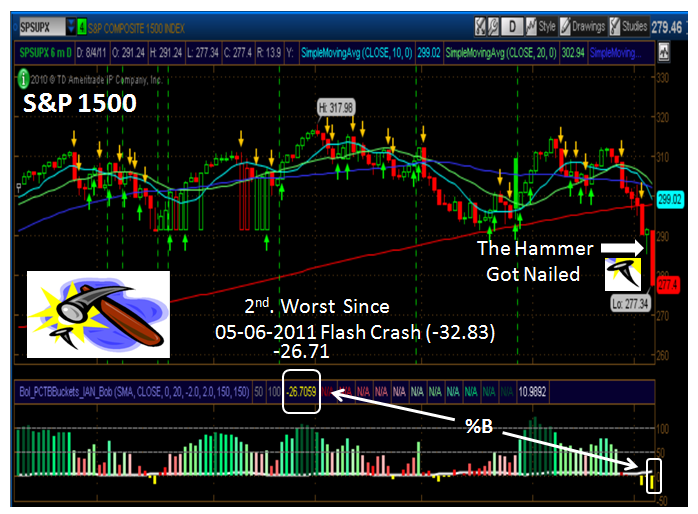
I couldn’t resist another picture to capture what was a technical point gone haywire when the “hammer got nailed” today:

…And here are two examples to show you what I mean using the NYSE and S&P 1500 Indexes, respectively:

These low numbers are seldom seen for %B, so make a note for the future:

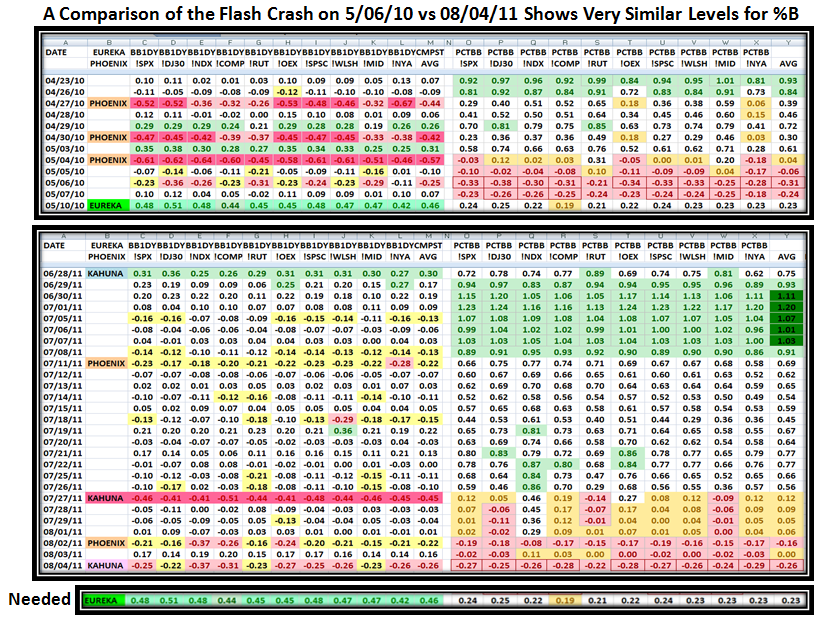
Always use a Stake in the Ground and a Measuring Rod:  Here is a Comparison of the Flash Crash and Now.  It doesn’t take two minutes to realize that when a market is this oversold the Bounce Play is around the corner, but it has to be robust to lift the Market off the bottom:

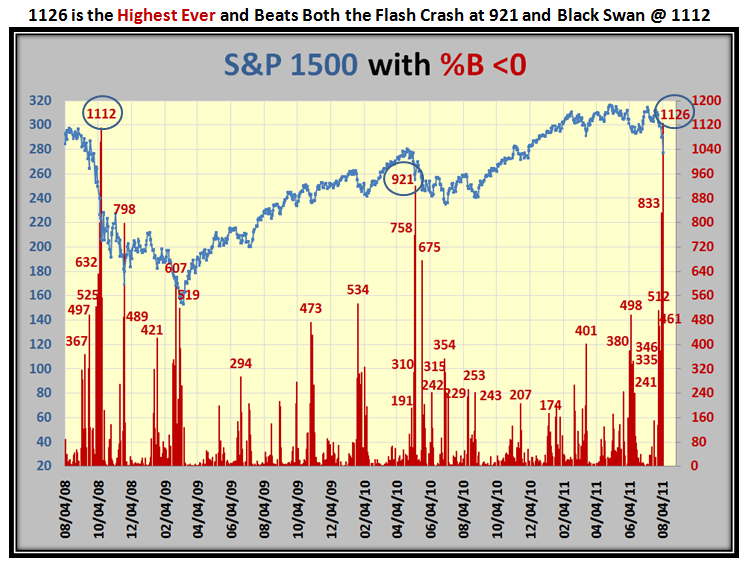
Now this chart is an eye-opener…The number of S&P 1500 stocks with %B <0 is the highest on record…so that will give you a feel for how deep this correction is at already, although it is only down ~12% or Intermdiate Correction level:

Here is a new one for you…Ron and I call it the Kahuna Force, and the criteria is explained on the chart below:

This next chart is a favorite of ours and shows that again we are as oversold as the Flash Crash numbers and are -12% down from the high:

…And this chart confirms the biggest Bungee Jump on record, surpassing both the Flash Crash and Black Swan:

When we have a 4 or 5 Bucket down day, it always sets the stage for a Correction.  However the return path is slow so be careful not to be caught in a Fakey as shown in this Flash Crash slow come back that produced several traps along the way.

…And here is where we stand right now.  Don’t forget we have the Jobs Report tomorrow:

The challenge to fight the resistance is a lot tougher after today as we can see from this next chart.  It shows the distance from the 200 and 50-dma and since few Bounce Plays provide more than about a 5% up move within 5 to 7 trading days, we can set the immediate targets to get over these natural resistance levels that all Technicians watch.  In addition, if you put up Fibonacci levels from the Recent Base Low around 9/01/2010 you will see that we are right at the 50% level, so use that as a guide both up and down from there:

I like to have your feedback so spend a moment and make a comment if you find this of value to you.  Better yet, tell your friends to visit my blog!

Best Regards, Ian.


Market has Spoken on Kicking the Can Down the Road

Wednesday, August 3rd, 2011

Those of you who follow my blog faithfully know that I never discuss politics here, or in our newsletter, or in the seminars…this is an investing blog not a political one.  However, you also know that trying to understand the IMPLICATIONS of political actions relative to the stock market next actions is important.  It is with that in mind that I write this blog, but as I have always said “Have three scenarios, and then let the Market tell you which one it is on.”

Dr. Jeffrey Scott is holding an HGSI Webinar tonight and I am sure there will be much discussion on how to use the tools to look for any clues of which way the wind is blowing, so this blog note written in haste will present more questions than it will provide answers!  Once the dust settles, I will continue to provide the three Scenarios, but for now there are no Highland Flings in sight for the bulls!

Yes of course we should expect a Bounce Play from an oversold market, but right now the market is in deep yogurt as my good friend David Galardi reminds me with this picture which he sent me:

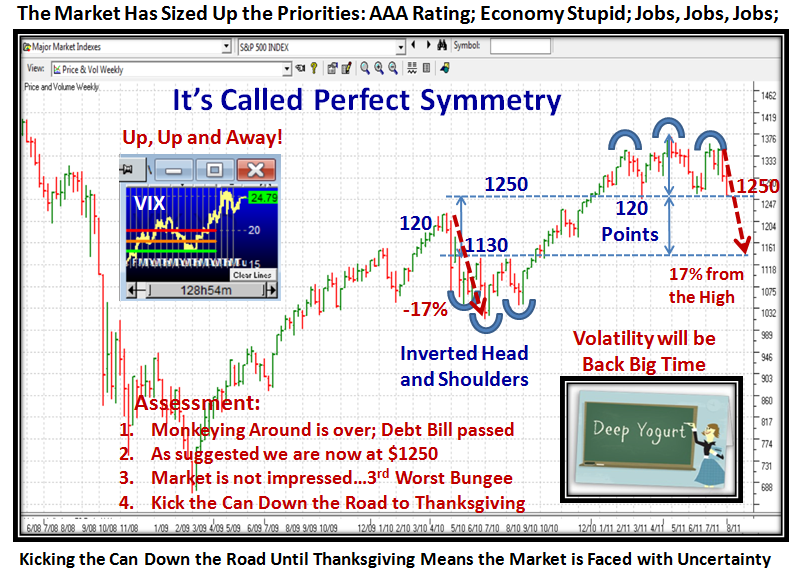
To continue the thread of the last few blog notes, here is the updated picture of the “Perfect Symmetry” chart, and at least the first suggestion I made that we were headed for 1250 on the S&P 500 has come and gone.  Now the $64 question is whether we get the Bounce here or continue on down to hit Flash Crash proportions of a 17% correction as the natural next line of support to complete the symmetry:

By the way, please digest the updated lines at the top and bottom and my Assessment which are all on this chart for posterity sake.  The last line finishes with “Uncertainty”.  Uncertainty begets Volatility. The Grinch will be back in full force sooner rather than later.  But always let the market be our guide as to which road it is on.  There is a distinction between short-term Type 1&2 traders and longer time Type 3&4, and that is what must be kept in mind as we digest and search every nook and cranny for clues of which way the wind is blowing. “When it’s at your back, Attack; when it’s in your face, Disgrace.”…but that is exactly what the moment traders are good at.

Would you believe it, the Bounce Play has already begun while I am at this point in writing the note, 10.40 am PST…well that is no surprise.  But let me not digress and show you for the record that the oversold situation in Bucketology Terms has delivered the 3rd Worst Bungee jump we have recorded, with only the Flash Crash and Black Swan era being deeper, as shown on this next chart:

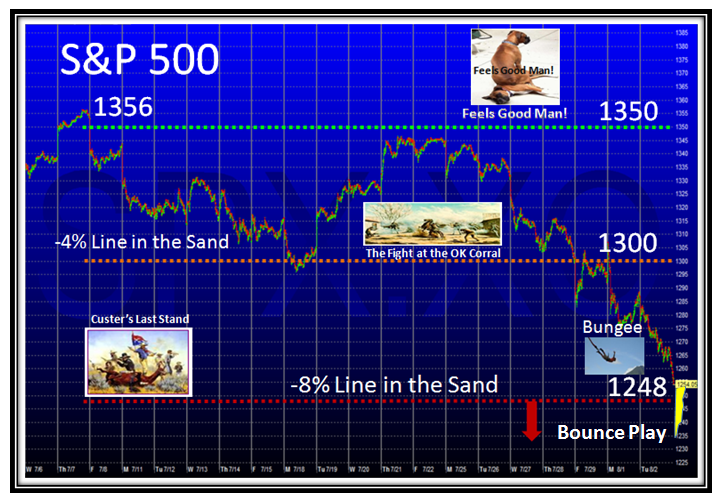
The next slide is the “Custer’s Last Stand’ and “Feels Good Man” Slide which my readers get a kick out of, especially the latter which my good friends Chris Wilson, Dave Baratto and Maynard Burstein always say they enjoy.  A heads up to them too as they all get together for their monthly meeting lead by Maynard in San Antonio, tonight.

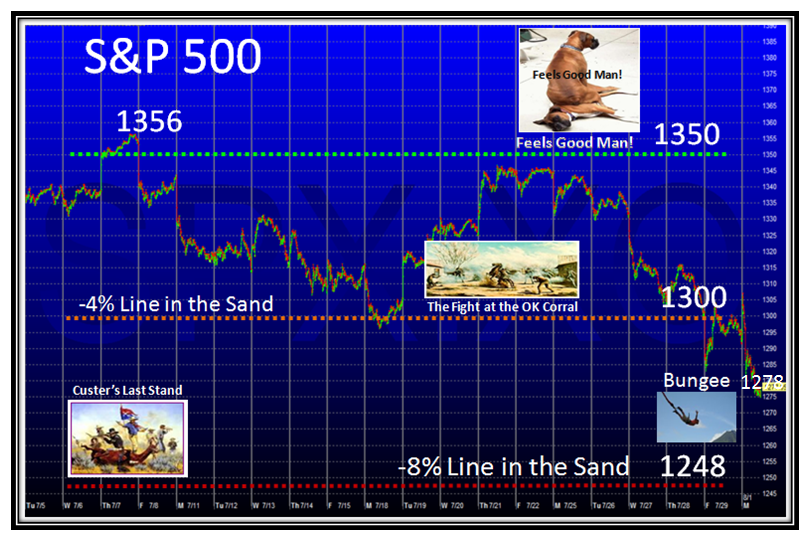
True to form, this is out of date as I prepared it last night, but note that it broke the -8% Line in the Sand today dropping to 1235, and as one could expect, the Bounce Play was on. I just updated it in yellow for the Bounce that is now in progress.   Now its simple to measure the quality of the Bounce and where to expect the “Fakey”!  1300 gets us back to the -4% Line and is the fight at the OK Corral, and don’t hold your breath for 1350 to “Feel Good Man”.  Always have THREE SCENARIOS and let the market tell you which one it is on:

Now comes the “Coulda, Shoulda, Woulda” second guessing with ants in your pants for type 3’s and 4’s.  I’ve just shown you where to expect a Fakey, but of course if you want to play like a Type 1, then the longer you wait the more you get left at the post.

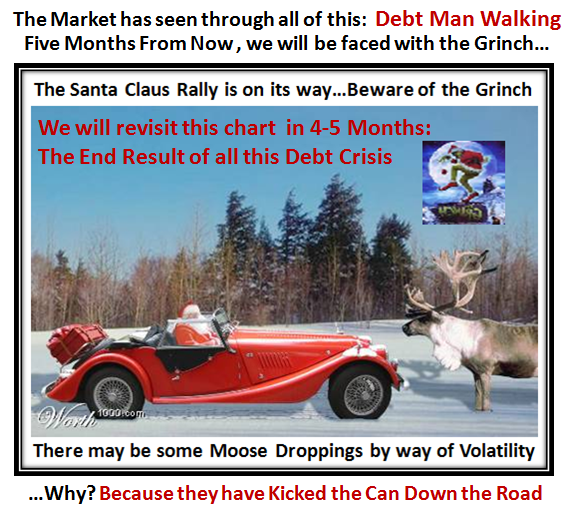
However, my mind is not on this short term mumbo jumbo right now.  Rather I want to leave you with two old pictures which are most appropriate at this writing.  They both go back to the gloom and doom era of Black Swan, but I submit that they are worth tucking in the back of your mind for when we get around to Thanksgiving time and the Volatility we can expect from the uncertainty that the recent actions have caused to the Market.

As you well know, I am a Glass Half Full Type but I have always given you fair warning of the other side of the coin, so in the spirit of leaving you with how that scenario can develop over the next six months, here are the two slides with no further commentary other than to mention that David Galardi reminded me of the second one:

Good Luck to you all, and may the Kahuna Force be with you whatever you decide.

Best Regards, Ian.


“Bungee Jump” Stock Market

Monday, August 1st, 2011

Last night the Futures were up strong, the Market opened up and then slid for another Bungee Jump.  We are only 30 S&P 500 points from the -8% line in the sand, then it’s left in the lap of the gods.  We need a $5 Trillion Coin to solve the problem:

As the caption says on the next chart: One more Day like these with a big sell off and we will be “Bungee Jumping” to Flash Crash levels:

We are currently sitting with 25% of the S&P 1500 stocks in Bucket <0 (Below the Lower Bollinger Band).  It won’t take much to drop this to Flash Crash levels of 62%, and then Heaven help us if we swoon to Black Swan Days of 75% should this all blow up in our face.  However, with the Market so oversold, we can expect a Bounce Play if this Debt Crisis is resolved by tomorrow, particularly since the Institutions have not opened the floodgates to the downside yet:

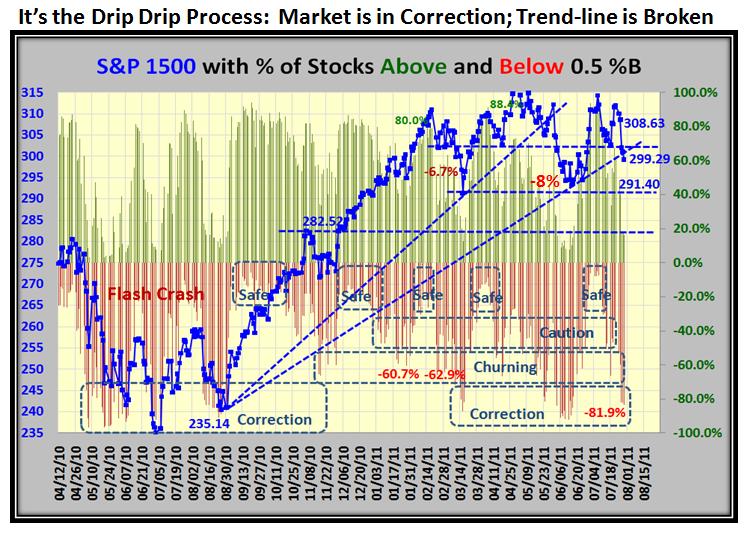
So far we have experienced the drip, drip process of a Market in Correction; the one-year trendline is now slightly broken to the downside, but with all the kerfuffle on the Debt Crisis the market is only about 6% down from its recent high.  Fortunately the Earnings Reports have been rather robust with over 72% beating Analyst Estimates.  This is particularly good when the likes of GOOG, IBM and AAPL all come in with strong reports:

The bottom line is that the Bears can turn on the floodgates spiggot if we drop another 30 points, while the Bulls have to wait for 72 points higher before it “Feels Good Man!”

Good Luck to us all…we need a bit of it these days.

Best Regards, Ian.


Copyright © 2007-2010 Ian Woodward
Disclaimer: Commentaries on this Blog are not to be construed as recommendations to buy or sell the market and/or specific securites. The consumer of the information is responsible for their own investment decisions.