Ian Woodward's Investing Blog

Archive for the ‘HGS Principles’ Category

The QID:QLD Revisited

Monday, November 2nd, 2009

Question:  thanks…so the QID is short the NASDAQ x 2 and the QLD is long the NASDAQ x 2. The ratio of 3.3 to 1 needed to signal capitulation means that 3.3 times higher volume (or is it dollar value) in the QID (the short one) is the telltale sign things are turning to custard big-time?  Have I got that basically correct?

And conversely, if the QLD (long NASDAQ x 2) is showing only 1.5 to 1 higher ratio vs. the QID then it is time to buy again…

And not having heaps of time, a glance every day at the volume of these two ETF’s will give a glimpse of the underlying behaviour of larger market participants to indicate possible market direction?  Kiwi Keith

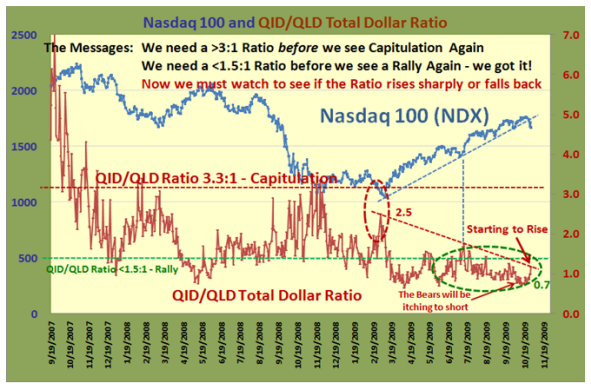
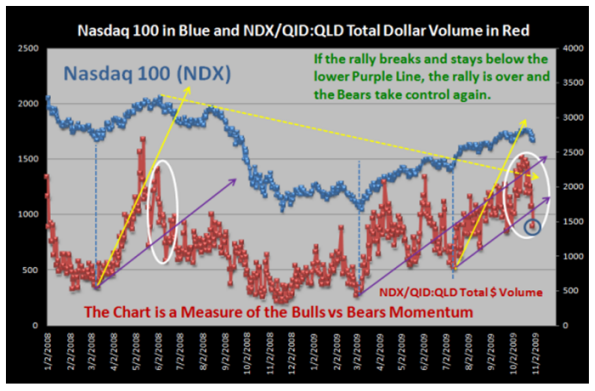
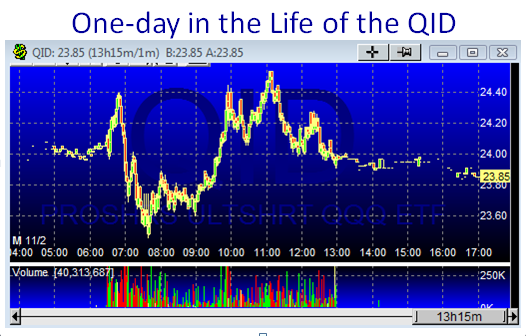
Answer: Kiwi Keith:  Now you’re cooking, you have it close enough for government work.  But let me make sure you know exactly what is involved.  Let’s take a specific case like today to show you what you are looking at in the “Green and Yellow” chart on the previous blog, and why Maynard and I feel it captures the relationships between the two regarding which way the wind is blowing in the MARKET! 

If you trot over to Yahoo Finance and type in  the QID and QLD you will get the following numbers:

           Date        Open    High    Low    Close      Volume          Cl x Vol         Ratio
QID 11/2/2009     24.13   24.54  23.46  23.97      40,304,907    966,108,621    1.182
QLD 11/2/2009     47.81   49.12  46.97  48.08      16,996,844     817,208,260

The second last Column is the Close Price x Volume for each. 

QID/QLD Total $ Volume Ratio = 966,108,621/817,208,26 = 1.182

NOTE! If your numbers are slightly different sitting in sunny New Zealand, don’t worry about it…it’s close enough for gov’t work.

What concerns me is that although you have it pegged right that 3.3 times means “custard big-time”, that happened back in November 2008, and it is important to undestand WHAT it takes to get to that ratio.  It is a totally different state of affairs than now and the numbers back on 11/12/2008 just 10 days short of a year ago looked like this:

            Date         Open   High   Low    Close      Volume           Cl x Vol          Ratio
QID  11/12/2008    76.87  81.80  76.11  81.40      49,680,200      4,043,968,280   3.388
QLD  11/12/2008    28.14  28.45  26.22  26.39      45,231,000      1,193,646,090

Big Difference…and let’s hope we don’t see that again during any correction we might have going forward.  My point is that you will know full well when the Market is falling apart long before we see a number like that.

“And not having heaps of time, a glance every day at the volume of these two ETF’s will give a glimpse of the underlying behaviour of larger market participants to indicate possible market direction?”

Now you are on the ball and almost correct.  If you cast your beady eyes on the price of the QID and QLD, you will see the price difference is 2:1 in favor of the QLD at this time.  Since you don’t have heaps of time, all you have to do to see which way the wind is blowing is divide the QID VOLUME by 2 on the day and if it is running higher than the QLD volume, you know that the ratio is >1 and if lower, then the Market favors the Bulls with the ratio <1.  Otherwise, do the math as shown above.

But Kiwi…life is not that simple, especially for Type 3 people like you.  Since you do not have time to watch the market all day long, the INTRA day swings are humongous right now.  There is a 4% swing from Low to High and the QID essentially finished flat…16c between the open and close is no biggie. 

              qid 

I sense you have lopped onto the “twofer one” of the QID and QLD, and gambling types are playing “threefers” which is the whole attraction of these ETF’s.  A Type 3 playing with Type 1 toys gets slaughtered unless they are nimble.  These are primarily short-term instruments unless you call the Bottom and the Top precisely:

          wc

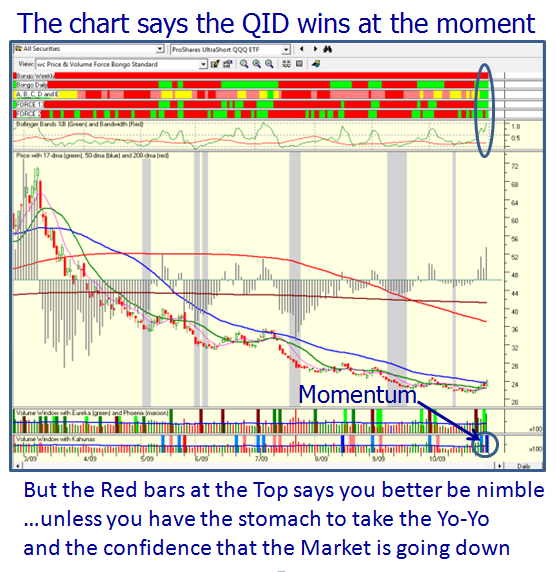
I hope that clears up your questions and that you are understanding the value of the above chart to keep you on the right side of which way the wind is blowing in the Market.  So much to learn, so little time.

Best Regards, Ian.

The Forgotten Key Target!

Sunday, November 1st, 2009

My good friend Maynard reminds me that in my last blog I forgot to mention one key target that has served us well in the past.  Since Cricket has eleven players, here is the 11th Man to keep an eye on in this tug-o-war between Bulls and Bears.

cricket

In this modern day and age with the advent of ETF’s, one measure of the fight between Bulls and Bears is to watch the relationship of the Nasdaq 100 (NDX) and the QID/QLD Total Dollar Ratio.  Here are two charts that I have shown in the past and I am sure it may give us a feel for who is winning by watching these two views this time:

green

1.  Note how quickly the QID/QLD Total Dollar Ratio rose rapidly from 1.0 to 2.5 as the NDX bottomed back in March 2009. 

2.  Then see how the ratio has remained dormant essentially below 1.5 for this entire rally, except again in mid year when all the Market Indexes swooned about 9% from High to Low.  Note the dotted vertical blue line which shows that when the Bulls gained control again the ratio which had risen sharply fell back below 1.5.

3. Now once again, the Bears are rising from the ashes with the lowest ratio reaching 0.7 and ominously touching the down-trend-line from last March.  The Target to watch is two fold; a) break above the line , and b) head rapidly for a reading of 1.5 for the Bears to win or fall back rapidly for the Bulls to gain control again.

I’m sure you are saying “That’s all well and good, but I can’t keep track of these factors; life is too short, Ian.”  You don’t have to, as I am sure what caught Maynard’s beady eyes was that the VOLUME on the QID on Friday rose to nearly 41 million shares, while the QLD by comparison had a paltry 18 million.  The day previous the volume was 23M and 11M, respectively, but what we need to do is just keep an eye on the day to day volume more so than the price change at this stage of the game to see which way the wind is blowing.  We must recognize that these instruments are also used as a hedge for one’s portfolio, but let’s see if this item can help us.  Incidently, the last time the QID volume was above 41 Million shares was on July 23rd when it hit nearly 50 Million shares while the QLD was at 19 Million. The QID lost ground after that and the Bull Rally continued until now.

black

This one is more “loosey-goosey” where we divide the NDX by the QID:QLD Total Dollar Volume.  However it has broken the lower trend line though not convincingly.

Best regards, Ian.

Gone Fishing – Are you the Trout or the Fly?

Saturday, October 31st, 2009

When the Market goes into oscillation as it did last week, many just throw up their hands and go fishing.  However, with Volatility back in full force, those who are good at playing both ways and can turn on a dime make good money though I am sure it is both exhilarating and exhausting.

        trout

It goes without saying that next week will be critical as we try to read the tea-leaves as to whether the Bulls can regain control or the Bears have it firmly in their grasp and are taking this Market into a reasonable correction.  The chart below shows that the simple red and green count of +1 and -1, respectively shows more minuses than plusses.  The Weekly Bongo is still showing Green but as we well know that is by design a longer term indicator and is the last to either turn green or roll over and turn to red.  Note that the Russell 2000 (RUT) and the Semiconductor Index (SOX) have been neck and neck in rising above all other Major Indexes, but the higher they go the bigger the fall, and as you can see from the slope down from their peaks a couple of weeks ago they have been the hardest hit.

roadmap

I introduced the Game Plan concept at the March 2009 Seminar of Higher Highs and Higher Lows to make it easy for us to follow when the Rally was strong and when it might falter.  It is still intact, but I show you that the lines in the sand all congregate around the convenient and easy number to remember of 1000.  Below that the famous Line in the Sand of -8%  from High to Low is broken and the correction becomes serious and the Saw Tooth Game Plan is in jeapordy.

saw

As attendees at the Seminar know well by now, I always give them Rules of Thumb which are golden and here is one set which establishes the degree of severity as we move from a Minor Correction to a Bear Market.  Of course anything more severe than the 27% shown gets to be godzilla proportions, but even that requires a 38% return to just get back to even.  Imagine 50% down requires your portfolio to come back 100% before you are back to the 2007 levels you enjoyed and you will understand how important it is to preserve your capital during a serious correction:

rule

In the next chart I have combined the thoughts of the two previous charts as well as thrown in one which I do not normally pay a lot of attention to, shown as “R2 is @ 1077”.  We gave you the link in “Useful Financial Websites” at my pivots…it takes the mystery out of this stuff.  The main reason for putting that on the chart is to know where the Gann and Elliott Wave thinkers sit, and isn’t it interesting this level is right at where a Head and Shoulders Top would be trumpeted should the Bulls try to recover their control…a potential Bull Trap.

sandp

The conclusion I come to is that we are essentially at the halfway point of a Bull or a Bear Trap, so be very careful how you commit unless you are prepared to turn on a dime and are equally comfortable going both ways.  From the above chart we can see that with the S&P 500 at 1036 it is 41 points to 1077 for the Bull Trap and 36 points to 1000, for the Bear Trap, where 77% of all S&P Corrections turn back up.  Of course if it breaks 991, the Bears win and we head down further to an Intermediate Correction.

There are two sides to the thinking of the Composite Man at this stage, and make no bones about it the Big Players control the direction:

A.  Camp Sunshine says “Who wants to sell?  No Fund Manager or Hedge Fund wants to sell here.  There are big bonuses waiting 8 weeks away…hold the line, and no one sells and everyone is happy”. i.e., the Santa Claus Rally and the Nov/Dec best months scenario. 

B.  The Gloom and Doom Camp’s case, is two fold:

1.  This Rally is running on fumes and there is little more to fuel it now that the bulk of the Earnings Reports are out, and we have had yet another large Bank failure this weekend to boot, and

2.  The 10% Unemployment is the Millstone and must come down to reduce the Fear.  It’s back to the same old song – Jobs, Jobs, Jobs.

Is all that an oversimplification?  Sure it is.  When will we know this current Bull Market rally in a Consolidation Phase is over?  When the Composite Man decides there is a disconnect between the Stock Market and the Job Market.

Since this past week has the Bears in command I felt it would be worthwhile to show how they have gained control in just one week since the Seminar.  It is striking:

targets

The HGSI Team thanks you for your continued support and the fun we all had this time last week at the Seminar, some of which I tried to capture in this note.

Best Regards, Ian.

The Bears are Ready to Dance

Friday, October 30th, 2009

Make no mistake about it, the Bears are sharpening their lists and are ready to dance.  Type 3 Swing Traders are confused and naturally when things get to a crossroads, they finish up caught on the wrong side of the Market. 

As my Kiwi friend Keith from New Zealand says in part “…the market volatility is making us all day traders…all I have time for and due to my location, is weekly position taking so am looking for a way I can do this (in futures and options as well as stocks) without getting my ass spanked…any thoughts?”

    bears

My response: “Keith, my Kiwi friend:  I am afraid to say with Weekly Positions “You are in the Fertilizer”.  This market RIGHT NOW is only for Type 1 and at worst Type 2 Moment and Day Traders, respectively.  Type 3’s such as you who are swing traders are getting their butt kicked, unless they have very tight stops and have seen the light…they either turn to being Type 1’s or stay out until the dust settles.  Ron and I and the rest of the gang from the seminar are all in accord, the only place to be right now is in the Camp of “Light Feet”.  I seldom make suggestions, but the wisest thing for you to do is to save your precious earnings and stay out…given your circumstances and since you asked for my thoughts.

Yes, of course, Type 3’s are kicking themselves, because they are a day late and a dollar short, but with the Phoenix as you rightly say triggering three days ago, the Bears have control until further notice (I showed this in the Chart I posted last night in my latest Blog).

Now I know you are eyeing the ARMS (or TRIN as they now call it) and hoping for an Eureka today…if it happens all well and good, but at this stage of the game the BEARS are getting their SHORT CANDIDATES List ready for when they can thump the likes of the Type 3’s and 4’s again.  They are already watching the VOLUME intently for today, and if it is anything but strong, you know the consensus from the “Guru’s” will be that this is a reactionary bounce in an oversold market. 

So what do the Bulls need to thump the Bears?  You got one answer today with the Eureka which is the Bounce Reaction to an oversold market.  The volume could have been stronger for the bounce to show the Bulls had conviction, but it certainly was not putrid.   Two Eurekas in quick succession with strong volume will suggest the Bulls have stiffened up their backbones and are back in control at least for now.  You know the Gann, Elliott Wave, Fibonacci, and any other Measuring Rod Types including myself (but as you know, I keep it simple) will be eyeing support and resistance levels to their heart’s content.” 

After the 13% move up on the VIX the previous day, the fear was in the market, but the market was badly oversold and the sharp bears were looking for a bounce play today as shown below, with the VIX retracing from its big move:

    vix

Today’s action on the S&P 500 and VIX suggests the “Large Players” came in late in the day to hold the fort when the Market didn’t crumble around the vulnerable midday period.  The Seminar attendees knew that this Thursday there would be a new POMO (Permanent Open Market Operations) pump by the Fed, and true enough it was $1.936B.

    vix and s&p 

The message is to “Know thy Competition” and then decide to either fight them or join them.  I therefore used Type 3 simple indicators to know where they stand while tying the day’s action to the S&P 500 and the VIX.  There are four points on the chart:

1.  The move up in the S&P 500 coupled with the VIX going down first thing confirmed that the Bounce Play was in full swing for the first part of the day.  Note how it met resistance at the R1 level at 1056.53 in the Elliott Wave good stuff which we showed you where to go at the seminar.  Note the cup and handle formation right at that level, before it pushed up again.

2.  The critical “after lunch” time period suggested that the bulls were wary and the tight Darvas Box on both the S&P 500 and VIX confirmed this as Large Players were probably expecting a drop to confirm that the Bounce was over and stayed out to confirm which way the wind was blowing before they committed to this strong move up by all the Indexes. 

3.  When the Big Guys decided to move in after the market didn’t stall, the S&P 500 finished up close to its Pivot Point at 1070.

4.  As I mentioned above today was POMO Thursday and that probably helped the strong turn around today.  I taught you all that mumbo jumbo at the seminar.

I know it is a trifle frustrating, but keep your powder dry until the Bulls are in control again are my best thoughts right now.  “When will that occur” you ask?  When that score of -6 turns to +3 or better…the road back to Hog Heaven Chart I showed in the previous blog note and in the October Newsletter.  Today’s action took the score back up from -6 to +2 on the NYSE and +1 on the Nasdaq.  Since the Nasdaq has been hardest hit of late, I would suggest you watch it carefully.  But first things first, you need a couple of Eurekas, otherwise get your short list ready and go with Camp Gloom and Doom, as that score will stay negative until there is a new rally.

I’ll leave it there for today as there is a lot to digest and we shall see if there is a follow through on Friday or soon thereafter, or whether we will just have a bounce followed by a continuation of the correction.  A healthy bounce will follow through above 1070 and head back to the old high.  The Jury is out for now.  Stay nimble.

Best Regards, Ian.

“Snakes & Ladders” is Back with Full Force

Wednesday, October 28th, 2009

Those who are consistent followers will immediately pick up on the Message:

snakes

Now take a look at what the VIX has done in the last nine weeks since 8/21/09.  It looked as if there was a fighting chance that the Bulls at long last got the upper hand with force, but it only lasted 10 days since the VIX broke down below 22.  It was too good to last, and here we are at the other end at 27.91:

vix blue

I plucked the next chart from the recent seminar where I warned that we are by no means out of the woods.  As I am sure you have realized the big swings in the S&P 500 of the % Daily Range (High to Low) used to be from -10% to +10% and commonplace a year ago.  It has now come down to less than 1%, i.e., Volatility and Fear had departed to a high degree lately, except for intra day.  Have “LightFeet” is my warning.

vix 10

The seminar attendees enjoyed this next chart, which summarizes how the HGSI Indicators keep us on the right side of the Market as we tiptoe through the Minefields and the Tulips.  For those who do not and cannot do detailed analysis due to lack of time and/or interest the following chart provides a very easy way of keeping score.  The total score one can have is plus or minus 8…count the number of windows above and below the Main Window in the middle.  There are five ribbons and %B through the Bandwidth above, and two windows below.  The current score is -6 out of 8, which is twice as bad as it was in the 6/09 to 7/09 period when we had a Market Correction as shown.  Enjoy:

roadmap

The last picture carries a warning that when the Pendulum swings too hard to the right, be careful of the equal return to the left as Newton’s third law of motion has taught us.  My law of Motion suggests there is a 4th law – All that glitters is not gold as the Monkey said when he relieved himself over a big cliff in the moonlight.

newton

The bottom line is that unless the Bulls can fight back to hold the line at no worse than an 8% correction from the high with the Line in the Sand at 1005, we are headed for the Gloom and Doom Camp.

Thanks to all who attended for making the Seminar memorable and for all your support.

Best Regards, Ian.

Copyright © 2007-2010 Ian Woodward
Disclaimer: Commentaries on this Blog are not to be construed as recommendations to buy or sell the market and/or specific securites. The consumer of the information is responsible for their own investment decisions.