Ian Woodward's Investing Blog
This Bear Market Rally has Centipede Legs
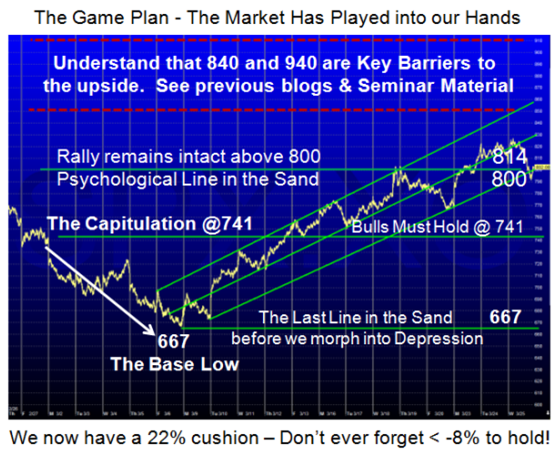
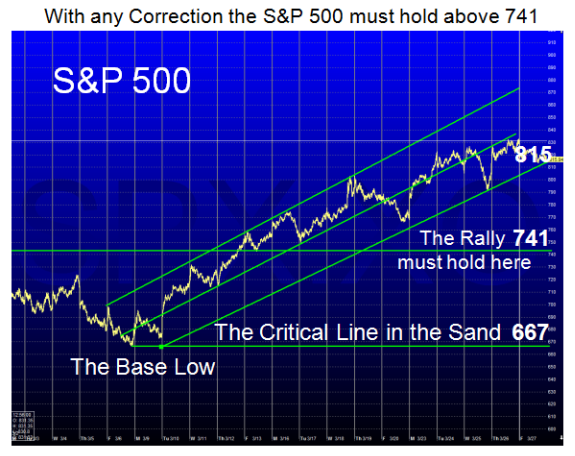
Wednesday, April 15th, 2009Despite the gloom and doom we experienced just 6 weeks ago, we have been able to crawl out of a hole slowly but surely to gain over 30% from the Base Low of 667 on the S&P 500. This is indeed a comforting cushion should we go down in the ensuing correction which is expected to arrive soon if not sooner. This Bear Market Rally has Centipede Legs as we hop along on our Pogo Sticks:

1. We are into 2nd qtr. Earnings Reporting, and that invariably dictates a sell off
2. We are two weeks away from May, which suggests the adage “Go Away in May”
3. We are in a six week rally and the best is 8 weeks on the way down from the top
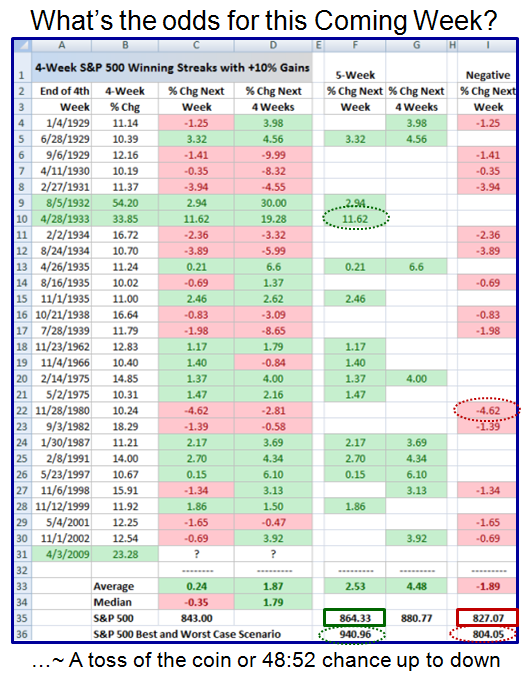
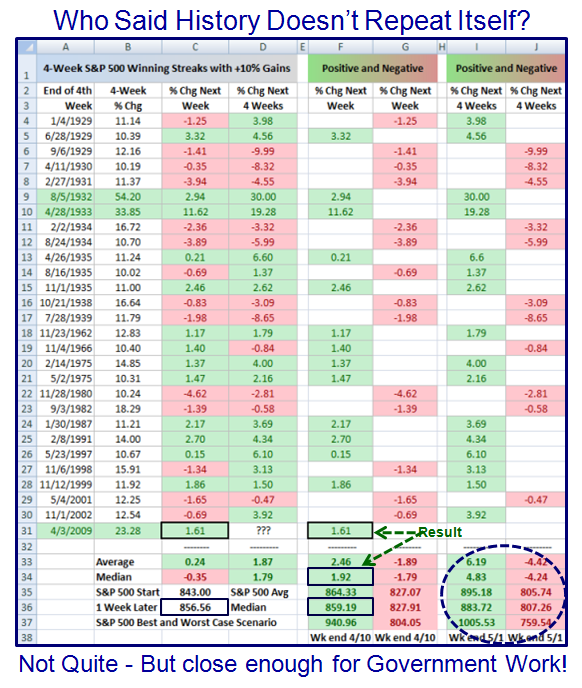
On the other hand all the palaver of the G20 summit is behind us and we experienced five straight weeks of S&P 500 gains, where I last showed you the statistics for the first four weeks with over 23% up and 27 such occasions over the years since 1929. Yes, of course it was somewhat with tongue in cheek, but we needed some positive news against all the gloom and doom around us, and as it happened it turned out to be favorable…who says that History doesn’t repeat itself?
Given that we then eked out a fifth week of gains, I might as well continue the theme and show you what Past History might suggest for the following three weeks. Note that the chart below has its stake in the ground at four weeks and then showed the next week and four weeks later, so that we now have only three weeks more to go to meet the expected range of numbers I have circled in the chart below:
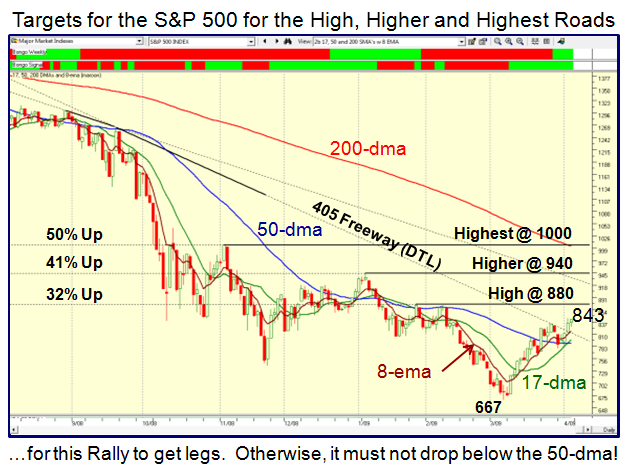
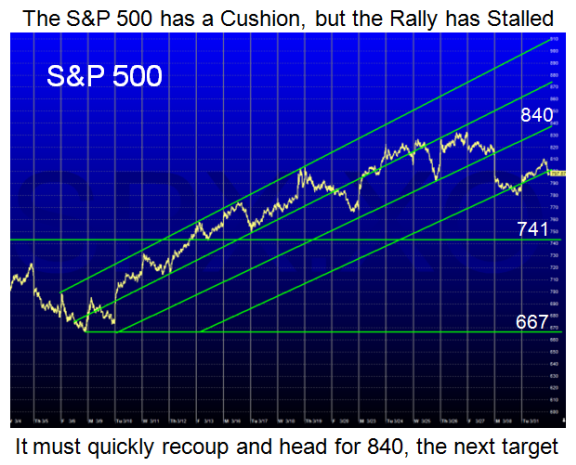
Now to blend Theory with Practice, we should stare at the current Support and Resistance lines that most Technicians would lay on the current S&P 500 chart pattern. I have long before now made the point that 840, 940 and 1000 were the important lines in the sand on the way up. Since 840 is now behind us, I raised the bar to 875, 940 and 1000 as shown on the chart below:
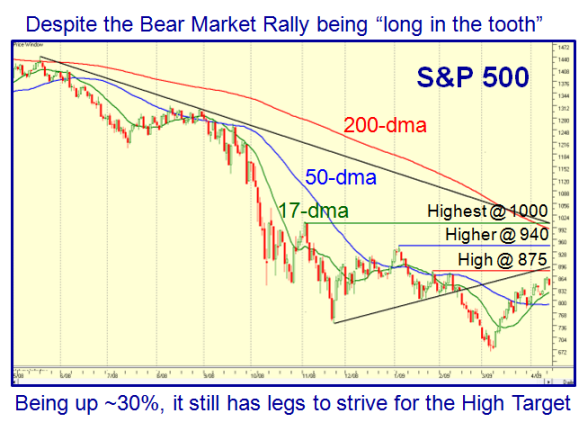
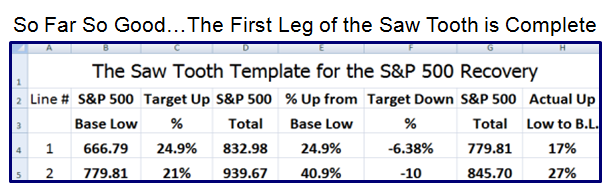
As I am sure you will recall, all great rallies rise above the 17-dma, and given that it has pierced up through the 50-dma, when they fail the fallback is to that level. The Line where key decisions must be made is at 790 but certainly at 780 which was the bottom of the 1st leg of the Saw Tooth Plan. Net-net, the Market has played right into our hands and there are no excuses for type 3 swing traders who have been nibbling. All these numbers are within the ballpark of the Past History Chart above! Enjoy.
Best Regards, Ian.