Ian Woodward's Investing Blog

Archive for the ‘HGS Principles’ Category

Bear Market Rally – It’s a Toss Up!

Sunday, January 11th, 2009

It has taken three months of trading in essentially a tight trading range to finally
produce a classic conundrum for the Bulls and Bears.  We have now reached the
point where it becomes a toss of the coin as to which way the Market goes.

Coin Toss

As I often say, “Beauty is in the eyes of the beholder”.  If you are a Bull, the T/A types
will favor an Inverse Head and Shoulders; if you are a Bear it’s an Inverse High
Tight Flag.  Since we are in a Bear Market Rally the long term trend is still down:

chart

When the direction is not that obvious, don’t second guess the trend…let the
Market tell you which way it is headed.  Be prepared to go either way for the
Type 1 and 2 Traders who are nimble.  For Type 3 sit and wait is the best call at
this stage if you have not participated in the tepid Bear Market Rally so far,
despite the fact that we are up over 20% from the Base Low.

If you are in the Market, then the Lines in the Sand at 840 and 940 tell you what
to do either to the down side or for the next leg up out of this mess.

In the short term, what are the two big factors for the week?  My guess is:

1.  The Bulls feel there is euphoria in the cards with the coming Inaugaration

2.  The Bears point to the expected poor Earnings Reports to come

Take your pick.  Best regards, Ian.

Santa’s Late Delivery…The January Effect!

Saturday, January 3rd, 2009

I had virtually written off the Santa Claus Rally when it sputtered for three weeks before the Holiday, but it came to life with a Late Delivery going into the New Year with the so-called January Effect.

                              santa

In my last blog of 2008 I showed a Check List of a sequence of events that I felt had to occur for us to see any form of a decent Bear Market Rally going into the New Year.  As you will see from the list below many of these items have occurred in the last week or so, and those that have not are either knocking on the door or were included to expect a confirmation that the Rally was indeed on:

check list

To our surprise we found that things began to stir the day after Christmas and finished this past week very strong with a decent move of around 3% on the Major Market Indexes.  Above all, we finally broke through the target of 915 and are half-way to the next target of 950:

S&P

We can see from the summary notes on the chart we are now over 25% up from the Base Low and this is where we normally expect some form of correction sooner than later.  Since we have two weeks to go to the first big blush of Earnings Reports which then peak by the first week in February, we might be able to eke out a move to 950 or so before we see a pull back.  It is what transpires after the current rally peaks as to whether we continue with the Bear Market Rally or once again fall back into the doldrums to retest previous lows at 915 and 860 where we should see support.  Anything below that and I am afraid it was all for naught, and only short term players would have benefitted by being nimble both on the way up and down. 

It has been a while since I gave a full review of the VIX “My Way”, so here are four charts that lay out chapter and verse of what has transpired with the so-called Fear Factor which has abated considerably, but as we shall see we are now nearing the point where the Bears are lurking and ready to pounce while the Bulls have been dancing:

decline

This next chart shows how low the VIX has retraced on the Fibonacci scale as it has retreated
almost 75% from its high, is close to it’s lower Bollinger Band, and is at the Connor’s >5% rule
below its 10-dma where the “VIX Bears” watch for any signs of a recovery to pounce in on the
short side of the market.

blach chart

However, there still seems to be some room for the Bulls to dance  as we look at the longer term picture using both an 89 and 40 period Weekly Chart of the Bollinger Bands.  If we are to look at this with rosey tinted glasses, there is still room for the VIX to descend to get down to at least 35 or even as  low as 27 before we see a jolt back by the Bears.

89 and 40

As my Christmas present to you, I showed you how I used the High Jump with the Moving Average crossovers to pinpoint that the momentum of the market was in driving for a Lower VIX with the 17-dma crossing down through the 50-dma, and I am glad I called that right.  Since all short-term Moving Averages are still pointing down it suggests we still have some time for this market to continue its rally…maybe for a couple of weeks more with luck, before we see a pull-back.

high

Last but not least, to bring us back to our senses so that we don’t get too carried away with euphoria I show you a chart which my good friend and partner, Ron Brown, showed in his Weekend Summary Movie where he reminded us that the Market in general is short-term overbought.  Note how the readings of the stocks above their various moving averages are all at the upper end of the spectrum where one should at least be alerted to a pull-back.

overbought

I wish you a Very Happy New Year and may all your stocks be winners!

Best Regards, Ian.

What’s Needed for a Strong Bear Market Rally?

Sunday, December 28th, 2008

Sad to say after all that encouragement from the sidelines, the Santa Claus Rally
fizzled and we have to hand it to the Grinch who won this round this year.

                              grinch

At least we have made a start towards repairing the rot that set in back in September
in that the Weekly Coppock has turned up and there have been plenty of Eurekas
indicating that the Bulls are trying hard to hold the bottom.

coppock

eurekas

Unfortunately, as I have indicated many times, we have endured terrible Volatility.
Just look at the difference between the % Daily Range of the 2002-03 timeframe
compared to now.  I have purposely kept the scale the same so that we can see the
major difference between the two.  It is all of three times worse now.

2003

both

The $64 question is What does it take to get this Bear Market Rally kicked into High
Gear?  Here are 10 items to watch, but I am sure we all have our own favorite list and
I have left many other items out…but these should show a Maturing Bear Market Rally.

list

Best of luck for a Happy New Year from the HGSI Team…George, Matt, Ron and Ian.

Half a Loaf is Better Than No Bread!

Tuesday, December 23rd, 2008

Mail-Bag:  My wife’s 401k is down 50%.  She is asking me if she should sell now and buy back later at a lower price.  I have no idea what to say at this point. Have any ideas?

Answer:  You are lucky as by this time my wife and I would be enjoying our grandkids, but like this Santa Claus Rally, the snow put a dent in our plans.  I don’t give advice, but I will break the problem down for you and show you a Game Plan.   Let’s review what makes sense at this stage.  Since I presume you follow my blog, I would suggest you continue to do so to give you and her clues as to what to do:

1. It goes without saying that many have experienced the same fate as your wife with their 401-K.  50% down is a terrible hit as it will take 100% to get back to where she was.  But that is water over the dam at this stage though it will take at least two years to get back to where she was if it doesn’t go down any further.  That is a pure guess, but in terms of time it assumes we not only have a Bear Market Rally but also it recoups into a full fledged Bull Market again soon.  Not very likely.

2. Invariably people throw in the towel when they have taken such a hit and feel that half-a-loaf is better than no bread.  Sad to say that many times that turns out to be right at or close to the bottom.  If anyone can tell you that we have reached a bottom and hang on…think again.  Not even Warren Buffett can do that, but he can afford to get hit as is T. Bone Pickens as they have deep pockets.  Hence the dilemma you face.

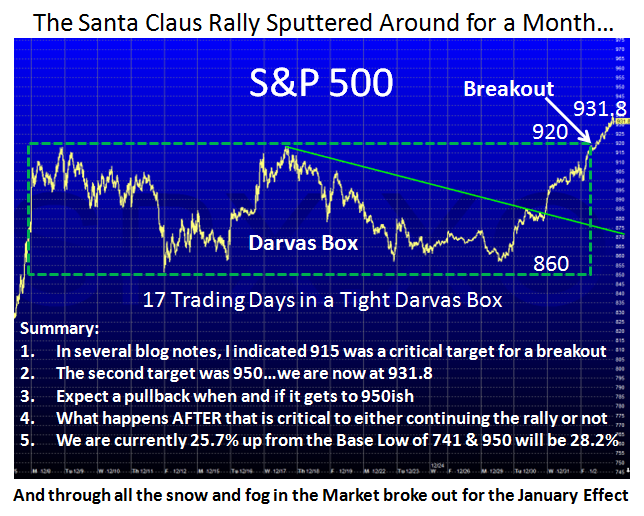
3. Since we have some breathing room with the recent Base Low on the S&P 500 at 741 (see many of the recent blogs I have put up which show the Lines in the Sand), we have at least bounced back about 24% from that low to its recent high.  It is currently about 17% up from the Low and hanging on by a thread.

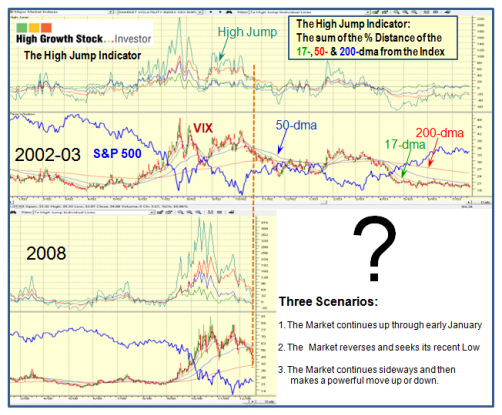
4. If you look at the Santa Claus Blog written on December 6th. with him sitting in his Red MG (I have saved you the trouble by providing it below), you will see there are three lines in the Sand to the Down Side:

half

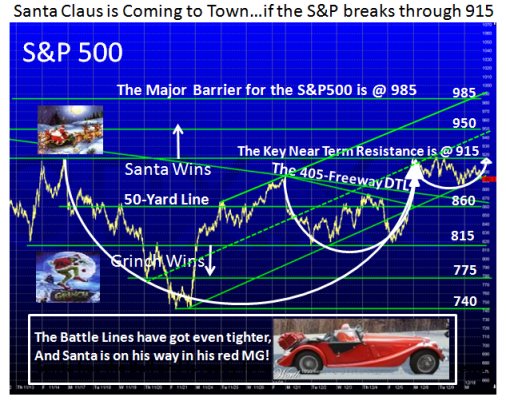
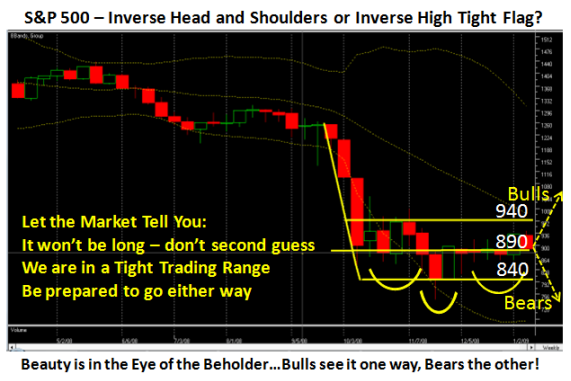
a.  The one at 860 which is the 50-yard line and is where most of the action will  meander back and forth as it is right now.
b.  The next important line of support is at 815 where I show anything below that the Grinch wins
c.  The final line is at 740 and if that is broken to the downside, expect the floodgates to open and who knows where it will bottom next.

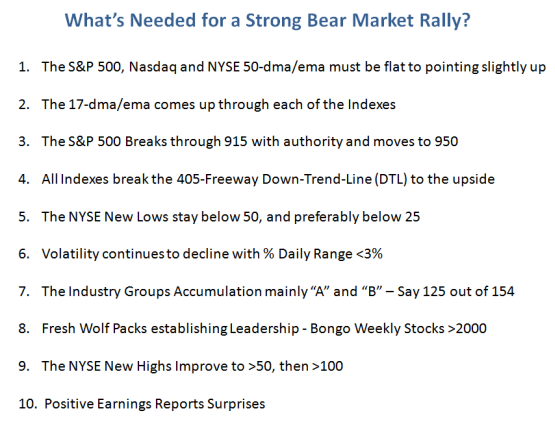
5.  Again, if you have followed, the Upside scenarios suggest that:
   
    a.  The first hurdle must be above 915 which it hasn’t penetrated as yet and is meeting stiff resistance at that level
    b.  The next one is at 950, which is 33% up from the Base Low of 714.  If it achieves that, it will be deemed as a very good Bear Market Rally.
    c.  Anything above that is sheer gravy at this time, and is wishful thinking until we get past the first two targets.

6. With the Global Market scene as bleak, the intermediate term and long term bias has to be to the downside for now.  The best one should expect is a short-term Bounce Play (Call it a Bear Market Rally) if it can get above 950.

7.  So her strategy should be fairly clear from here if you read between the lines:

     a.  If it goes up from here through mid January say and gets above 915, then 915 becomes her line in the sand to vacate should the market turn down, and she would at least have recouped something in participating in the Bear Market Rally and then vacating when and if the Bear Market resumes downwards.  Since she can watch how her 401-K behaves as it moves up and down, it should not be difficult to see whether she is making any headway or not and then make up her mind. 

    b.  If it never gets above 915, then her 1/2 a loaf scenario is the choice somewhere between 860 and 815, because her stomach tells her so!  Since she has already experienced what it is to be down at 714, she will soon know where to call it quits. 

   c.   If she waits until it gets below 714, she will be further in the mire and telling you “I shoulda, coulda, woulda”, kicking you in the shins and feeling “now I will never be able to retire!”  Ready, aim, aim aim and never firing is what got her into trouble before. 

The lesson learned Rob is that our whole life revolves around threes.  What better evidence than the rules of the road with traffic lights as Green, Yellow and Red.  Always break complex problems like this into three scenarios…the high road, the middle road and the low road, as I did in 7 a, b, and c. Under these circumstances, unless there is a miracle wand waved over the overall global gloom, don’t give up the half a loaf to see that evaporate when the market tells you it is headed down again.

As I say I do not give advice and anything I say is “ALWAYS YOUR CALL”, but there are many people in the same boat as your wife and this may be of help to them too.  My notes are written to help people understand the Stakes in the Ground and the Measuring Rods and most understand what to do once they have a reasonable Game Plan developed.  The rest is up to each individual as to what their stomachs can bear.

Best regards, Ian.

Volatility, the VIX, S&P 500 and High Jump

Sunday, December 21st, 2008

scene

Since most of the country is blanketed in snow at this time of the Year, the Picture above is the HGSI Team’s Seasons Greetings to all of you our loyal supporters and to the blog friends we have made around the world.  Consider this blog as my Christmas Present to all of you.

case

In an earlier blog just two weeks ago, I showed the Daily % range change in the Indexes together with the VIX since October 1.  I noted that “the Crux of the Problem for this Santa Claus Rally is the fear exhibited by this chart which shows the average at 5% (between friends) together with a VIX >50!”  At the time I did not know how these few weeks going into the traditional Year-end and the January Effect Rally would pan out, but I felt I should revisit this concern and shed more light on the subject.

The intent of this Case Study is to see:

1. The Volatility as expressed by the VIX and the % Daily Range of the S&P 500

2. The extent of the extreme Volatility the Market has endured these past four months

3. If there are any signs of an abatement to this high Volatility

4. The Positive & Negative swings and Nasdaq, Bingo & Eureka for the past four months

5. The comparison of the past four months to what preceded it the previous 12 months

6. If the High Jump Indicator could shed any light of the Volatility in 2002-03 and now

So let’s take them one at a time as follows:

vix

As we can see from the chart above there is a strong correlation between the % Daily Range of the S&P 500 and the VIX.  % Daily Range is defined as the (High – Low)/ Previous Day’s Close, expressed as a percentage.  Note the spikes that occurred back in 2000 to 2003 just as we have now, though the % Range and the VIX Readings were much less than now.  However, also note the extreme volatility is also accompanied by big spikes in the % Daily Range readings, which was shown in the previous chart, confirming the strong relationship.  There is nothing novel in this since my friend at VIX and More has very eloquently described long before now.  I recommend you visit his site.

stats

This chart is an eye-opener as it shows in a flash the extent of the extreme readings in % Daily Range these past four months compared to that over a 10 year period.  Over a long period of time the normal expectation is a % Daily Range of <2% which occurs three-quarters of the time.  95% of the readings are under 4%.  37 of the 41 readings above 6% this past four months is a staggering  90% compared to 10 years.  The conclusion is that the Market Fear Indicator has been in Oscillation!

signs

The chart above shows the extreme readings of over 11% with very few below the 4% mark.  However, note that in the past ten days with the tight “handles” produced in the S&P 500, and for that matter in all the other indexes, the volatility in the VIX has dropped substantially along with a drop in % Daily Range to below 4% for the most part.

longer

This chart shows a longer term view of where there was some degree of normalcy despite the fact that we had chalked up several readings in the VIX of ~30.  The Bears are a trifle concerned at the recent drop off in the VIX, but are hoping that it will find support at the 200 day Moving Average and bounce higher. The Bulls will only smile when the S&P 500 % Daily Range is consistently <3%, and the VIX gets down below 30 for this to happen.

ebb

This chart shows the Ebb and Flow of the Positive and Negative swings by the Bulls and Bears, and the Irrational Exuberance expressed by the Eureka signals we have come to respect as a sign that there is at least some interest by long term value investors to grab some tasty morsels in the hopes that we have reached a bottom for now.  The updated late breaking news is that we had yet another Eureka this past week (not shown on the chart), but the Market Indexes are all stuck in a trading range.

Now comes the tricky part…which way does this tepid Santa Claus Rally go…up, down or sideways?  I felt it might be fun to bring out my trusty High Jump Indicator and show its value in another form.  The chart below shows a comparison of the High Jump for the 2002-03 timeframe and now in 2008.

Some have noted that this tight trading range is very unusual for all Indexes showing identical patterns that it suggests a coiled spring and a dramatic move one way or another.  Others suggest that it is not surprising that the market is meandering in a trading range.

high

There are two ways to line up these charts, either have the Peaks of the High Jump in line or the cross over of the 17 and the 50 Day Moving Averages.  I chose to use the latter as shown by the dotted Orange Line as that shows the current momentum which is down for the VIX.  Tomorrow will be critical to see if all the Market Indexes can push through their stiff resistance which I have previously explained before is at 915 for the S&P 500.  Although the Index is now 24% up from the Base Low of 714 which is a point at which many rallies get turned back, my feel suggests “Up” for now, but who am I to say.  I base my bias on the fact that the Internals of the Market such as the % of Industry Groups above 50-dma is now at 80, the Number of “A” and “B” Accumulation Groups is 22 and 111, respectively, and Bongo Daily and Weekly Stocks are at 3165 and 1794, respectively. These are numbers we have not seen since June of this year.

Seasons Greetings and all Good Cheer to you and yours.   Spare a thought for the HGSI Team.  We like to hear from you.  Ian.

P.S.  If you have never tried HGS Investor sign up for our free 60 day trial.  www.highgrowthstock.com/trial

Copyright © 2007-2010 Ian Woodward
Disclaimer: Commentaries on this Blog are not to be construed as recommendations to buy or sell the market and/or specific securites. The consumer of the information is responsible for their own investment decisions.