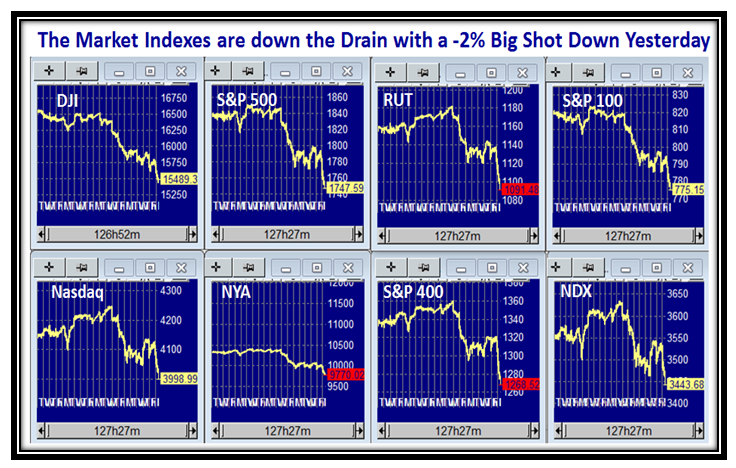
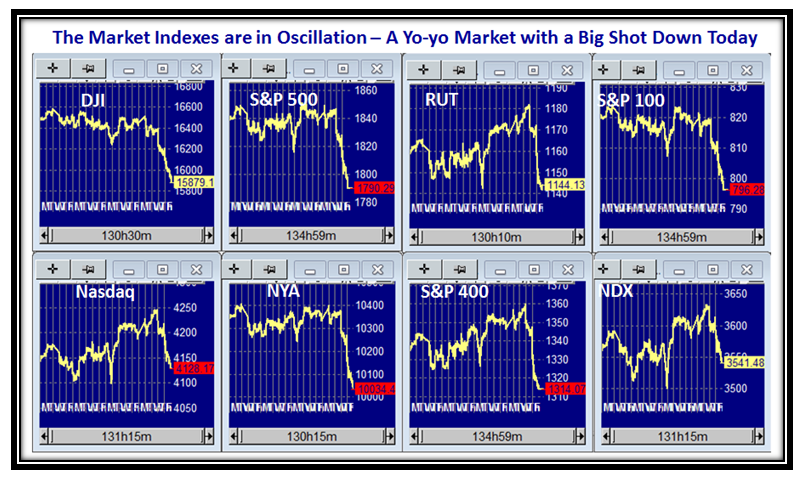
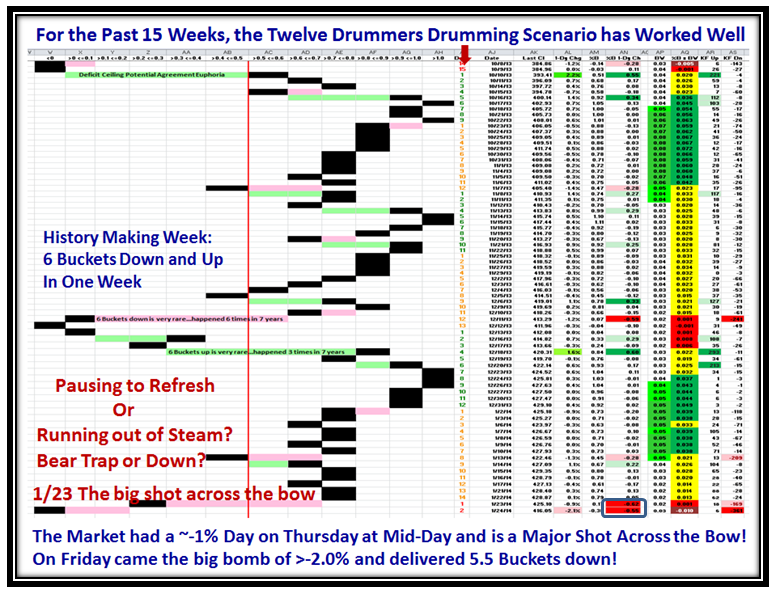
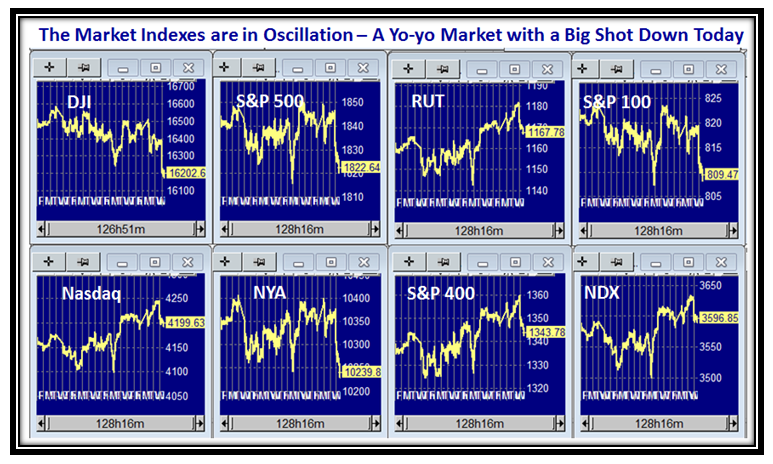
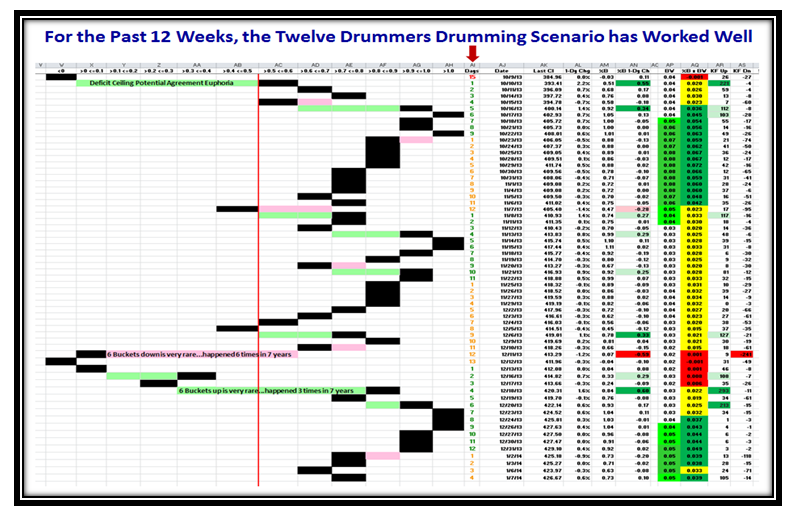
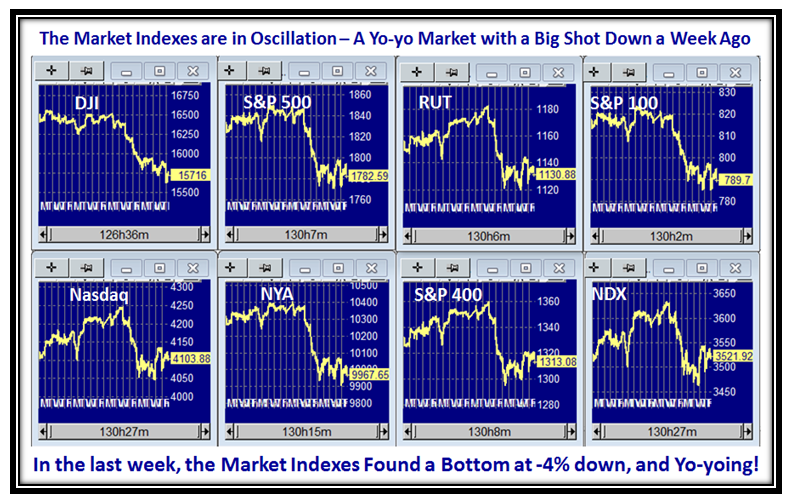
This past week we saw the chinks in the Bulls’ Armor, and with the Market Indexes all down ~ -4% from their highs, we are at the point now where things have come to a head between the Bulls and the Bears, and this blog note should show you the two Alternatives as to what is required for one or the other to win control:

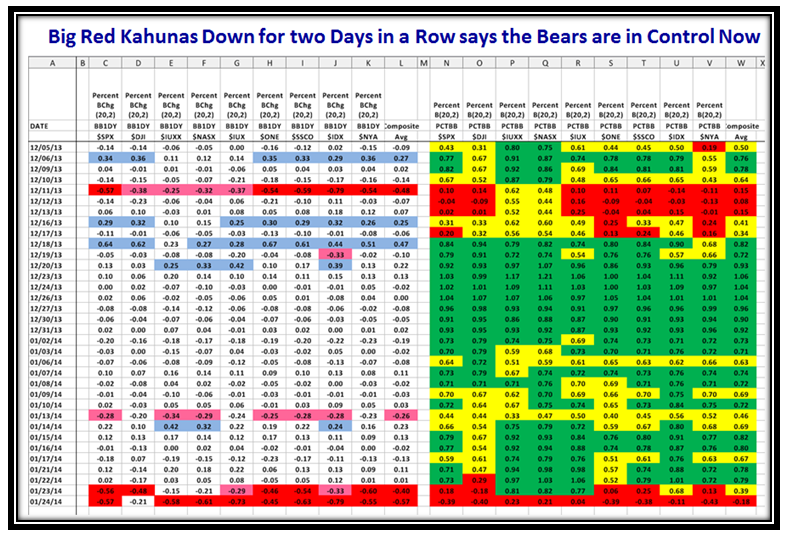
There have been signs of deterioration in the Rally this past few weeks as I have signaled in my recent blog notes and all Market Indexes dropped from the sky to sit below the Lower Bollinger Band for four of the last six trading days.
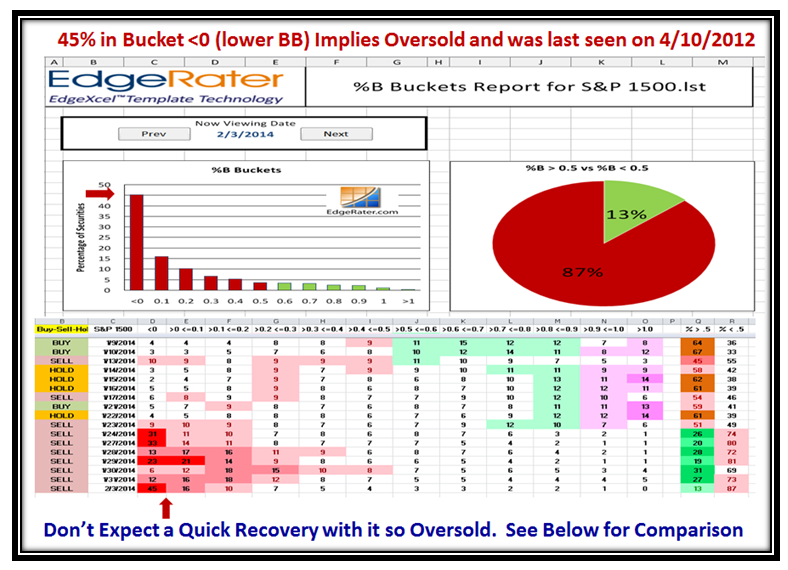
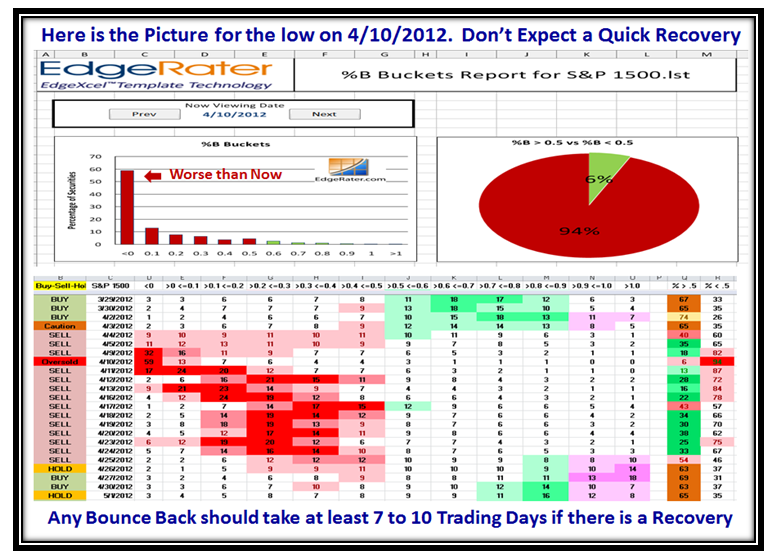
We are now oversold and can either muster a strong follow through to the bounce play we had on Thursday of this past week or we fall into the abyss and head down to the -8% level from the Market Indexes Highs. Sure, there are other alternatives, but the following charts will show you these two as the key alternatives:
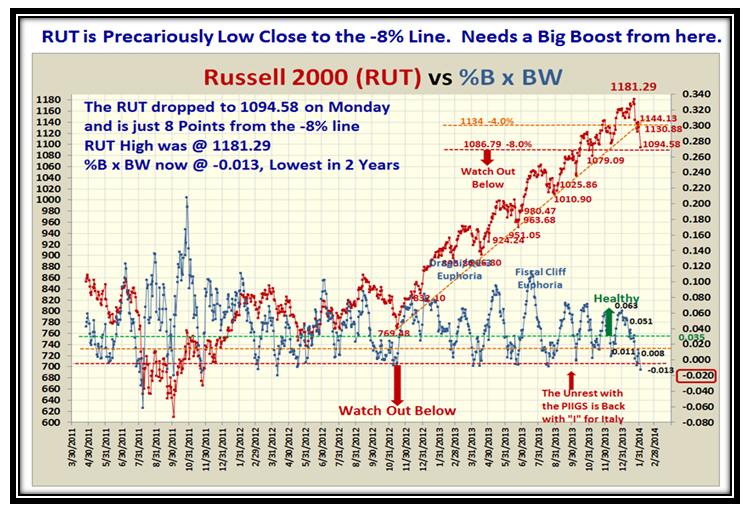
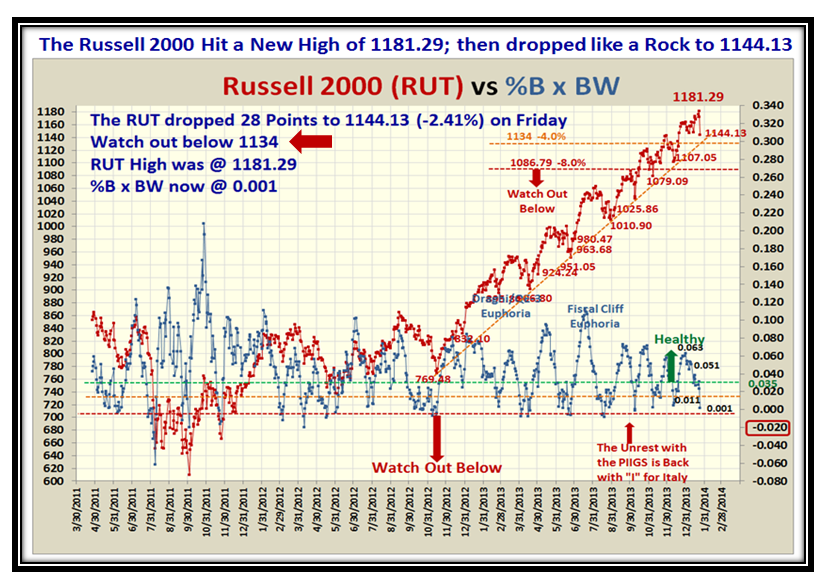
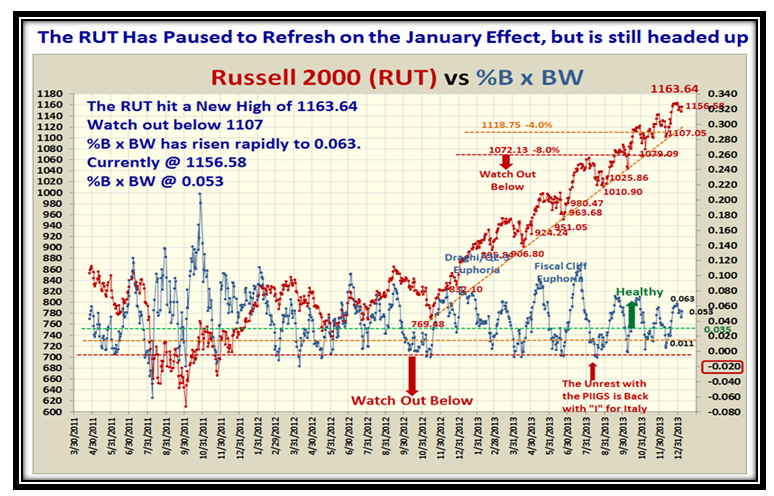
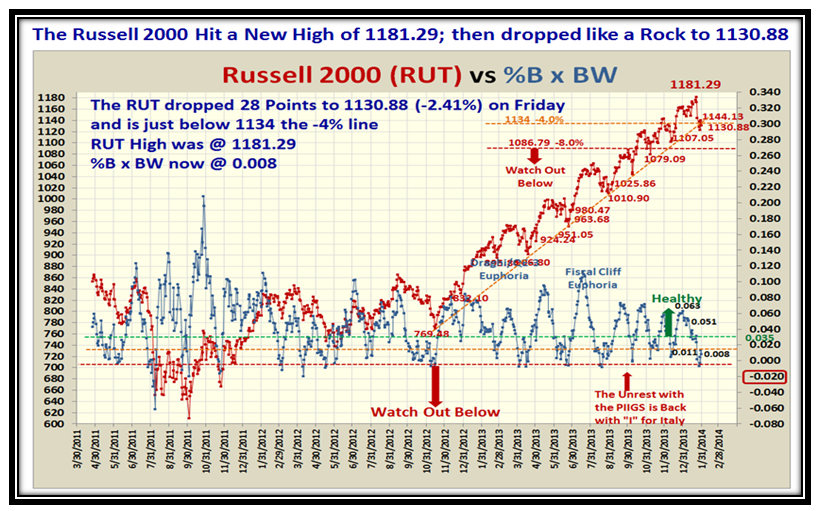
…And here is the Russell 2000 (RUT) which is again threatening the Trend-line of the past year:
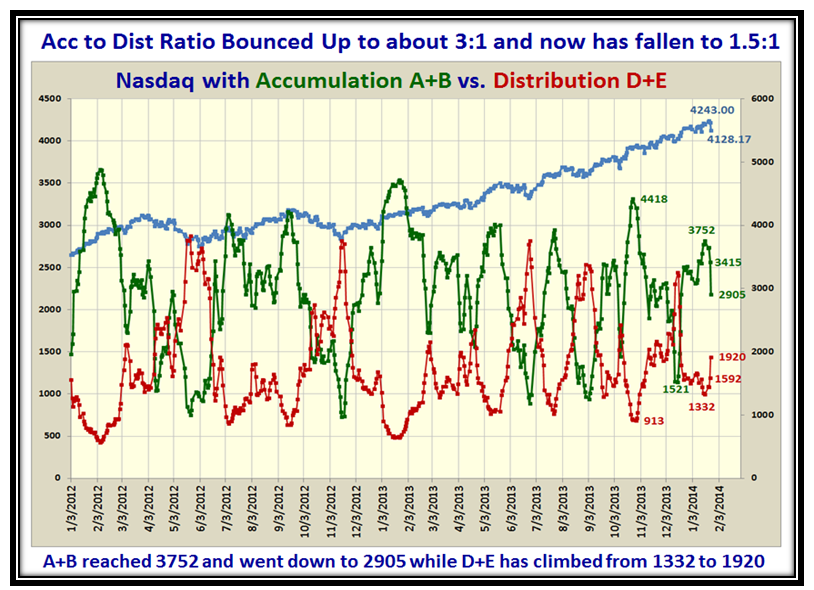
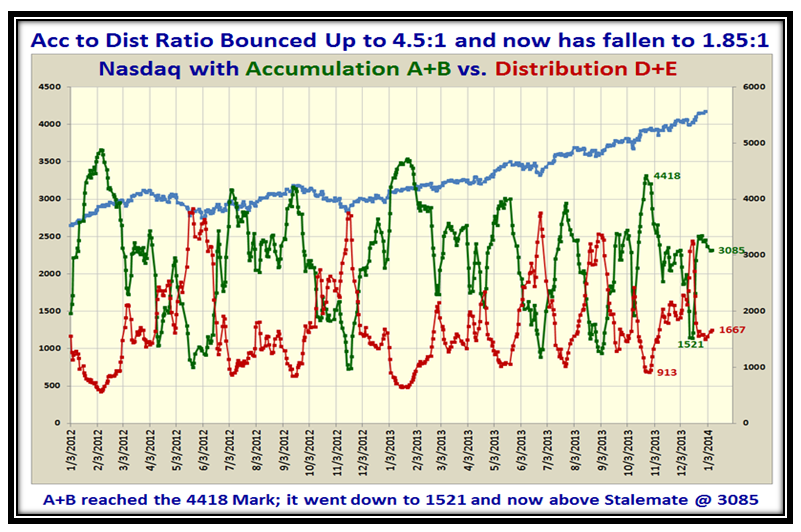
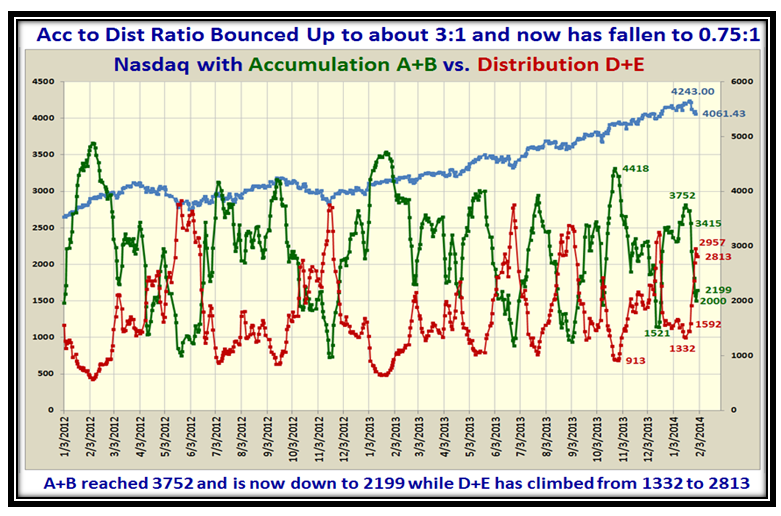
Now let’s turn to the Internals of the Market with the Accumulation vs. Distribution picture, which again confirms that the overall bias is distribution:
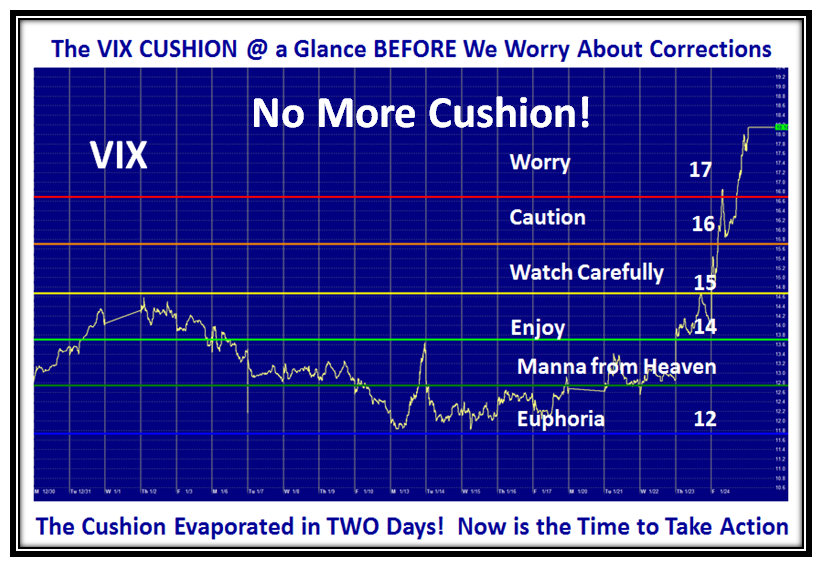
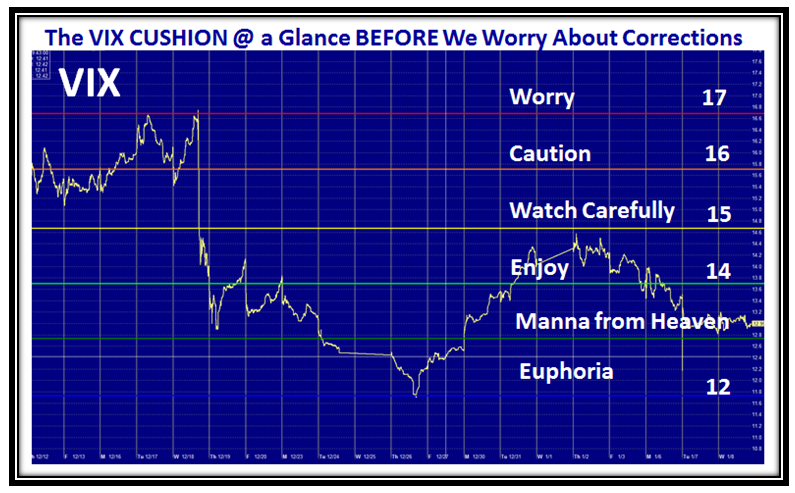
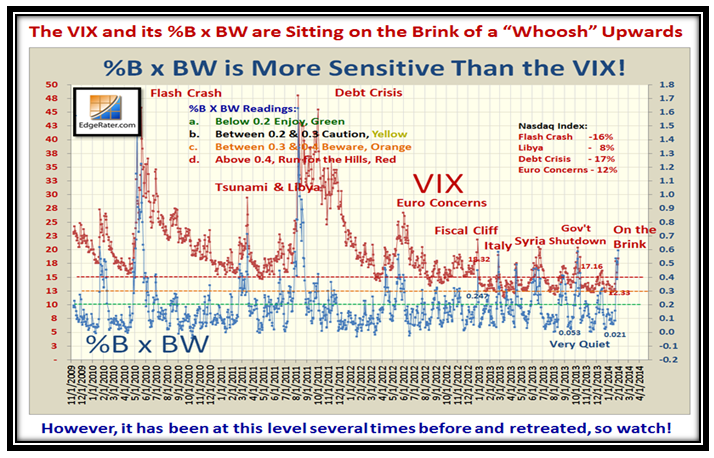
The VIX has shot up precariously in the last few days where it is now at a dangerous level for a possible Whoosh, though in the same breath you can see that on the last five occasions it has always retreated:
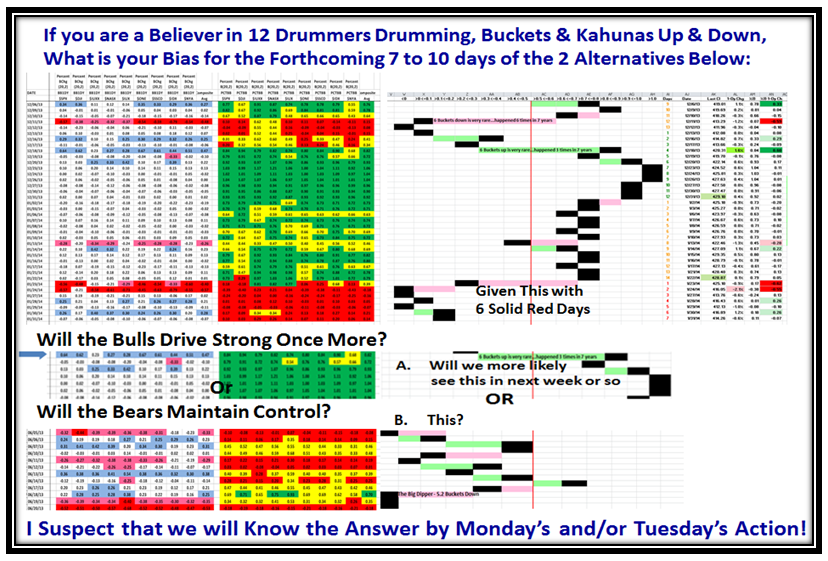
So, with all of the above as the good fodder to whet your appetite, let’s see if we can put the clues together to arrive at the two core strategies for the Bulls and the Bears for this coming week. In the top portion of the chart you will see that there has been a splatter of “Red” at the bottom for all the Market Indexes, but more importantly four of the six days they were BELOW the Lower Bollinger Band. That said, you also know that it is unusual for this to stay this way and with the move shown in Blue on the bottom left on Thursday we had the bounce from an oversold state, which took the Indexes back above the Lower BB.
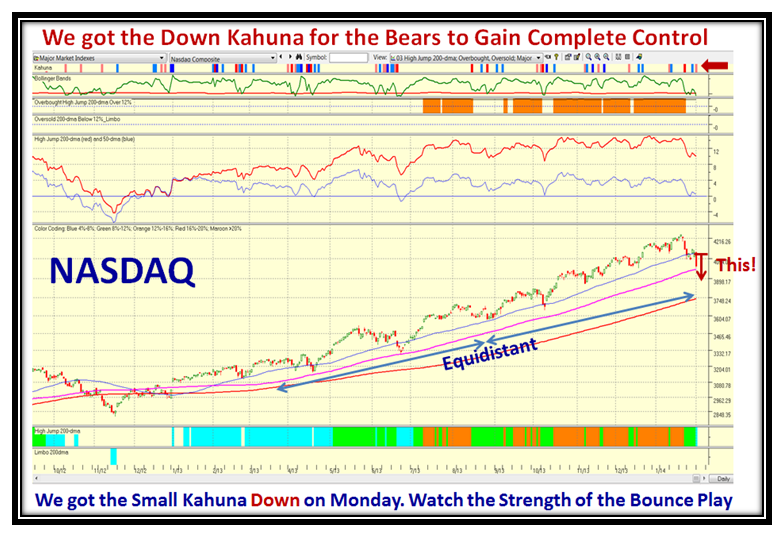
For the Bulls to capitalize on Thursday’s move they need to drive early this week with another series of Blue Kahunas upwards on Monday or Tuesday at the Latest, which is shown in the middle of the chart. On the other hand, if the Bears are to maintain control they need to drive a set of negative Kahunas as shown in the lowest part of the chart.
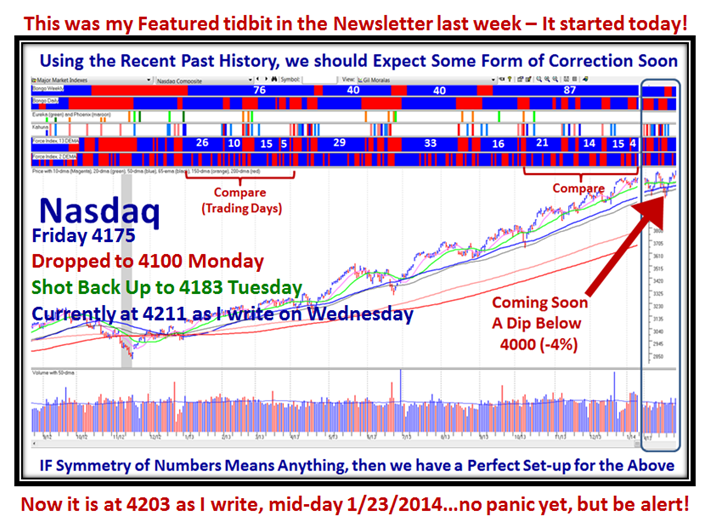
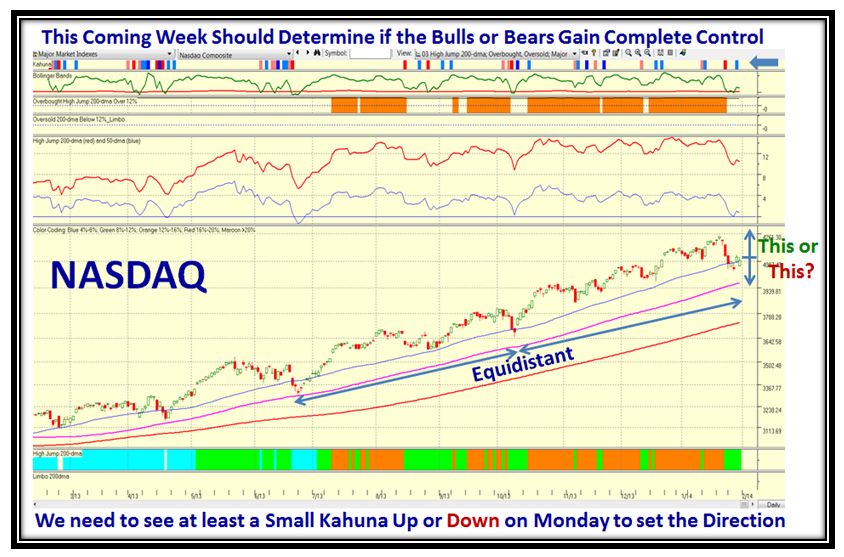
To wind this up let me also show you a chart of the Nasdaq which also shows the symmetry of the situation and the ripeness for either a new move upwards or a fall from the skies for a decent correction, which is overdue:
Good luck to you all and happy hunting.
Ian
 Ian Woodward's Investing Blog