Ian Woodward's Investing Blog

Archive for the ‘HGS Principles’ Category

Mountain of Worry for the Fed
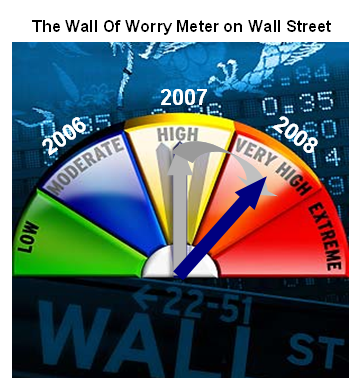
Saturday, August 23rd, 2008

Fed meeting in Wyoming against a backdrop of challenges: It is a year to the week since I first posted a note with the little fellow on the right of the picture asking the same question.  When Fed officials gather for their annual retreat at Jackson Hole, Wyo., on Friday, they’ll cover all the possible avalanches, crevices and cliffs that could send the economy dangerously off course. Conference goers are going to be debating the Fed’s dramatic actions to stem the financial crisis and protect the economy. They’ll be pondering what more could or should be done.

ben

Recent developments in commodity prices and the dollar, combined with slow growth, should lead inflation to moderate this year and next year, said Fed chairman Ben Bernanke on Friday. The recent decline in commodity prices and the increased stability of the dollar have been welcome trends, Bernanke told policymakers and economists at the Fed’s annual retreat in Jackson Hole. The Fed chairman stressed that the central bank was committed to price stability over the medium term and that the Fed will have to monitor inflation carefully as the outlook remains uncertain. Bernanke noted that the financial turmoil that began last August has not yet subsided and its effects on the broader economy are becoming apparent in the form of softening economic activity and rising unemployment.The market has been most erratic of late, with undercurrents and crosscurrents that can snap you in two if you are not nimble.  Even the day and moment traders are having a tough time of it and stock market forums are more silent these days as they enjoy other things such as the Olympics, vacations, graduations and weddings rather than lose money in the stock market.

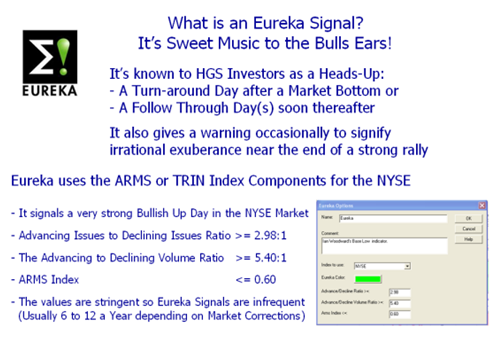
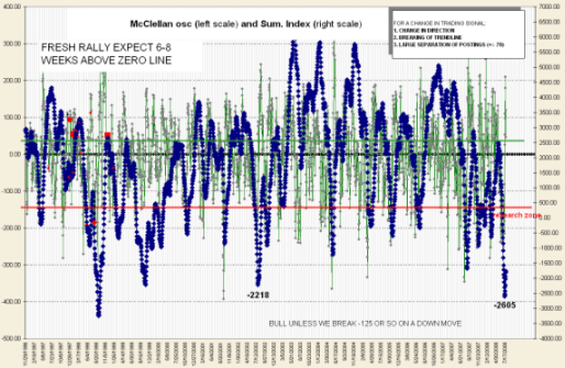
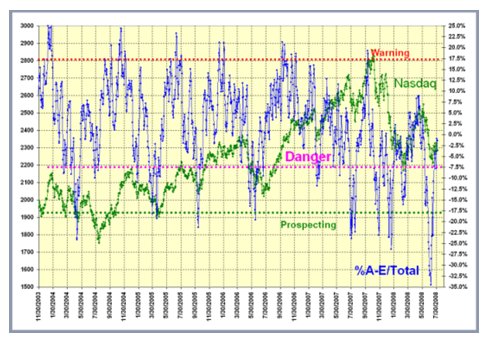
The recent attempted rally fizzled with a bad week this week, and today we are experiencing an oversold bounce.  What else can one call it when the market swings a couple of hundred points every other day?  The underlying internals are putrid and it suggests to me that unless one sees some excessive irrational exuberance by the bulls’ ala a Eureka or two, we are always doomed to failure on attempted rallies when the market is so oversold.

int

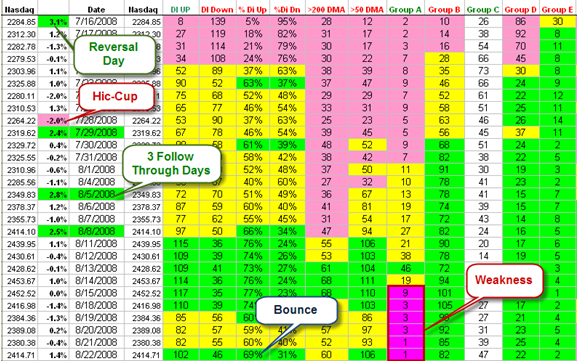
The “Internals” of the Industry Groups are discouraging with only one Group having “A” Accumulation (Insur-Brokers), and 83 with A+B ratings out of 154 Industry Groups overall or 54%. DI+/DI- is much better with a 69:31 split.  Note that the three follow through days on 7/29, 8/5, and 8/8, eventually turned the picture from Red to Yellow to Green.  However, the choppiness is very evident with the Industry Groups still weak as shown in the last six readings in red.  The only saving grace is a benign VIX Index which despite all this upheaval has remained placid.  Let’s take a roll call:

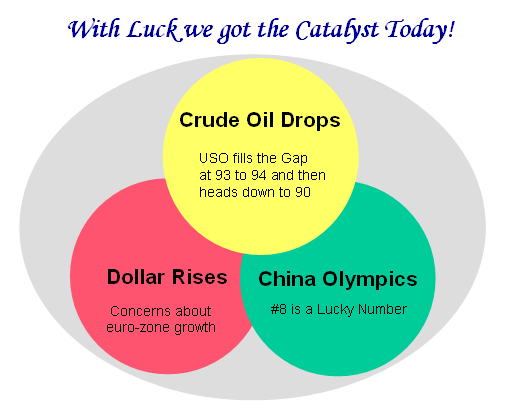
1. The Oils:  Now very erratic as we would expect.  The oil ETF, USO did come close to 90 as I told you to watch, bounced to 98 with the Russia-Georgia fracas and headed down again.  If it breaks 88 to the downside, the oil stocks will be hit badly but the market will probably head upwards as Oil heads below $110/barrel (say).

2. Favorite Old Wolf-Packs:  These include The Solars, the Coals, the Fertilizers, the Steels, the Transport-Shipping, the Machine-Generals, the Chinese Silverbacks.  The only way to play these is to have Wolf-Packs at the ready and on the day, moment-trade or day-trade them.  Solars and Fertilizers and an iffy Coal group have bounced nicely this past week, but nimble is the word.

3. Reviving Industry Groups: The Health Care including Bio-Med, HMO, Nursing Homes and Health Instruments have all bounced nicely and are generally strong.

4. Technology is gaining momentum especially the Small Caps, and there is the usual litany of Groups for this lot.

5. Dredging and Bottom Fishing:  Of course, Financials, Home-builders, Leisure-Gaming and on and on is where the value is.

6. False breakouts: The real problem is that too many false breakouts are occurring on what potentially are leading stocks with ERG and RS high at >240 and 90, respectively, that the only players making money are extremely nimble day traders.

7. Folklore: This is not unlike the late 2002 and early 2003 timeframe, where the Market itself is so oversold that it requires a major groundswell of committed buyers to show their commitment.  Although it was excusable these past weeks for one to see a void in Eurekas from an extremely oversold position, it is now time to expect these to appear or one should continue to be very suspect of this market. 

We shall see what the Jackson Hole Meeting of the FOMC brings, but don’t expect anything more than platitudes and a wait-and-see announcement.  Meanwhile, I continue to enjoy the Olympics, which I told you would bring major focus to China!

Best Regards, Ian.

High Growth Stock August Newsletter Overview

Friday, August 15th, 2008

I note my readers are wondering why I have been quiet lately.  Not really, but like most I have been enjoying the Olympics and more importantly preparing the monthly High Growth Stock Newsletter, which will be out later today:

newsletter

Overview:

In my recent blog I identified three items that could individually or together provide a Cataylst for this market to kick it up on a Bear Market Rally from the doldrums we suffered last month.  Sure enough the bubble bursting on the price of oil, the U.S. Dollar rising and the euphoria around the China Olympics* have all kicked into high gear this past couple of weeks and we have seen a decent, albiet choppy, rally these last couple of weeks.  What we have learned is that when Rotation from the Leaders take place in earnest, you better not be on the wrong side of the market…but then again we knew that only too well; it was only a matter of time before the old favorite Wolf-Packs took a shellacking and we look for new leadership.  It comes in two forms:

1. New Leadership with strong ERG candidates…though many experiencing failed breakouts as is ALWAYS the case in a choppy rally, leaving those who are purests of the 7-8% stop loss rule cringing at being stopped out time and time again, and

2. Dredging with beaten down Industry Groups that are always tasty morsels when they have been trashed so far down to present value for those who like to bottom fish.

My focus this month is to walk you through this most recent set of events from the high back in June through Capitulation to Reversal and Follow Through days.  As always, Ron has come up with a view in the Charting Module that gives us all we need for Capitulation and all of this will unfold at the workshop as Bango! We now have all the bases covered based on 7 years of research starting with Eureka!

Ron’s movie and focus this month is “Determining Position Sizing and Risk/Reward with the Oz Calculator”. The huge advantage of following this procedure is that:

  1. You know your risk; the reward is uncertain
  2. Once the trade is filled and your stop is in place, the fear is gone because you know how much exposure you have to the market

The next High Growth Stock Seminar will be from October 25 to 27, 2008, and Ron and I thank you for your full support as it is SOLD OUT two months ahead of the date.

* China Olympics…For the casual reader who may wonder what on earth the Olympics has to do with the Stock Market Rally, please look beyond the Olympics themselves which had the most spectacular opening to the games in my memory.  It demonstrated the power of China in technology, resourcefulness & discipline of mass-manpower, and overall artistic imagination.  However, an earlier point I made was “Oddly enough I feel the Olympics could be a Catalyst as China becomes front and center for the next two weeks.  You can rest assured there are background talks going on to reverse Wall Street’s downward slide that triggered a 40% sell-off in China Silverback Stocks, keep U.S. consumers buying China goods, and keep $1 trillion in U.S. dollar-based investments from free falling into an abyss, which in turn could rock the Chinese economy for years to come.”

Best Regards, Ian.

The Catalyst for a Stock Market Rally

Friday, August 8th, 2008

Sometimes it takes a Catalyst to Make the Market Rally off an oversold state.  I suggested the three factors required two blogs ago.  With any luck we may have got all three of the factors I suggested to make it happen!

            catalyst

1. U.S. stocks rally as crude drops to 3-month low – U.S. stocks on Friday rallied as a surging dollar pushed the price of crude oil to lows not since seen early May, helping investors set aside the latest fault line in the housing sector, which came in the form of large losses at Fannie Mae.

2. Dollar extends broad rally as euro withers – A sell-off in crude-oil futures, surging stocks on Wall Street and U.S. economic data showing a rise in productivity further fueled a dollar rally Friday initially sprung by concerns about euro-zone growth.

3. Fireworks and number 8 kick off Beijing games – The Games will ceremoniously begin Friday, the eighth day of the eighth month of 2008, at the carefully chosen moment of 8:08 p.m. local time.

It goes without saying that most have been worn to a frazzle with this yo-yo market, but with luck we may get some respite and see a decent summer rally.

On CNBC, Art Cashin said this week looks a lot more interesting, but he is not quite ready to give it the Miss Universe Crown yet.

We know that the Medicals by way of the Biotechs, HMO’s and Nursing Homes have all been hot, but now as a winky-winky we see the Technology Sector coming out of the ashes.  This bodes well for a potential rally.  Good Luck.  Best Regards, Ian.

The Value of Eureka Signals at Market Bottoms

Thursday, August 7th, 2008

Eureka

At this important juncture, I felt I should post this note in its entirety without any editing.  If it is too much to digest just move on, but I feel it is a good educational follow-up to the thread of posts relating to Follow Through Days (FTD) and a perspective of the pulse of the current market.

Mailbag Discussion:  

I have spent some time studying. I like you have been waiting for a Eureka and confirmation with new 52-week highs. I created some new views on High Growth Stock Investor to help me go back in time. I looked at the Coppock, Eureka, NYSE new Highs and Lows as well as a follow-through day visual filter back test. I made up a daily Coppock that mimics the Weekly Coppock using 50 and 70 days and 50 day average. It tracks the weekly quite well.

I went back to 2003 in a NYSE daily chart and studied what I saw comparing to current time. In 2003 we did not get a Eureka until 30 trading days after the 17 March 2003 FTD, the Eureka came in late April. The NASDAQ followed through on 3/17, the NYSE did not as it was just day 3 on the NYSE. The NYSE 52 week new highs did not broach 100 for 12 days after the NASDAQ FTD and then it dallied for a couple of weeks before really taking off.

What I see now in the market looks a whole lot like the 2003 time frame (different stocks and groups breaking out). I also think that it is quite impossible to have a Eureka when the market is in a big rotation as we have now and as we had in March of 2003. I think the Eureka works well for follow-on rallies but when we are in a major rotation it may not work. Think about it. The Eureka requires a large ratio of new advancers to decliners. When the decliners are so huge like the oil base stocks tanking it is quite a high threshold to expect that advancers could overcome this downwash. It took 30 trading days for the market to confirm the rally in 2003 because of this.  Mike Scott

Response:  Mike:  You are absolutely right that one’s expectations for a Eureka should not be within the normal 12 to 15 days of a Capitulation, given the parallel to 2003, but there are at least a few other factors that must come into play on the positive side while the tide is out that we should like to see shaping the internals:

1. As I said on my blog the first expectation must be that the New Lows go dormant. I note that over the course of 21 days after the Temporary Base Low, one should expect this number to average about 40, with less than a handful of days at above 50 during that period.  Over the past 14 days that number is at 64, so it is not dormant yet, and we have not had a single number below 42 to date, using HGSI data.

2. The second yardstick relates to the components of the Eureka.  I buy your argument that New Highs and Advancing Issues to Declining Issues cannot be expected to rise from the ashes in so short a time given the rotation and Oil stocks being a big part of the clobbering.  However, on that which is moving I certainly expect that there be some more enthusiasm in the beaten down stuff they are now buying to the extent that the Advancing Volume to Declining Volume should show some perkiness.  Furthermore, back in 2003, the ARMS ratio itself kept dropping below 0.60 at least ten times and the Adv Vol: Dec Vol was up at least 6 of those occasions to above the 5.40:1 requirement while waiting for a Eureka.  In effect, we had six 2/3rds. of a Eureka! That tells me that there is insufficient buying pressure with conviction on the NEW Groups to which the herd is rotating into, since we have not had a single reading on either of them making the yardsticks.  The inference is that we are so badly trounced that either there is insufficient conviction or we have still a ways to go before we see more enthusiasm.  The bottom line is that we are still stuck in the mud.  Even the Biotech’s got clobbered today.

3. Let’s not forget the simplest and most reliable of requirements which are that the 50-dma must be flat, and the 4-dma, 9-dma and 17-dma must all come up through it at the 405 Freeway mark. The 50-dma is not flat at the moment, to say nothing of the 200-dma which is pointing down. Both items appear to be at least a week off for either the Nasdaq, or more so the NYSE at this time…though all our past history on this particular item has been on the Nasdaq.

4.  Sadly, on this occasion just like 2003, we have the black cross of the 50-dma below the 200-dma, so the expectations of the ceiling is at that very point of any rally before it peters out, if it even gets there.

5. The bigger question is whether we are truly at early 2003 or one stage removed from there at October 2002.  In which case we had plenty of Eurekas in that phase, but what is missing so far are the leaps and bounds of Price Gains that propelled the Nasdaq out of the basement back then.  In my blog I mentioned that we need some catalyst to cause this to happen.  Back in 2002 and 2003, everyone had thrown in the towel and more importantly had done so over three years, not less than one.  Somehow, I don’t feel the swamp is fully drained yet, nor is there the irrational exuberance to really come into the market with a vengeance, which is usually signaled by Eurekas.

6. What is more important is the extent of the Bingo count this time which is similar to back then, so it suggests at least we are seeing some signs of throwing in the towel, even though the VIX is relatively quiet.

7. If Industry Groups don’t show signs of improving towards the A and B column in a hurry, this attempted rally is little more than mostly bottom fishing and identifying some potential leaders for the next round trying to repair their bent up chart patterns into decent shapes.  We can take some comfort that the number of A’s have improved from 5 to 19 with the last two FTD’s and from 56 to 74 on the B’s.  That means we have a 60:40 split between the former and the C to E Groups, since as you know we have a count of 154 Groups.  I am sure today’s action will kill some of this again.

8. Now I know all the stock market forums are anxious to know whether FTD’s are enough of a signal to go by and we have both proved that it is no better than a toss of the coin, so it was comforting to see the second punch at it yesterday where at least the Nasdaq is showing a lot better response than the DOW, the S&P500 or the NYSE.  However, it seems to be two steps forward and one or two steps back, which does not allow for even holding overnight, leave alone a few days to weeks.  When one has three black crows without five white soldiers any rally is suspect.

9. It appears to me that Type 1 and 2 traders are the only people who can make money provided they are nimble, turn on a dime, and essentially moment or day trade.  Type 3 and 4 longer term investors are not going to miss a thing given what we have seen these past two weeks.

The bottom line is that it takes more than a couple of Eurekas to confirm a decent rally and if I left you with that impression then I feel sure I may have done so for most of my readers who are not so well versed with the dynamics as you are.  In which case, I would like to use your note to me and this response as a teaching tool on my blog by way of educating them and perhaps your readers that life is not that simple in Bear Markets.

Best regards, Ian.

The Wall of Worry Meter on Wall Street

Tuesday, August 5th, 2008

Mailbag Question:  Ian, This may be a real stupid question but here goes … being in such a volatile and highly out of the norm type market that we have seen in the past 10 months or so ( Bear or not ) … and being that we look for the NH’s ( over 125 – 150 ) to greatly outnumber the NL’s  in the ratio for start of the leg up … how can we realistically look at the Hi/Lo ratio now when they have been so overwhelmingly skewed to the Low side by such drastic numbers? With so many stocks ( and groups ) slaughtered to their low side … by the time any type of NH’s to appear in large numbers we may be so far into the recovery or next leg up that we miss the beginning.  Am I missing something here or maybe this one technical aspect not be as valid now as if we were in a semi-normal market ( again considering how absolutely and utterly whacked this market has gotten to the downside).This is just something that has been bugging me for some time as I look at the daily Hi/Lo ratio staying at such a DOWN situation for so long.  Yours, Steve 

               meter   

Answer:  Hi Steve, that is not a stupid question, as the last time we were stuck in a rut like this was in 2000 through 2002. The New Highs took a long time to come to the surface, since everything was cleaned out, and new Leadership had to regroup.  As we know there were still several decent bear market rallies during that time.  I tried to answer the mood of the market in my note on the blog, but the subject matter was essentially whether we had a legitimate Follow Through Day (FTD), and the caution that we might be headed for yet another disappointment and a failed rally:

  1. >>>”When a Market is so oversold as this one is, the tide goes out so far that most boats are still stuck in the mud, and it sometimes takes a pull back and a second effort to take off on a rally…that is why 50% of the Follow Through Days (FTD’s) fail on the first attempt and then move up on the second shot.  (Editor’s Note: It looks like we got it just in time!  A second follow through day with oomph.)  
  2. This is especially true in a Bear Market. It needs a one-two punch from the Bulls to drive it up, while at this stage of the game the Bears only need one punch from here to drive it down.  Net-net, the Bears have the upper hand after two weeks of trying by the Bulls.”<<<
  3. The net of all of that is that the Market is so oversold, and the rally so far classed as “Failed” in my eyes, especially after yesterday’s distribution day on a couple of the major Market Indexes.  The odds are that we should expect at least a retest of the lows before we will either see it hold for a double bottom or breakdown further.
  4. I will grant you that we should not put too much emphasis on the New Highs vs New Lows parameter, but at least I want to see New Lows stay DORMANT.  By that I mean that they have to stay below 30 (say) for a while to show that we have completely bottomed…and what do we have today (Monday) if I trot over to the WSJ Page? We got 32 New Highs and 124 New Lows on the NYSE…not good.  But let me accept your point for a moment and forget the New Highs showing some spark of life, since you make a very reasonable point.  At least you will give me the logic that New Lows had better stay dormant for starters, otherwise we have not truly bottomed.  But let’s look for other clues:


The Downside Gloom and Doom

  1. You will agree that for there to be any signs of real buying enthusiasm we must see irrational exuberance as expressed by Eurekas…not one my buddy on the NYSE. 
  2. In addition to that we need to see some Kahunas to show signs of excitement.  We got a couple of Little Kahunas on 7/29 and 7/30 on the NYSE, but then it was followed by one to the downside and three black crows for candlesticks. Where are the five white soldiers?  No cigar.
  3. I am a biggie on the McClellan Oscillator and more importantly the Summation Index.  We have not been this low since the Oct 1998 Asian Contagion, after which it took off like a rocket when the Banks banded together to solve the Japanese Financial run on the Yen, if my memory serves me correctly.  The message is it took a Catalyst of some good news to propel the market with vigor back then.  We are lower this time around, with a reading of -2874 on July 16th, when the previous low during all the kafuffle from 2000 to 2003 was no lower than -2218 on July 26, 2002.  On that occasion there was a bounce for seven weeks to 1294, only to fall back again for a month before it finally took off for a three month rally.  We have currently cut the -2605 by half to -1390, but no where near positive territory as yet…again implying there is no enthusiasm from the Bulls, leave alone irrational exuberance.osc

    4.  Staying with the internals, the next thing to turn our attention to is the extent of the Accumulation versus Distribution in both the Industry Groups and the Stocks themselves, and this was the central focus I provided in my note on the blog.  With that stake in the ground, we know that the %E’s hit the lowest ever recorded of over 34% a few weeks back as I showed in the newsletter.  I have also proved that if the %E’s are greater than 17% when a rally attempt is launched, we will invariably get a failed rally on the FIRST attempt from such depths.  That is precisely what has happened so far.

    a and e

    5. If we go by yesterday’s action all the old favorite commodity wolf packs are being trashed so that game is over for now.  We then look for rotation and where do we see it…Health Care, a bounce in beaten down Financials, a bounce in beaten down Home Builders, precious little in Technology (until today).  So yes there is money to be made in beaten down stuff but there is no beef.  The bottom line is that there is NO real Leadership right now.

    6.  Throw in the slowing down of Global markets, with Europe feeling the pinch of a Recession, Japan never getting off the mat at all, and so on and so forth.

    7. At times like these, one CANNOT separate the overall mood of the public from what spills over into all the talking heads discussions the various airways provide.  The net bottom line is that the every day John and Jane Doe are fed up to the hind teeth with the increasing cost of living, and all the “fru-frau” about Oil.   That, on top of the fact that the “Do Nothing Congress” has decided to go on vacation for five weeks and in effect run out the clock on what is the hot topic at every water cooler conversation and that is “To drill or not to drill…that is the question?”  Net-net, throw all the bums out, and John and Jane Doe have learned now is not the time to be “playing the stock market”.

    The Upside Hope for Sunshine

    So much for the downside; what about the upside?  I return to my Wall of Worry Meter on Wall Street.  There is the old cliché:  “The Market Climbs a Wall of Fear”.  We are now at the stage where this market needs a Catalyst; it’s as simple as that.  At a time like this when there are so many cross-currents, it is hard to narrow it down to one item, but I will offer three to perhaps give us a Summer Rally:

    1. Oil down below $100 will stop the hubbub at the water cooler; just as I gave you the XLF at a critical juncture to watch a few weeks back, watch USO.  We need to see it break down below 96 and fill the gap down between 95 and 94; and then make its way down to seek at least a low of 90.

    2. Oddly enough I feel the Olympics could be a Catalyst as China becomes front and center for the next two weeks.  You can rest assured there are background talks going on to reverse Wall Street’s downward slide that triggered a 40% sell-off in China Silverback Stocks, keep U.S. consumers buying China goods, and keep $1 trillion in U.S. dollar-based investments from free falling into an abyss, which in turn could rock the Chinese economy for years to come.

    3. Continued calming of the Financial Markets with easing of the credit crunch and keeping inflation in check, with no further easing or tightening at this juncture by the FED.  Net-net, we need a continued rise in the U.S. Dollar.

    Let’s hope one or all of these kick in before too long and we have some respite from the brutal weeks we have had. 

    Editor’s Note!  This was written last evening and e-mailed first thing this morning, and one never can tell with this tricky market.  Maybe we have seen a turn-around from all the gloom and doom and have finally got a big day upwards to compensate for all the woes of the past week.   This would be the one-two punch I was waiting for.   We might even have a Eureka signal after tonight’s download to cap it off!

    Best regards, Ian.

Copyright © 2007-2010 Ian Woodward
Disclaimer: Commentaries on this Blog are not to be construed as recommendations to buy or sell the market and/or specific securites. The consumer of the information is responsible for their own investment decisions.