Ian Woodward's Investing Blog

Archive for the ‘HGS Principles’ Category

The Follow Through Day (FTD)

Saturday, August 2nd, 2008

Mailbag Question: Dear Scottish John, not only haven’t we run out of time for #2 but hasn’t Mr. Market failed to fulfill most of those clues?  Therefore, shouldn’t we “Otherwise consider anything less as a Bounce Play and expect a retest of the lows.” Regards and much thanks, dave (If you didn’t know it, Ian is Scots for John.)

        races

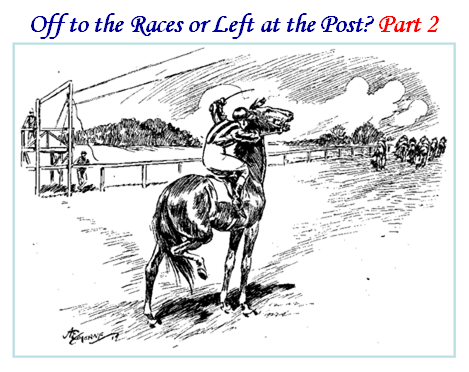
  • Please refresh your memory with the targets I set for the Bear Market rally to be more than a Bounce Play in an earlier blog with the same picture written on July 19, three blog notes back…which Dave is referring to. 

Hi Dave:  Move to the head of the class, your beady eyes have seen that SO FAR this is nothing but a Bounce Play and a failed Rally, and therefore as of right now the key sentence you plucked from my note is where the odds stand as of today, and the full answer should come next week; so your note is very timely.  Always have three current scenarios: 

  1. The Market goes down to retest the lows and the Bears are in command
  2. The Market hovers around sideways and then either goes up or down
  3. The Market is still oversold and the Bulls feel it is time to try again, since the Bears have not collared this by the scruff of the neck this past week. 
  • My point is nothing is ever cut and dried. Next week should tell us which way the wind is truly blowing, although it points to #1.  The reason I hesitate is that the INTERNALS of the market relating to Accumulation/Distribution have improved both for the Industry Groups and the Stocks themselves since July 19.
  • When a Market is so oversold as this one is, the tide goes out so far that most boats are still stuck in the mud, and it sometimes takes a pull back and a second effort to take off on a rally…that is why 50% of the Follow Through Days (FTD’s) fail on the first attempt and then move up on the second shot.
  • This is especially true in a Bear Market. It needs a one-two punch from the Bulls to drive it up, while at this stage of the game the Bears only need one punch from here to drive it down.  Net-net, the Bears have the upper hand after two weeks of trying by the Bulls. 
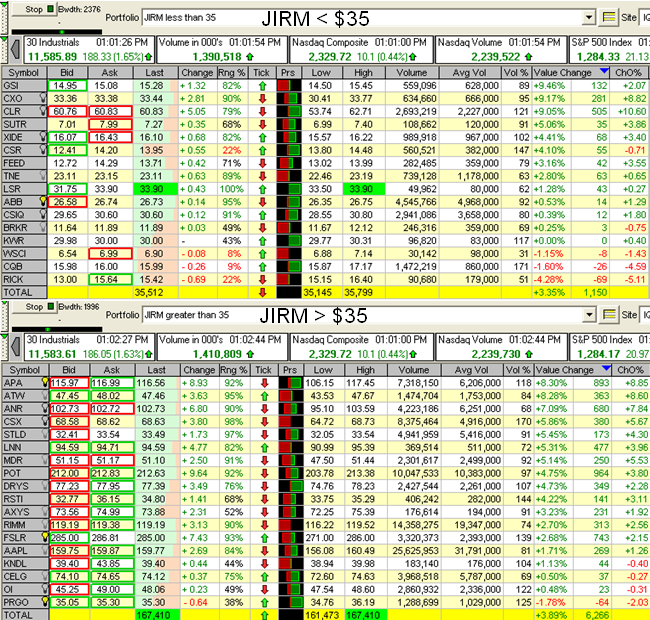
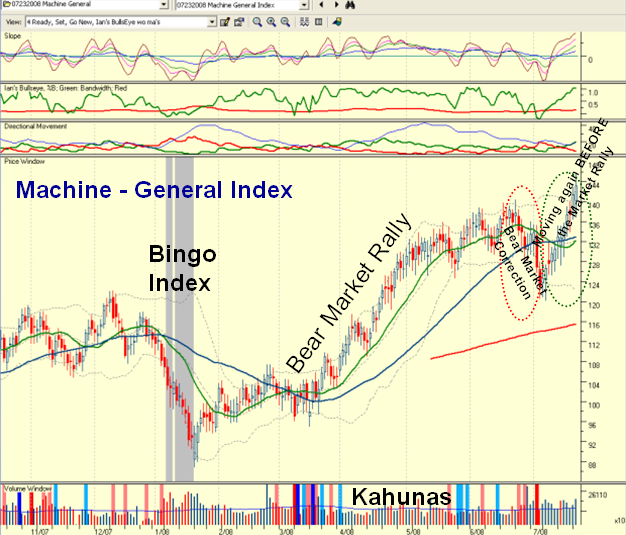
  • That should give you enough to chew on for an immediate response, but I will give you more in a blog I will put up over the weekend, which will show you the good stuff “Under the Hood” that makes me hesitate to say the “Party is Over”, period.  Since this note is buried in the comments section, I will resurrect it in its entirety to full view and repeat all this and add more in a fresh blog.  As promised, here is the picture of the good stuff “Under the Hood”.  Let me first set the context in which this picture gives a perspective of where we are regarding a successful or failed Bear Market Rally.  This coming week should determine the outcome.chart                         
  •  

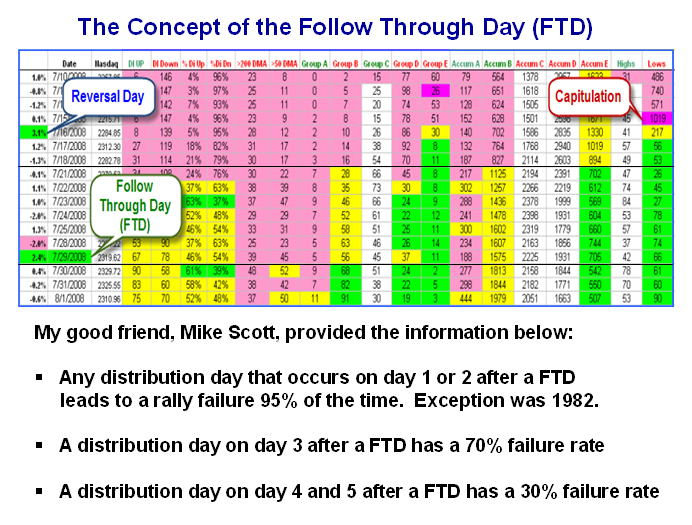
The Color picture shows very well the phases of red, yellow and green in the Industry Group and Stock Distribution turning to Accumulation as depicted by the Columns showing Group A to E, and Stocks with Accumulation from A to E. 

  1. The cycle starts when the market has peaked and we begin the downward slide, depicted by Bingo signals showing the RSI (14 periods) dipping further and further down below a reading of 30 on the NYSE.
  2. Ultimately, the Market will find a bottom, and this is usually signaled by a final Bingo which is called the Capitulation Day in which the number of New NYSE Lows give a major spike from previous readings. 
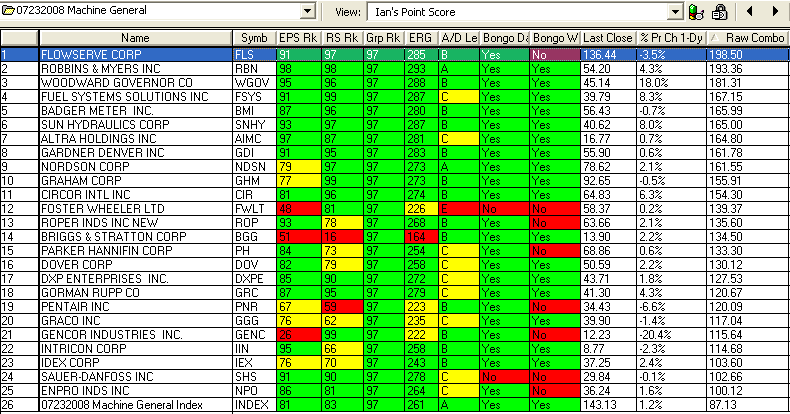
  3.  In this case the number of New Lows shown is the number of stocks in the HGSI Software Database, but to all intents and purposes you can see that the number of 1019 is almost double that than the previous day and it falls off dramatically the day after that.  One can’t help but notice the spike, and that is the first sign that the Bulls have thrown in the towel when it is a day of fear, and the VIX rises dramatically, usually spiking to a high.
  4. Invariably, the day’s Low will be a long spike down (a Tail) on the candlestick with the Market Close finishing much higher as the market decides to rebound.
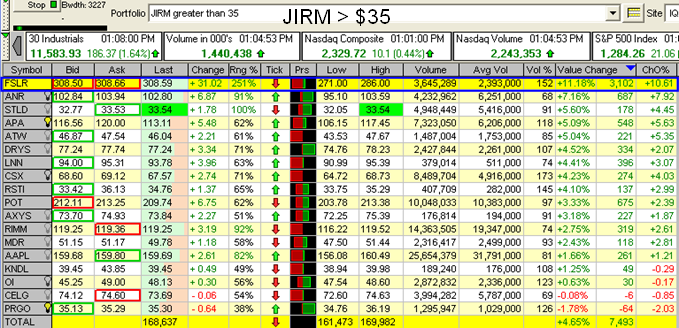
  5. If there is a true rebound then this Capitulation is quickly followed by a huge Reversal Day where the Nasdaq will deliver at least a 2.2% up day in Price gain, and in this case it was 3.1%, as shown on the above spreadsheet.
  6. Once we have a Reversal Day, the next item to look for is a Eureka Signal which shows the Bulls are in earnest and demonstrate “irrational exuberance” by clocking up at least 3:1 advances versus declines, 5.4:1 in Adv Vol to Dec Vol, and an ARMS reading of <0.6 on the NYSE, which as we all know is very bullish.
  7. These Eureka signals invariably appear within 12 days of the Reversal Day and there are at least two or three of them for good measure. 
  8. Meanwhile, we also keep a beady eye out for what has become known as the Follow Through Day (FTD), where the Nasdaq again delivers a strong up day both in Price and Volume.
  9. My work has shown that the “odds” of a FTD being successful is no more than 50%, i.e., a toss of the coin, and this is especially true in a Bear Market.
  10. As I show above, any distribution day that occurs within 5 days after an FTD diminishes the probability of a successful follow through day.  My thanks to Mike Scott for this information.
  11. After day five following an FTD, the probability of success increases if there has been no distribution and as the picture shows, we will not have reached that state until Tuesday of next week.
  12. The final and most important requirement for a successful FTD is the need for the NYSE New Highs to get above 100 and then stay above 150 while the New Lows diminish to less than 50 (say). 

Nothing in the Stock Market repeats itself consistently, but these are rules of thumb that over the past eight years have proven fairly reliable.   I have given you a step by step recital of the process and shown you a picture to help you along.  It is not that complicated as the net-net message comes down to a few basic points: 

  1. After a Capitulation Day expect a Reversal Day, and then a Follow Through Day within three to nine days. 
  2. Once you have a FTD, there should be no distribution days for five days thereafter.
  3. Eureka signals should register within 15 days of a Capitulation Day and if not the rally must be regarded as suspect.  New Highs on the NYSE must exceed 100 to 150 while New Lows go down rapidly to less than about 50.    

If any of these rules are violated it is probably a failed rally, and little more than a Bounce Play that will invariably end in a retest of the recent low to provide a double bottom or worse yet searching for a lower bottom.  As my friend Dave reminds me a strong clue that all is not well, particularly at this time of earnings reports, is when stocks deliver strong gains but there are failed breakouts galore or the stellar results are ignored and the stocks are pummeled.  The worst clobbering occurs when the results are reasonable but the guidance for the following quarter and/or year is lowered.


Best Regards, Ian.


Falling Crude Lifts the Mood; Beware of the Crosscurrents

Wednesday, July 30th, 2008

batman         

                                   batman 2 

 I couldn’t resist a tongue-in-cheek analogy to the hot topic around the country on this gasoline affair, and I am sure it will all eventually sort itself out, but not before the hubbub on the Price of Gas comes back down below $4.00 and a Barrel of Crude Oil dips below $100, and/or T. Boone Pickens Wind Plan comes to fruition, etc. etc.  Unfortunately, it is no laughing matter but the question is how do we as Investors and Traders deal with it?  The Market is telling us what to do:

Investors:  Stay in your foxhole and/or not only bottom fish, but dredge in beaten down Industry Groups that are showing signs of moving.  

  1. These include the recent hot Wolf Packs of the Solars, Steels, Fertilizers, Coal, Machine General, Railroads, and Energy Drilling…mostly hot today, but you must turn to trading these.  Coal is white hot today as are the Steels!
  2. Alternatively, you buy the Home Builders and Financials and pray you dredged correctly.  Today the Home Builders are getting whacked.
  3. Yet again, you can fiddle around with the Health Care Sector, and an occasional good Tech stock.
  4. Be aware that the small caps are outpacing the mid caps which in turn are doing better than the large caps…unless you are buying JIRM stocks. 
  5. But don’t say I didn’t warn you that Cash is King at the moment, unless you have it in a failing Bank!  Then, stuff it under the Mattress, even if it gets lumpy.
  6. Wait for a Eureka signal, and the New Highs at least >100, and then stay up there to average around 150.  This last point is EXTREMELY important, and I will show you why at the next Seminar in October.  Hurry, we have eight seats left. 

Traders:   

  1. Have your hot Wolf Packs at the ready as mentioned above, and trade the Flavor of the Day.  Add the JIRM Stocks to your Wolf Packs as shown below.
  2. What’s up today is down tomorrow so be prepared to turn on a dime and you must be nimble, take what the market will give you, have tight stops and stay glued to your screen. 
  3. If you have confidence in us and/or know your onions, then concentrate on the JIRM >$35 and JIRM <$35 for your best picks, given to you all of four months ago, and are still as good as ever considering the hammering the Market has taken:

 jirm       Late Breaking News:  First Solar reported earnings after the bell and it is flying high.  There’s your winky winky for tomorrow.  Watch the Solar Wolf Pack first thing tomorrow.  jirm 2       Best Regards, Ian.  �

A Case Study of the Machine-General Index and RBN

Wednesday, July 23rd, 2008

Mail-Bag Question: Ian, RBN is doing extremely well in this correction. Since it’s now extended what would you need to see in order to consider it a safe buy? Best Regards, Paul

rbn

Paul:  There is no “safe” time in this market.  You have picked one of the leaders in the Machine General Group which you identified as moving several days ago.

  1. If you were a Type 1 or Type 2 trader (moment or day trader), you would have pounced then.  Since you are not, and are more a Type 3 and mainly a Type 4 investor, you should stay in your fox hole.

  2. For the very short term, if you want to dabble, you are getting your second chance today…but wait, RBN is correcting back into the base having made a BRAND NEW High.   

  3. The Group is “HOT” once again and rising as a WOLFPACK against the grain. You should watch the Group Movement first and then the individual Stocks.  Today, the group is taking a breather, having been up several days in a row, so if $51.62 is the low today and the market doesn’t tank, your best chance to get in will be at below $52 for a BOUNCE Play with a tight stop.  But if you do, remember you have changed your stripes to be a Type 1 day or moment trader when you buy.

 index

  • FYI, without a lot of research, FLS, RBN, WGOV, FSYS, BMI and SNHY are the overall leaders, but you will notice that four of those five are all being hit today and FSYS has given up $2 from its follow through day today at $42.42 down to $40.25.  On the other hand, a terribly beaten down stock like GENC is up 18.43%, so you know that was a great bottom fish.

warehouse

  • The bottom line message is “Timing” my friend…and your trump card is “Nimble” with “Tight” Stops.  If you want to “dabble” in this market, you will need to adapt to those three points.  He who hesitates is lost.

  • Lastly, think Wolf Packs first and Stocks within the Wolf pack second, which I am glad to see you are doing. 
  • As I finish writing I see that at 10:47 Pacific Time, RBN has repaired to $52.19 with a bid/ask spread of $52.17 and $52.25, so that speaks well for a possible recovery, particularly if the market is once again on the trot.  If not, all bets are off.

tracker          Net-net…you snooze, you lose.   Best regards, Ian. 

Happy Days and Off to the Races?

Saturday, July 19th, 2008

IAN: IS THIS A CUB BEAR MARKET OR A FULL SIZE BEAR. i.e. HAPPY DAYS ARE HERE AGAIN???  XLF OFF TO THE RACES??   Bob


      races

Hi Bob, let’s review the bidding: 

  1. We are already in a “Full Size Bear”, i.e., >20% down from the high last Oct 11
  2. We just finished a Bear Market Rally of ~15% in two months from March 17 to May 19
  3. We have just had an Intermediate Correction on top of the Bear Market of ~17% down for two months to July 15, so this “cub” is a trifle bigger than we wish!
  4. We had Capitulation on July 15, where the XLF bottomed and produced $8 Billion Dollar Volume
  5. XLF bounced with last week’s shoring up by Bernanke and Paulson of Fannie May & Freddie Mac
  6. Whether XLF fully recovers or is just a bottom fish Bounce Play depends on the Markets.
  7. The Markets have bounced mainly on Short Covering these last three days
  8. The Markets recovering are dependent on:     
  • OIL continuing to drop     
  • The Dollar rising     
  • Strong EPS Reports over the next three weeks, beating estimates     
  • Institutions buying into Finance, Technology, Health-Care to replace loss of leadership in Oils   
  • Global Stability   
  • Inflation controlled, including Energy and Food Prices, which are killing the public at large 

Now that we have temporary Capitulation, What are the clues to look for in a Bear Market Rally? 

  1. A Strong Follow Through Day (FTD) with >2.5% rise in all Indexes and Nasdaq Volume >2.5 Billion
  2. This MUST occur in 3 to 12 days from the Low of July 15 
  3. HGS Investors will expect at least 2 or 3 Eurekas along with Kahuna signals
  4. By that time the New Highs on the NYSE must show at least 100 New Highs and <30 New Lows
  5. Ideally the New Highs should rise above 150 for several days with New Lows down at <30
  6. Technically we must get above the 17-dma, then up to 1334 on the S&P to the 50-dma
  7. That requires a 10% Bear Market Rally which is the minimum, since >15% is considered normal.
  8. Otherwise consider anything less as a Bounce Play and expect a retest of the lows

Net-net: Don’t expect Manna from heaven any time soon.  It will take a long time for this market to repair, and don’t be surprised if we trot down to 1150 on the S&P 500. 

Best Regards, Ian. 

Treasury Secretary Paulson – Bazookas versus Squirt Guns

Tuesday, July 15th, 2008

Treasury Secretary Henry Paulson and Federal Reserve Chairman Ben Bernanke explained the plan to prop up troubled mortgage-buyers Fannie Mae and Freddie Mac to members of the Senate Banking Committee.

bazookas

  • They faced questions about the cost to taxpayers, but Paulson didn’t put a dollar amount on the proposed aid, which gave some senators pause.  He drew the analogy of requesting a Bazooka in his pocket rather than being given a squirt gun. 
  • Congress must approve the plan, hammered out over the weekend by the Treasury and the Federal Reserve.
  •  “I think you could be risking the taxpayers’ dollar here,” said Sen. Richard Shelby, R-Ala. the panel’s top Republican. “To give you a blank check…I’m not sure.” 
  • With that remark, you can guess where the plan will end up…IMHO on the shelf with more trouble to come. 
  • Ask the stock market which once again yawned at the Administration and Congress’ stalemate in getting anything done.  It’s a sad commentary.

SEC to limit naked shorting of Fannie, Freddie, brokers 

  • Christopher Cox, chairman of the Securities and Exchange Commission, said on Tuesday that the regulator will try to limit so-called naked shorting of shares in Fannie Mae, Freddie Mac and primary dealers. The SEC will issue an emergency order stating that all short sales of shares in these companies will be subject to a “pre-borrow” requirement, Cox explained. The SEC is also planning more rule-making focused on the broader market, Cox said. 
  • Naked Shorting has been illegal for years, but the SEC has turned a blind eye to it until now when their hands were forced, and then only in a limited sense.  If history repeats itself this too will be forgotten when the hubbub dies down. 

Crude Oil Down >$6 a Barrel 

  • Crude futures Tuesday closed down more than $6 a barrel, the biggest daily drop in more than 17 years, as concerns that slowing economic growth will dampen oil demand triggered a broad sell-off in energy commodities.  It buoyed the market for most of the day, but then with that big a drop and the dollar bouncing back a little, the market died in the last hour and was down 93 points!  It shows how weak the market is.

The Banking ETF, XLF hit a New Low and a New High in $ Volume! 

  • The Banking ETF, XLF, went in sync with the day’s speeches and confirms that there was a ray of speculative hope that a bottom had been reached, but then it swooned.dow

xlf

The VIX is moving towards a high 

  • The VIX bounced to 30.55 within 35 minutes of the open and it looked as if it would spike up to the 34ish that all are looking for to see a full capitulation, but no such luck with it backing off to 28.54 at the end of the day. 

Intel Ray of Hope for Technology stocks after hours 

  • Intel came in with a 25% rise in profits, Revenues of $9.47 Billion with Gross Margins of 55% in their after hours EPS report and may offer a ray of sunshine for the Tech Sector tomorrow. 

 Net-net…we should be thankful for small mercies that Crude dropped, the Dollar rose, and INTC had a blockbuster EPS Report.   Best Regards, Ian.

Copyright © 2007-2010 Ian Woodward
Disclaimer: Commentaries on this Blog are not to be construed as recommendations to buy or sell the market and/or specific securites. The consumer of the information is responsible for their own investment decisions.