Ian Woodward's Investing Blog

Stock Market: Rounded Top Action for the Festive Season
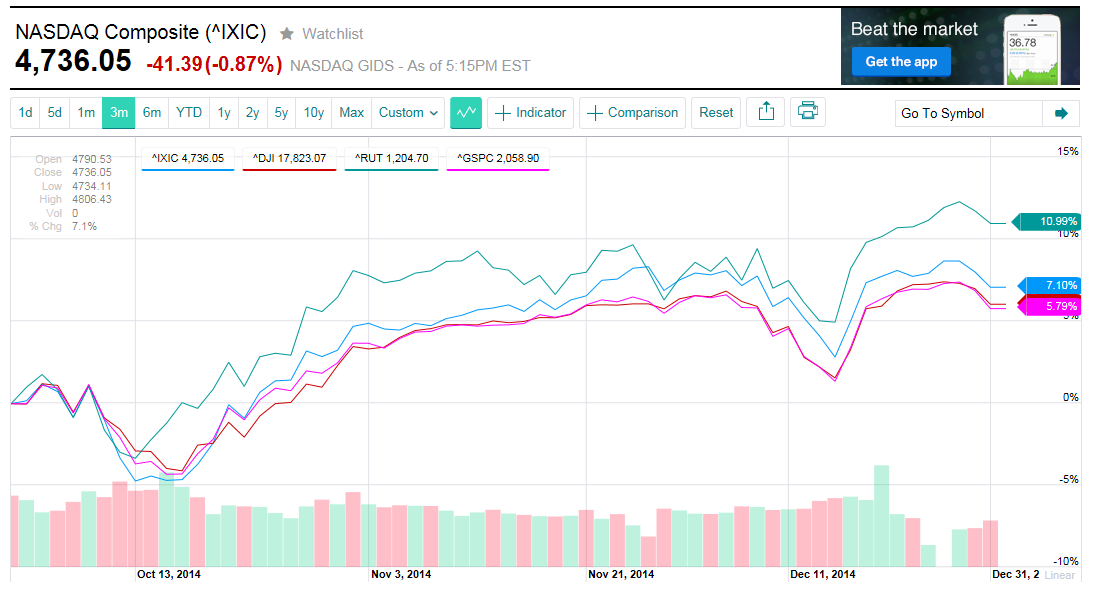
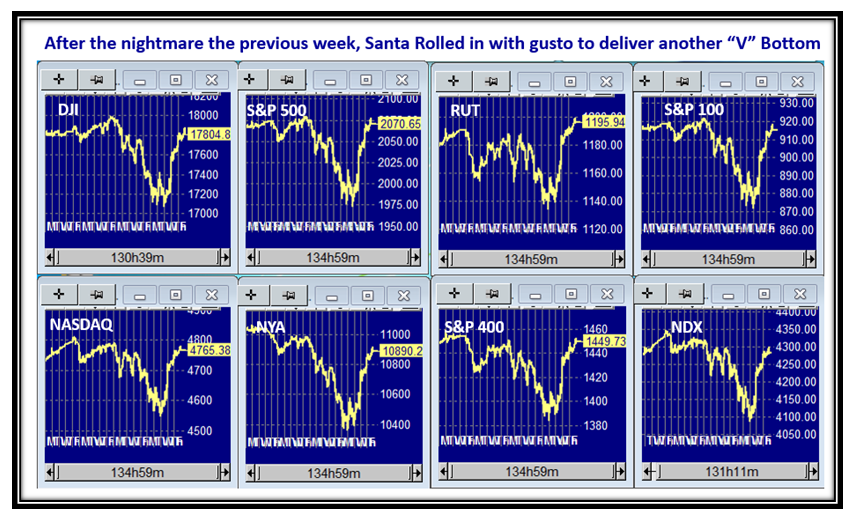
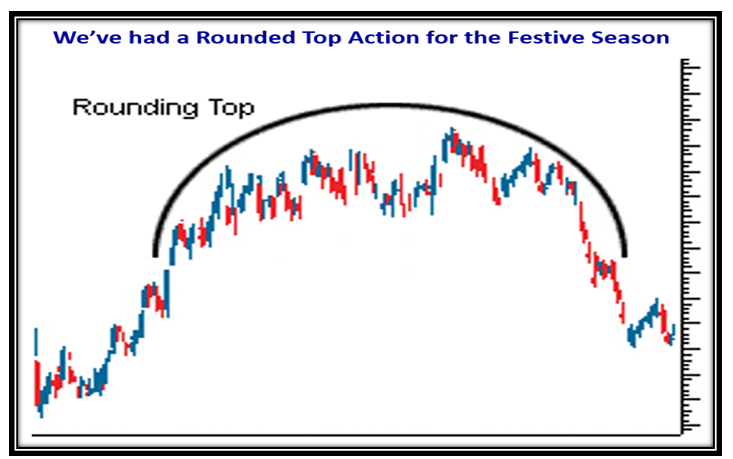
January 10th, 2015

After a long Rally for Thanksgiving, the Stock Market has been a nightmare to trade in, up down and round about!

Picture Rounded

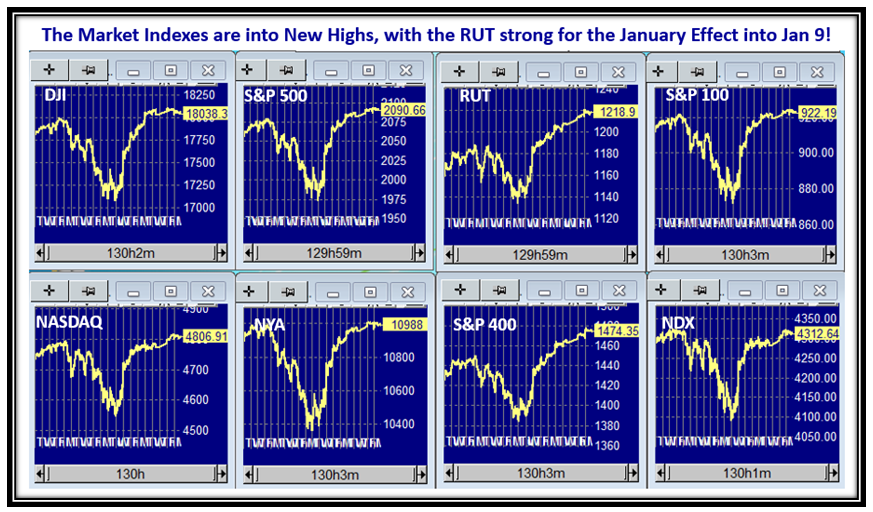
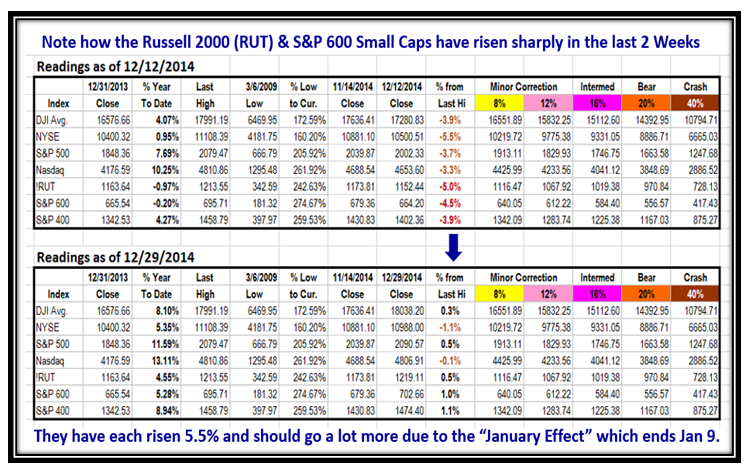
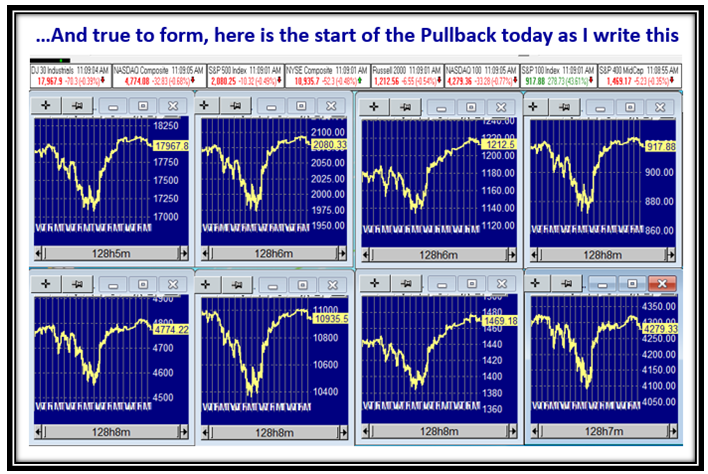
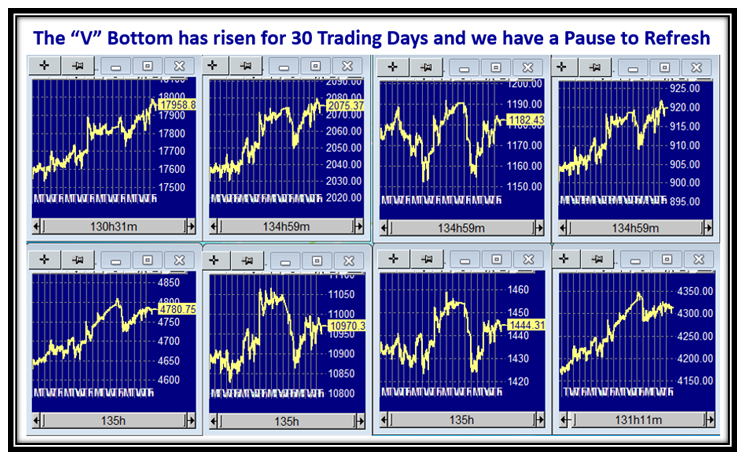
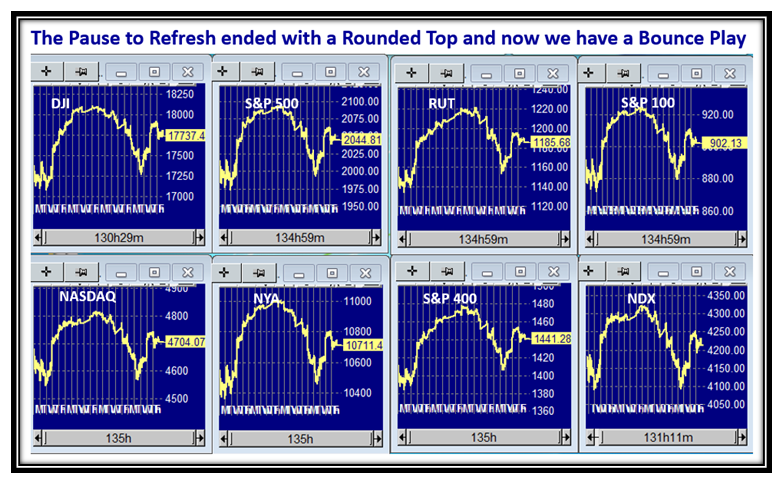
…And to prove it, here is the action of the Major Market Indexes over the last 20 Days:

Picture Indexes

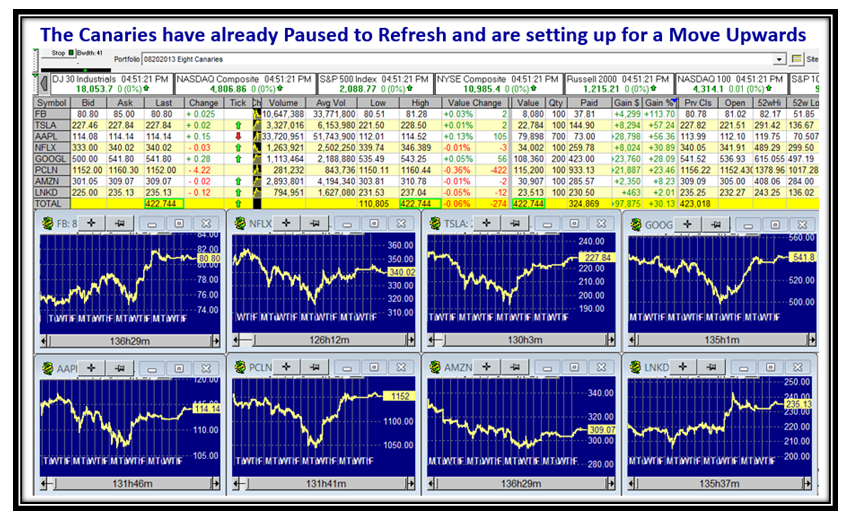
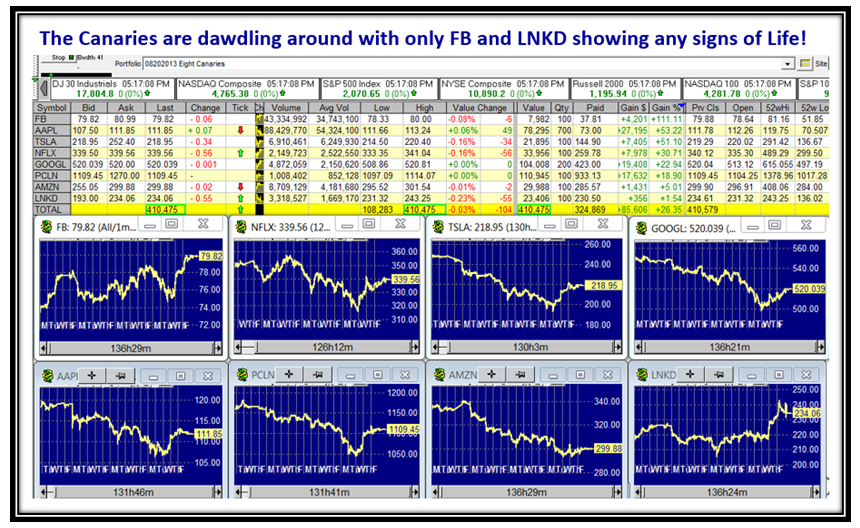
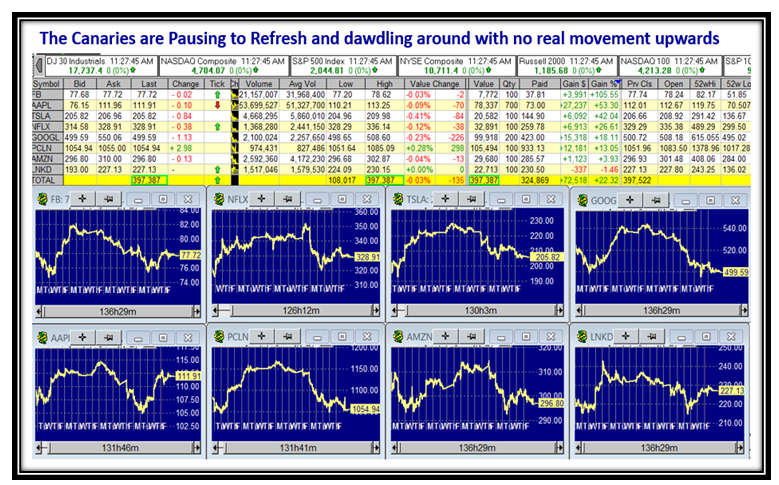
Likewise, the Canaries have been trotting around doing nothing spectacular:

Picture Canaries

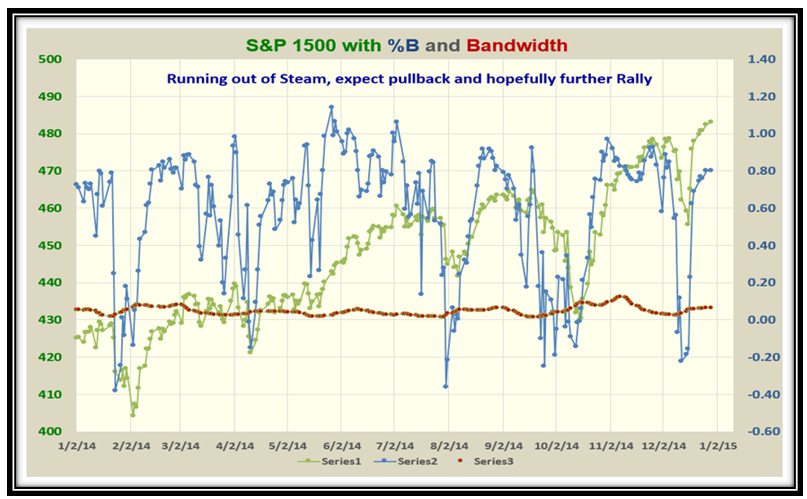
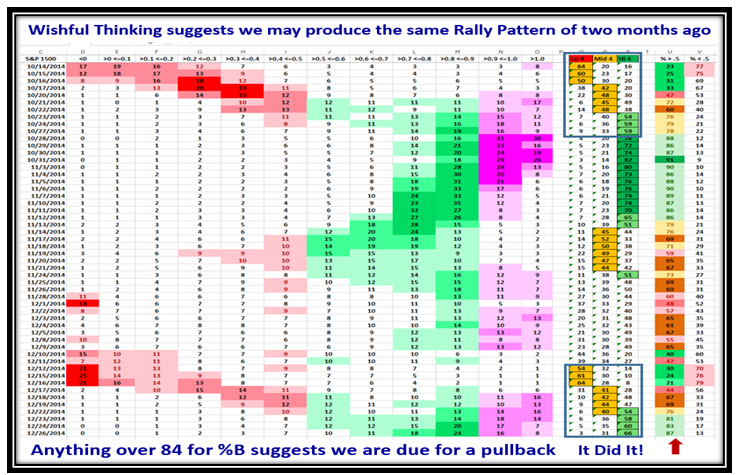
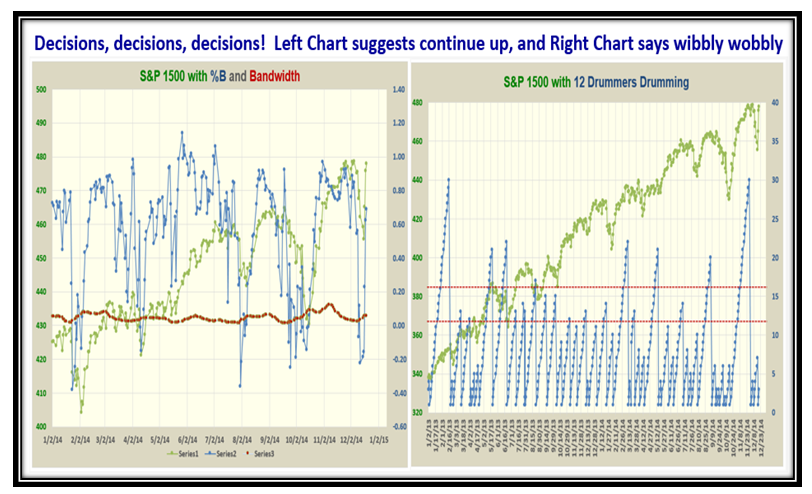
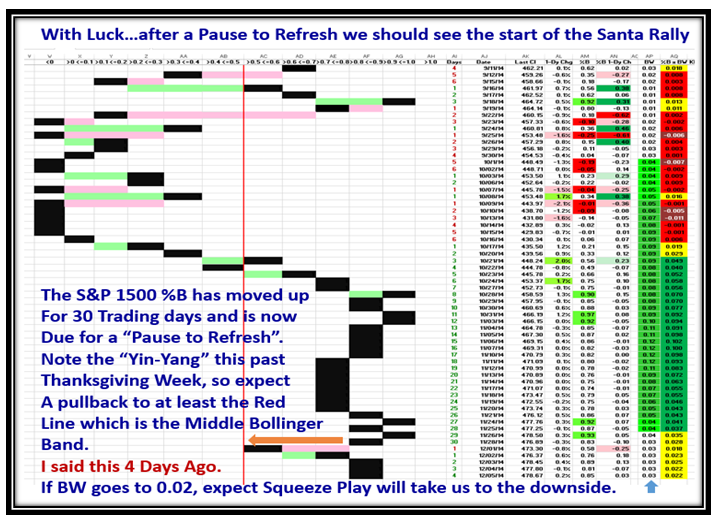
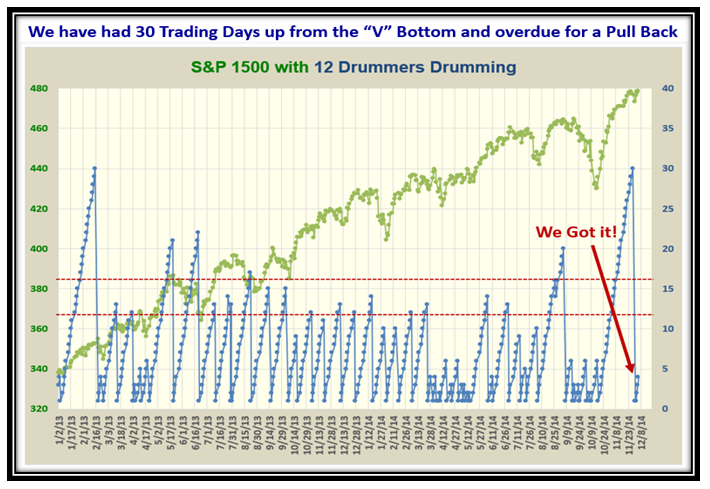
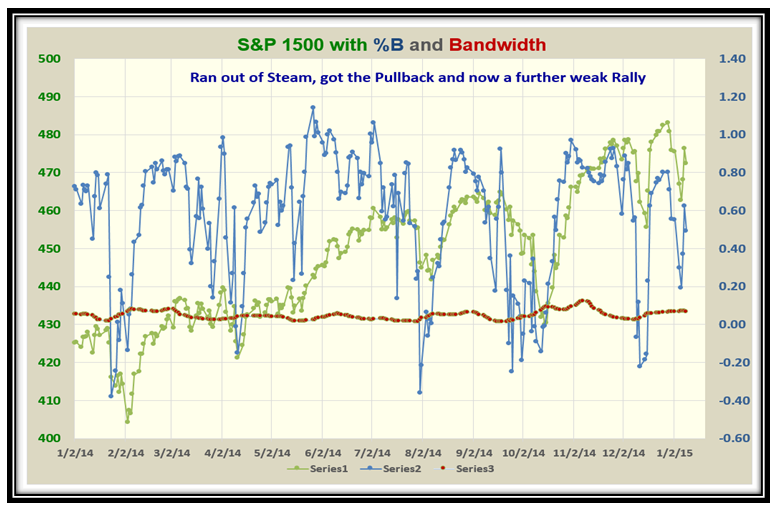
The S&P 1500 %B shot up with the Thanksgiving period and then has wobbled around with a weak Rally:

Picture S&P1500

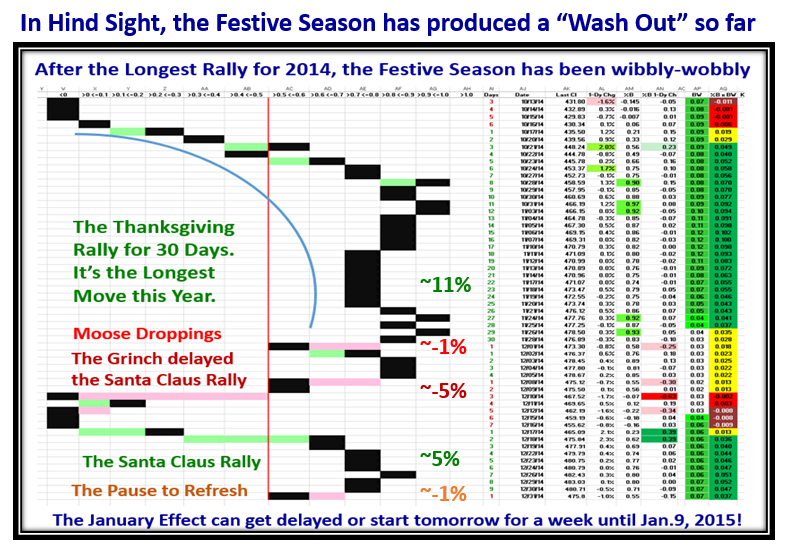
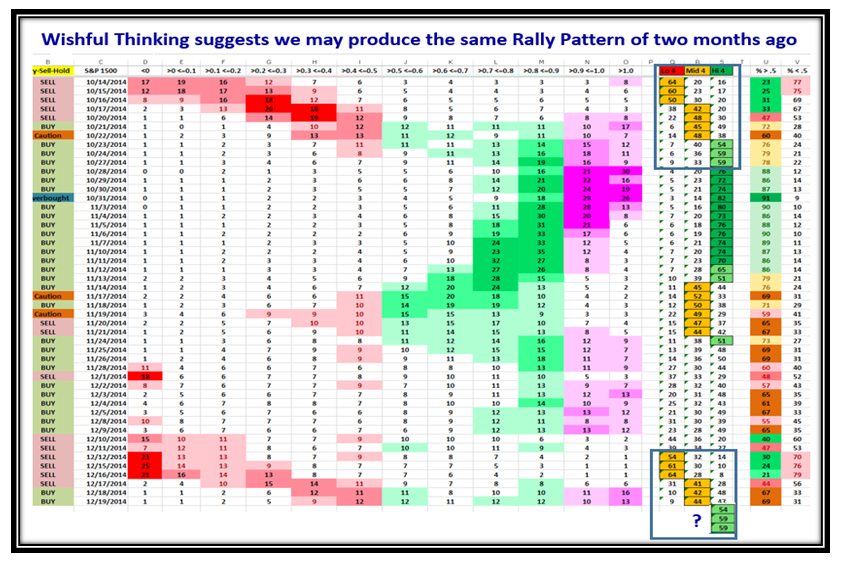
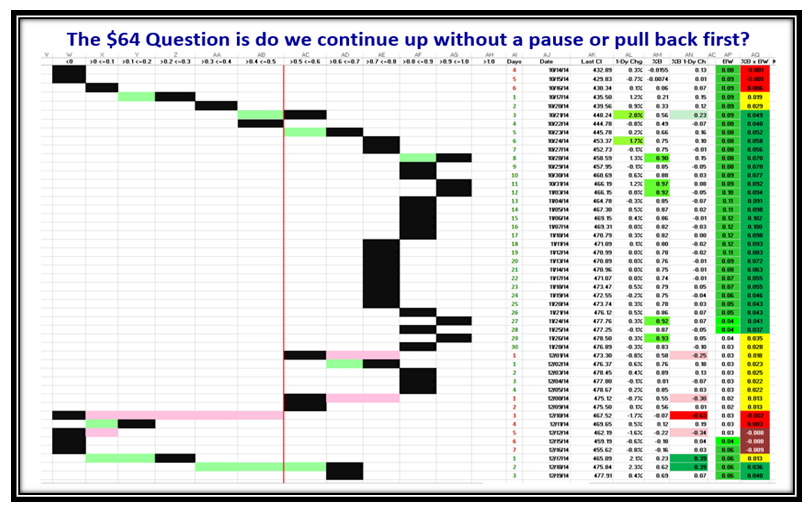
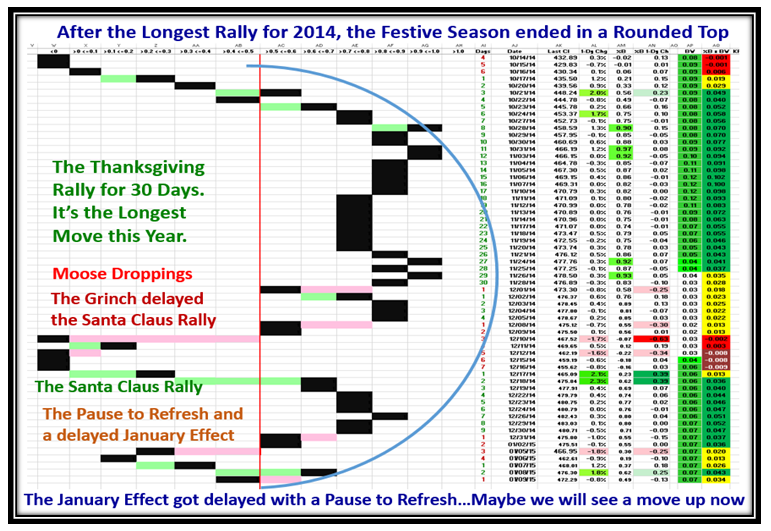
This next chart demonstrates the various phases we have suffered after the strong period prior to Thanksgiving:

Picture Pat

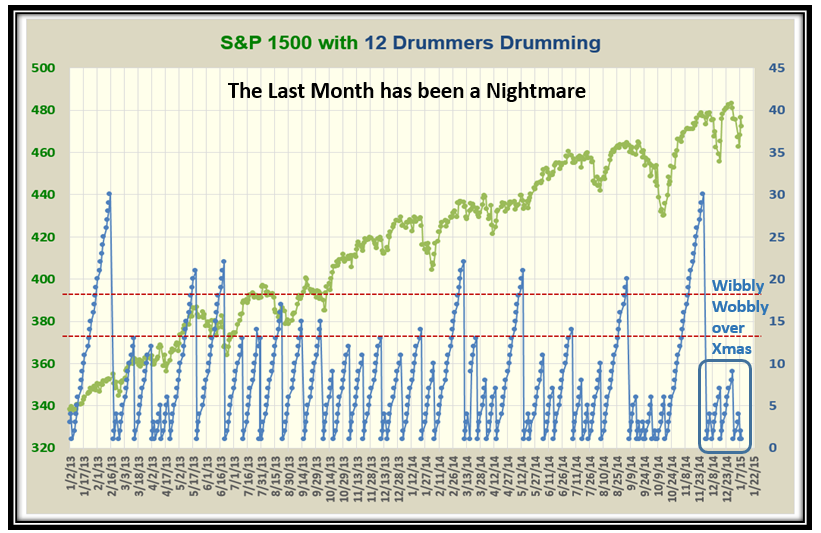
The Twelve Drummers Drumming chart shows the periods of up, down and sideways very well, and we see recent turmoil:

Picture Drummers

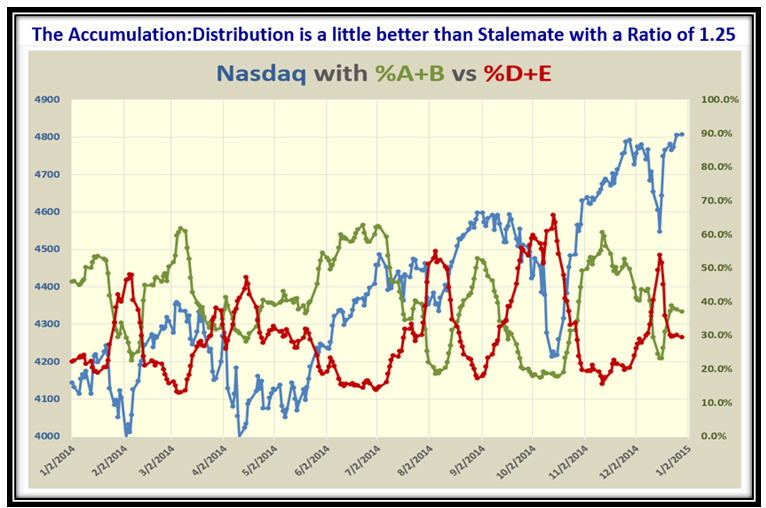
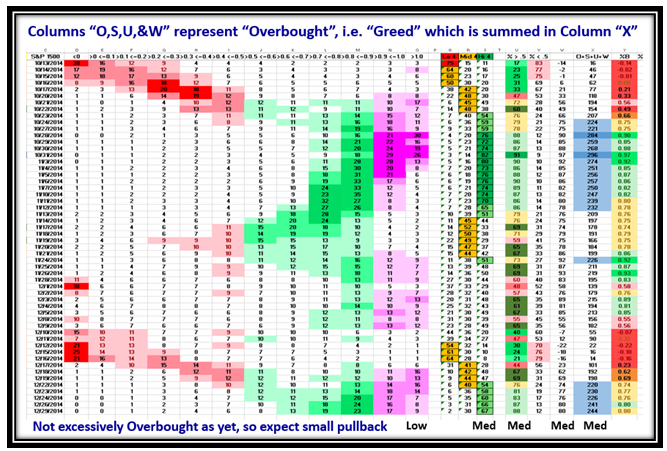
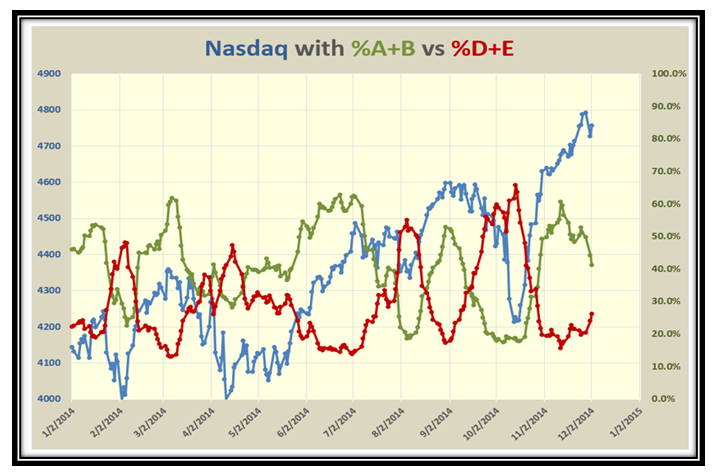
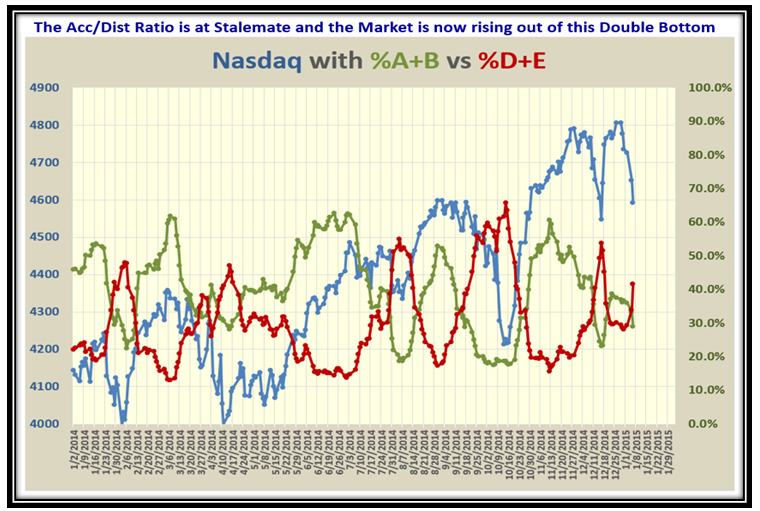
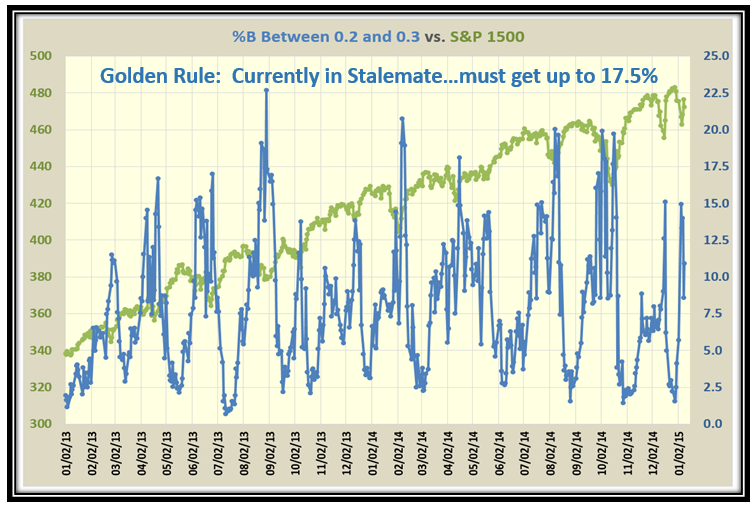
This chart shows clearly the Stalemate we are in with %A+B below %D+E stocks under Accumulation/Distribution:

Picture abcde

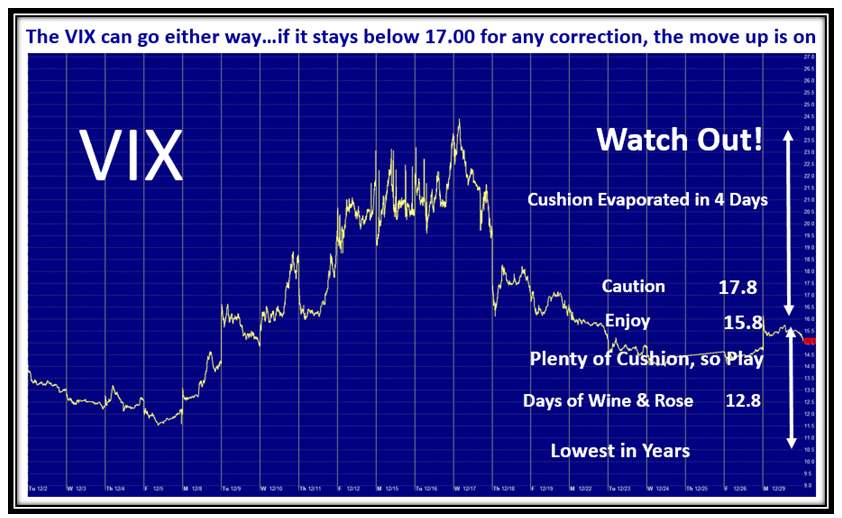
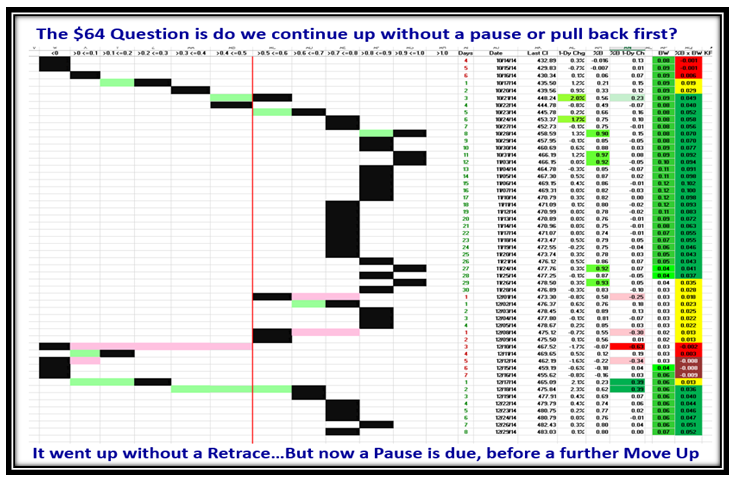
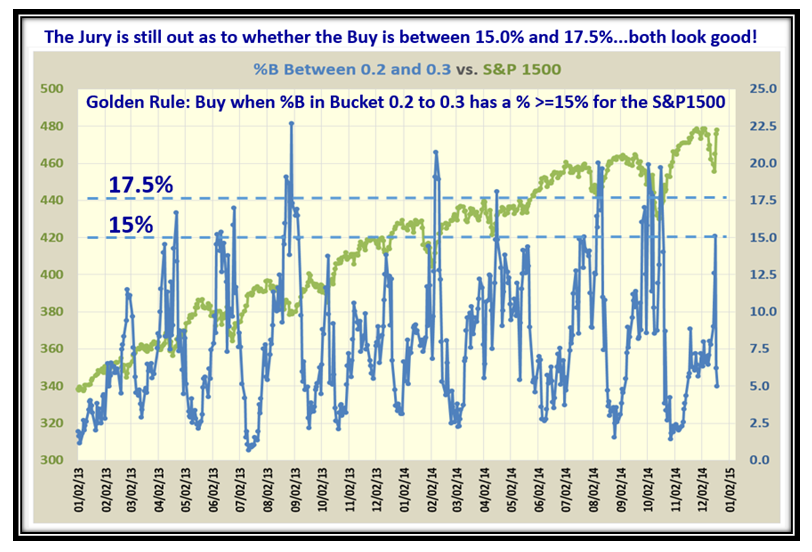
As I have taught you in previous recent charts, the biggest clue as to when the Market has completed correction is when the % of Stocks in Bucket 0.2 to 0.3 is >17.5%.  We are currently at ~11.0% so we are not there yet and we need to be patient…hence, the market can go in either direction starting next week:

Picture Percent B

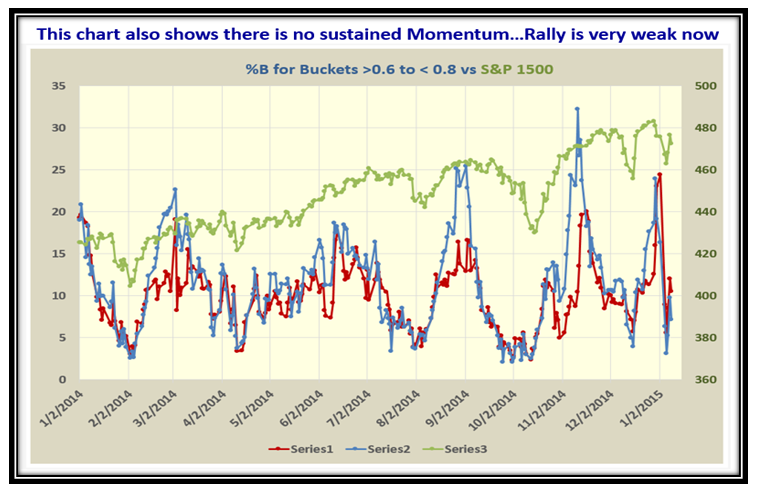
…And, as you would expect, when we examine a higher Range of %B, such as Buckets >0.6 and <0.8, the Rally is very weak:

Picture Percent B2

Net-Net, the January Effect was delayed and essentially fizzled, so we shall see if the Small Cap stocks pick up from here.  Be patient and remember the stake in the ground at this point in time between the Bulls vs. Bears is Stalemate:

Happy New Year!

Ian.

Stock Market: January Effect and Types of Investors

January 1st, 2015


A long term follower and supporter of my work wrote me a note about the January Effect and here is my response which I felt I should share with you all to explain our different definitions, especially to help new readers:

Ian – always appreciated. However, please straighten me out.

Effect Picture

I have worked on the definition of January Effect of small cap buying years ago starting in first to middle of December and then buying started running earlier into November and even October. If you look at the 3 month chart the Russ 2k outperformed the other 3 main indexes and the same if you go from 1 December. Here is the link to the 3 mo chart (+ 11%) and can easily be read for 1 month with the same comparison.

I have never subscribed to Santa (folks said he didn’t exist when I was a kid) as some of my best gains have been after 12/25. However, the market then usually sells the January effect the first week (sometimes the first trading day but more like end of the first week) and then January is positive by the end of the month.  Tell me where I have been going wrong all these years?

Thanks,  Bruce

Thank you Bruce and for your contributions to this bb over time.  We go back almost 25 years, and you have always been the “guru” of small cap stock investing, so your insights are always valuable, and you are not wrong over these many years…only different. 
 
As you well know in my book, our audience consists of 4 Types of Investor.  Types 1&2 are essentially short term Traders, while Types 3&4 are longer term Investors.  The majority of our clientele are Type 3 who look for opportunities over a few weeks to a few months.  I’m assuming your bias is towards Type 4 and therefore longer than most.  So your comments are very well put.
 
As time has passed us by since 20 years ago with the progress of the Internet in real time and High Frequency Traders (HFTs), they have also seen that until there is a Clean Out ala March 2003 and 2009 when a Fresh Rally truly begins, many have also realized that they must dabble as Type 2 shorter term traders if they are to engage the market 
 
My comments around the festive season are always with this in mind and I use the standard definition of the first week in the New Year as the January Effect.  It’s aimed at trying to accommodate the Types 1 and 2’s at such times.  My Blog Notes over the years reflect that.
 
Here then in a nutshell is what I have suggested with my recent Blog Notes.  Some 35 new supporters from Vietnam have found some nuggets in the last couple of posts, and I wish you all a Happy New Year with the following gift to you all:
Effect Pat
Best Regards, and Happy New Year to you all.
Ian

Stock Market: The Pullback Before the January Effect

December 30th, 2014

The Grinch dampened the Santa Claus Rally, but the January Effect is still on the cards.

January Picture

The Market Indexes are now Pausing to Refresh and with luck we should see the January Effect kick in soon:

January Indexes

The Canaries have already Paused to Refresh, and are ready to move again:

January Canaries

The VIX has moved up today with the pullback in the Indexes, but if it stays below 17.0 we have room to move up:

January VIX

%B for the S&P 1500 is at 0.80 and running out of steam, so we are now into a pullback today as expected:

January B

The Acc/Dist Ratio is only 1.25 so there is plenty of room for the Markets to go up:

January abcde

True to form the Small Caps have already started their run for the January Effect, but expect more moves higher:

January big foot

Looking at the low, mid and upper four buckets may have some value as to direction so we will watch this item:

January 4 buckets

We have risen 7 days in a row so we are due for a pullback which is underway as I write this note:

January Pat

Here is some research I showed you four years ago, and worth noting at this time for the Market being Overbought:

January overbought

Here is new research hot off the press relating to finding additional value for Overbought Markets…enjoy!

January overbought3

…And would you believe it the pullback is here as I write this with half an hour to go to Market Close:

January Pullback

Happy New Year to you all…give us some feedback on all of this good stuff!

Ian

Stock Market: Santa’s Late Delivery…Better Late than Never!

December 21st, 2014

It’s that time of the year with just four days to Christmas Day, and at long last the Santa Claus Rally seems to be on its way.  But don’t count your chickens before they are hatched, but the last three days have been encouraging:

Late Picture

I have always recommended that one should have three scenarios, “Up, Down and Sideways” and let the Market tell you which one it is on.  We had another “V” Bottom two weeks ago and inside three days this past week we are back up to essentially the old highs.

Late Indexes

The previous Leaders and Glamour stocks I call Canaries are not leading except for FB and LNKD:

Late Canaries

The VIX has fallen back from nearly going into Oscillation, but we are without a reasonable cushion, and the VIX can go either way, though the feel is that it is headed down which is good for the Market:

Late VIX

The concept of looking at the % of stocks in the Top, Middle and Bottom four buckets is proving interesting and we shall see if the pattern of a couple of months ago are repeated again to confirm there may be value in the concept:

Late Buckets

…And here is the sharp fall followed by the quick recovery in a matter of ten trading days…but now what’s next?

Late Pat

Let’s look at the latest set of charts I have introduced you to, to get a flavor of which way the wind is blowing.

Late Bucket 4

Late Decisions

The next three days should give us a clue of which factors rule the roost at a point of indecision such as this is.  Good luck to you all and Happy Holidays to all of you around the globe at this holiday time!  Thank you for your support.

Best Regards,

Ian.

Stock Market: All Eyes Looking for a Santa Claus Rally

December 6th, 2014

I used this Picture six years ago to kick off the Santa Claus Rally, and we have a repeat this past week!

Santa Picture

The Bounce Play off the “V” Bottom has been very impressive with 30 Trading days up, so we had the expected pullback and Pause to Refresh this past week.

Santa Indexes

Fortunately the Volatility Index VIX is quiet, so there is room to play until one gets really cautious again:

Santa VIX

The Accumulation:Distribution Ratio couldn’t maintain the high number of 3:1 and so it has backed off with expectations to go to stalemate at 1:1 sooner than later.

Santa abcde

With 30 consecutive trading days up, it was high time for a Pause to Refresh and it was an easy call to make which I did last week:

Santa Pat

The Twelve Drummers Drumming History over the last two years has now established the longest run at 30 Trading Days, so this will become a valuable yardstick to bear in mind for future long rallies:

Santa drummers

Enjoy your weekend.  Best Regards,

Ian.

Copyright © 2007-2010 Ian Woodward
Disclaimer: Commentaries on this Blog are not to be construed as recommendations to buy or sell the market and/or specific securites. The consumer of the information is responsible for their own investment decisions.