Ian Woodward's Investing Blog

Archive for September, 2007

The Latest Feature of HGSI…The Hindenburg Omen Indicator

Sunday, September 30th, 2007

Hindenburg Picture

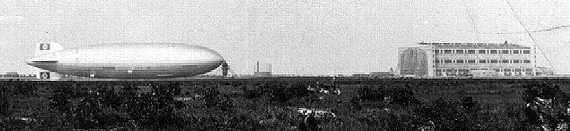
A technical indicator named after the famous crash of the German airship of the late 1930s. The Hindenburg omen was developed to predict the potential for a financial market correction. It is created by monitoring the number of securities that form new 52-week highs relative to the number of securities that form new 52-week lows – the number of securities must be abnormally large. This criteria is deemed to be met when both numbers are greater than 2.2% of the total number of issues that trade on the NYSE (for that specific day). 

For those who are interested in understanding the development of this Indicator, I suggest you Google using Hindenburg Omen and then select the following article, which is the second one down on the list: “Safe Haven – The Past Performance of the Hindenburg Omen Stock Market Crash Signals 1985 -2005”.  

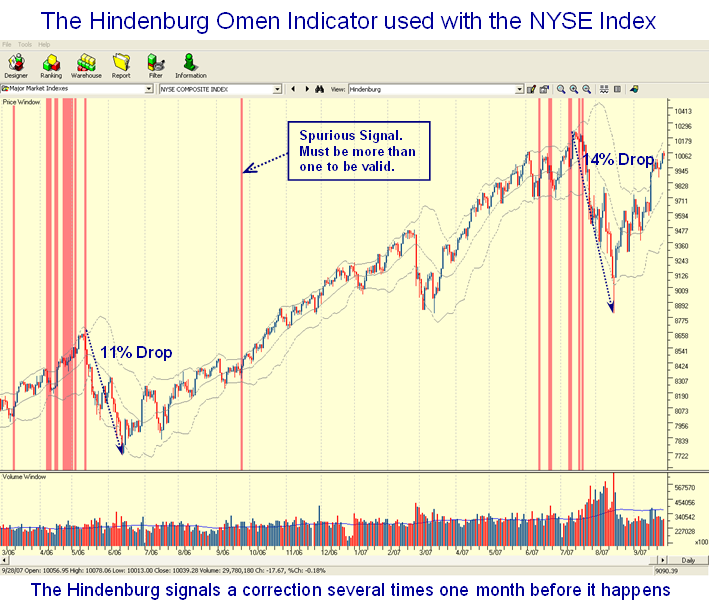
In reading this document, we find that their evaluation of past signals indicate a 77.2% probability that a stock market decline of at least 5% will occur in the S&P 500.  There is a 54.5% probability that a sharp decline of greater than 8% will occur as happened in the most recent corrections in 2006 and 2007.  There is also a 25% probability of a market crash defined as a >15% correction will occur after we get a confirmed (more than one in a cluster) Hindenburg Omen.  As you will see from the Chart View below we have dodged two such bullets in the past year.  Since the correction is now over for the recent one in 2007, one would expect there will need to be a similar series of signals before there is a renewed warning that a correction is imminent be it 5%, 15% or something in between.  Note that the value of the indicator is that it seems to take at least one month before one gets a sufficient cluster to occur, giving ample warning.  HGSI users will also be shown that during this cluster formation in 2006 and 2007, there was a Eureka signal which we know occurs after a long bull rally before a decline occurs.  All of this will be discussed in the October 27 to 29 Seminar. 

Those who are users of the Monthly Newsletter have known that we were in the process of developing a way to simply depicting the Hindenburg Omen Indicator using the proprietary Visual Filter Back-Test (VFB) feature, and I am happy to say that those attending the October Seminar will be the first to see it included in the Chart Views.   

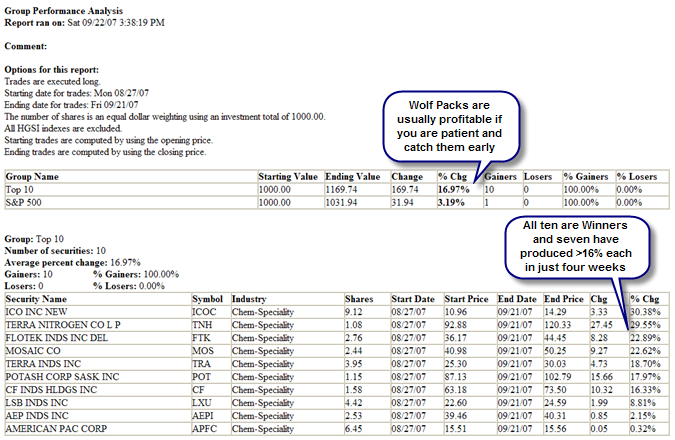
However, I felt all of you would like a sneak preview of this Indicator and demonstrate to you its value in the last two significant corrections in the view below.  The HGSI software is the only known software that has this feature included in its bag of tricks and joins the other unique indicators we have developed over the years including Eureka, Kahuna, and Tsunami which I described in one of my earliest notes on this blog.  This view demonstrates the value of the HGSI software in depicting the two most recent big corrections as shown in 2006 and recently in 2007.

Hindenburg Omen

The bottom line is that when these signals occur in a cluster, it is time to sit up and take notice.  That is precisely why we feel this Indicator will be of tremendous value to HGSI Software users.  To be fore-warned is to be fore-armed, and HGSI users will be fore-warned from now on.

Best Regards, Ian.

Market’s Up, Surf’s Up – My Blue Heaven!

Thursday, September 27th, 2007

Blue Heaven

There are just four weeks left till there will be a “Gathering of the Clans” here in Sunny Palos Verdes for the October 27 to 29 HGSI Seminar, just 15 miles south of the LAX Airport and what better place to be than to taste a bit of my Blue Heaven?!  We look forward to seeing you all and there are still seats available if you are thinking of coming.  Sign up on the highgrowthstock.com web-site, and we appreciate your support.   A couple of notes back I said the shape of the Index Chart patterns suggested we were getting ready for the second leg of a High Tight Flag and it seems we are on that path right now.  You can tell when the High Growth Stocks are in fashion when our good friend Dave Steckler hits six out of ten so far this week in his 10% club…those stocks that give a pop for 10%.  You have to be nimble and take the money off the table, but its Blue Heaven when one can do that so often.  Likewise the list of 18 stocks has been percolating along since I mentioned them in the Gladiator Blog of September 5, 2007.  Those showing negative results had their day in the sun just a couple of weeks ago, so one has to be fairly nimble, though an overall 10% in 3 weeks is quite feasible.  Just use the filter in the September Newsletter and you will have winners these days. blue Heaven StocksWe are fast approaching the 4th quarter, and as we well know the S&P 500 has been up 13 years out of the last 15 with an average gain of 6.3% and 7.2% over the last five years in the 4th qtr.  The two negative years were 1994 and 2000, so we shall see what 2007 brings us.  That suggests we should be up a further 100 points between friends on the S&P 500 by year end.  This should take us to around 1630.  Best Regards, Ian. 


I’m Sitting on Top of the World

Tuesday, September 25th, 2007

sitting 

After just five weeks of turmoil, grief, and then joy who would have thought that we are just a stones throw from reaching a double top on the Market Indexes.  Never count your chickens before they are hatched, but I thought you would enjoy a view from the Top of Mount Everest.  Having planted a flag in one of the earlier notes to declare the Bulls as winners of Round #1, which was to get above the Major Line in the Sand for the Nasdaq above the 50-dma, our next objective is to hit double tops or better on the Indexes and earn that view while sitting on top of the world.   Before we look at that challenge, let’s review the bidding on “Whence we have come from” and what we have learned. 

  1. .  After a recovery from a low, we need to plant the Base Low.  That is the starting point for the next leg.  If it fails we uproot the Stake in the Ground, but once we get into new high territory, it becomes the New Base Low.  That Base Low for the Nasdaq is 2387 and for the S&P 500 is 1371.
  2. Recall I said that “V” bottoms are very rare, but this time we had one.  Every single one of us were waiting for a retest of the lows, but in marched the Grand Old Duke of York, Ben Bernanke with not one but two magic wands.  The lesson learned is to never underestimate what the Fed will do, especially when it comes to propping up the Financial Industry.  For sure the Bears feel cheated, but their day will come later.   
  3. We need to step back one phase and recognize that the big hue and cry was that we hadn’t had a 10% correction in over four years and once we reached a climax run to the top, it was painfully obvious that with all the media hype that correction had to be achieved.  Please understand that the ground rules for measuring the correction is from the IMPRINT High to the IMPRINT low and not from Close to Close.  So as far as I am concerned that requirement has been met as we had an 11.7% correction on the S&P 500, which was all the folklore fuss was about in the first place.  For the record, the Nasdaq had a 12.4% correction, which as we well know also meets the criteria of an Intermediate Correction.
  4. What we also learned is that if one is to have a V bottom then we need to see a reverse Head and Shoulders, which is the strongest formation one can have to battle the possibility of a double bottom.  You will recall I showed you that with my Sherlock Holmes Flyspecking picture. 
  5. Now I know that many of us did not want to test the waters especially as I emphasized that we had never had so many days with 200 points up and then down and then up again all within the span of a week.  I called it a yo-yo market.  Don’t forget this clue…a low above a low above a low is usually a sign that the market is repairing and when you have the same of three higher highs then for sure it is time to pull the trigger.   
  6. Another objective is to make sure that the Market Indexes are above the 50-dma, and then select the one index which has exploded up the best, in this case it was the Nasdaq 100 (NDX).  Once you have spotted that, focus on why and go with the leaders.  The reason is that with the reduction in rates the dollar was weak and therefore favored Large Cap Multinationals, and since the Financials had been trashed there was need for Technology to take up the slack.  Besides, I am sure you will recall that the second quarter EPS reports for the usual suspects were excellent such as RIMM, GOOG, AAPL, CSCO, etc. 
  7. We learned that successful Bounce Plays need to achieve at least 10% to 11% before there is a hope that the Indexes have a chance to recover from an Intermediate Correction.   
  8. Along the way we learnt the value of spotting Wolf Packs, and that if you are patient one can make >15% in a month which is not shabby.  Likewise, it is wise to pick stocks that have decent ERG but are true leaders with an RS of 87 or greater.  We proved that with the Game Plan Index.  
  9. Anyone who hasn’t participated in this rally is now scratching their heads since they are staring at double tops which are not far away. With that big boost from Bernanke when the Nasdaq and all the other Indexes had a huge up day on September 18 with the Nasdaq hoisting a Flagpole of nearly 70 points, it was only natural to expect the makings of a flag, i.e., a pause to refresh with the Market Indexes going sideways for the past four days to all intents and purposes.   

The Upside Scenario: I recently reminded you that the Requirements for the next round for the Bulls to continue to win are:      

  •  Drive to the old high at 2725.  The Nasdaq is currently at 2683.    
  • Stay above the 50-dma on the downside which is at 2589. 

After a brief pause to refresh, the Nasdaq must drive above the old high for the new bull run to be fully underway.  The Lines in the Sand are between 2589 and 2725 for Round #2.     The second leg of a High Tight Flag is a minimum of 70% of the first leg, and since we are but 57 points away, that next target of 2725 is certainly reachable.  Beyond that, we also know how to apply the High Jump Rules of Thumb for both Stocks and Indexes.  The most important one at this time is 10% up from the 200-dma on the Nasdaq which takes us to 2775.  Therefore the odds are that if this Market runs up the second leg of a High Tight Flag that the correction will occur somewhere between the Old High of 2725 and the 10% High Jump of 2775. 

The Downside Scenario: Unless the Nasdaq breaks 2589 on the downside, this market remains bullish.  Note how the 50-dma now becomes the first line of defense and once broken then one resets the target to the 200-dma at 2523 and then the Base Low of 2387.  Likewise with the S&P 500, the three downside lines in the sand are at the 50-dma at 1480, then the 200-dma at 1454 and lastly the New Base Low of 1371.  Looking at the numbers for the 50-dma and 200-dma of 1480 and 1465 shows there is strong support now at that level, and any breakdown below this would be viewed as significant.   

I gave you the entire process in the blog called “The Road to Success – Following the Signposts” including the Road Map for the various scenarios, so use it and come up with the equivalent for the Nasdaq and now you are golden.  The Market tells you which road we are on, and not you trying to dictate where you wish it to go.  It’s not difficult if you stick to these Principles of High Growth Stock Investing.

Summary Simplified Plan:

targets

Best Regards, Ian

Wolf Packs to Watch

Sunday, September 23rd, 2007

 Two Wolf Packs

Since my associate Ron Brown is basking in the sun in Italy, I thought I would give you a bonus this weekend to get your jollies (hopes) up and help you through withdrawal symptoms while he is away for the next two weeks.   Following up on my note of yesterday, here are two Wolf Packs to Watch for this coming week.  In the view above, I show the Energy Drilling which has a Ian Slow of 60, but note that its 3 week % Chg is much higher at 82.  Likewise, as you can see from the colors, the momentum has been increasing during the last three weeks.  Below that I show the same two views for Internet Software, and here again you can see that although the Ian Slow Rel Str is 67, the % Chg for three weeks is a healthy 90.  

In the views below, I have identified ten stocks from each group.  Please don’t get excited if your screens don’t turn up the same stocks…just go with the flow.  My suggestion is to pop these two Groups of ten stocks each in Quote Tracker or E-Signal, or Trade Station or whatever other real-time software you have and watch them relative to the Market.  If they are healthy then you know what to do.  If they are not moving wait for another day and see if they go then.  If the Market is rotten and these groups don’t go, it’s a busted play and you have lost nothing!  More importantly, the purpose of this exercise is to see if these are the right Wolf Packs for this week and if the concept works as a general rule.  It’s always “Your Call”.  The most important point is that all of this is only possible using the unique tools we have in the HGSI Software.   

Best regards, Ian

Wolf Pack Stocks 

Recall the Wolf Pack – A Prettier Picture Now!

Saturday, September 22nd, 2007

Wolves

Four weeks ago I showed you the value of finding a Wolf Pack, stocks that were moving in a group, and I gave you a pack of ten to watch.  One month later I bring them back to show you it wasn’t just a pretty picture, but that this Wolf Pack of Chemical Specialty turned up trumps. 17% in a month with all positive and seven of the ten producing >16% is impressive.  Enjoy your weekend and sharpen your pencils to find the next wolf pack.  It’s easy in HGSI.   Best regards, Ian.

Wolf Pack Results

Copyright © 2007-2010 Ian Woodward
Disclaimer: Commentaries on this Blog are not to be construed as recommendations to buy or sell the market and/or specific securites. The consumer of the information is responsible for their own investment decisions.