Bridge Over Troubled Waters
Santa came in on his sleigh, calmed the troubled waters for this past week and provided a bridge to the Santa Claus Rally and January Effect through glowing Earnings Reports from Research in Motion (RIMM) and Oracle Corp. Likewise, shares of Nike Inc. had their biggest gain in six months after the world’s largest athletic shoemaker posted a 10% rise in profit, led by gains in Europe and Asia. The Dow Jones Industrial Average
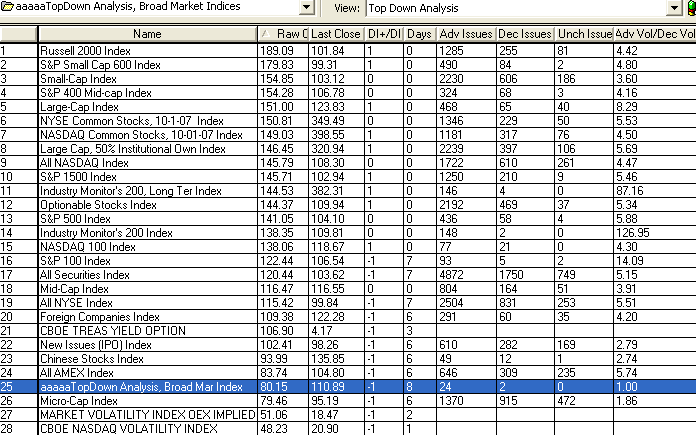
What should also stiffen the Bull’s backs is that the Small Cap Indexes such as the Russell 2000 (RUT) and the Small Cap S&P 600 Indexes had the best day on Friday and bodes well for a continuation of the rally into the January Effect. Note the following insights from the Chart of the Top’s Down Analysis that my good friend Ron Brown always uses in his weekly movies:
-
The Russell 2000 Index and Small Cap 600 Index are at the top of the list
-
This was a strong Accumulation day which included Triple Witching with Advancing Issues and Advancing Volume leading the Decliners by wide margins of 5:1…between friends.
-
The Volatility Indexes are at the bottom which is a good sign.
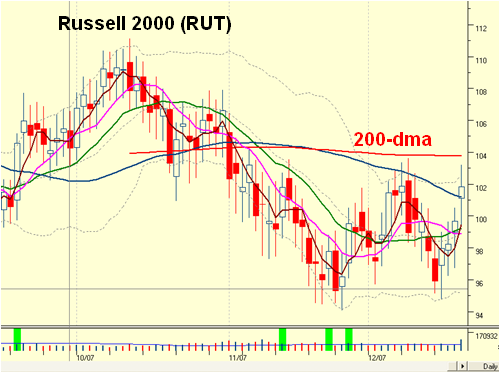
Please don’t misunderstand me in that the Large Cap Leaders are still leading…witness the explosive move naturally from RIMM. However, what I am suggesting is that if this Rally is to continue just make sure you watch the Russell 2000 for this next week or two to make sure the momentum is still fanning the January Effect. The RUT chart pattern is in a trading range and has been the weakest of most of the indexes, so it still has a ways to go to get above the 200-dma. However that is precisely what we need to watch to see if the momentum is strong enough to blow through that resistance or whether it will fizzle out as usual at or near the 200-dma. As you can see from the chart below, the 50-dma (blue line) is already below the 200-dma, red line which in itself shows how weak the small cap index is. If this Index blows through the 200-dma, that could give fillip to the entire market in the short term as the other indexes are a lot stronger.
Best regards, Ian.
 Ian Woodward's Investing Blog


