Ian Woodward's Investing Blog

Archive for April, 2008

The Value of the High Jump at Climax Runs

Wednesday, April 30th, 2008
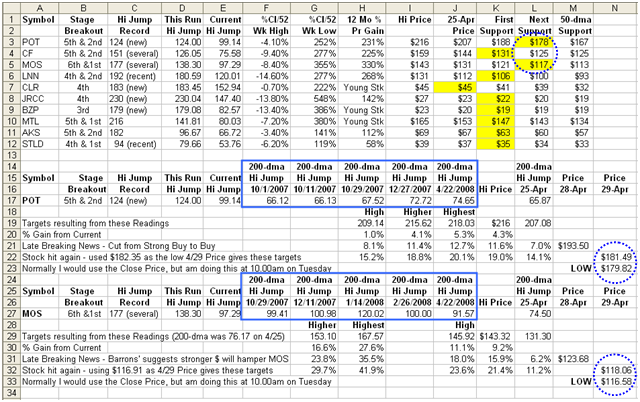
  • Mailbag Comment:  Ian – you stated that “Time and again the stock will correct at a certain % up from the 200-dma ONCE it has established its high, higher and highest jumps.” Would you mind elaborating further on this statement?  I interpret this as meaning I should look for three successive high jumps, each succeeding one higher that its predecessor.  When I use the 200 DMA high jump I look back several years and attempt to establish an average highest value among the series values for the period.  Is this an incorrect application of the 200 DMA high jump? Mike

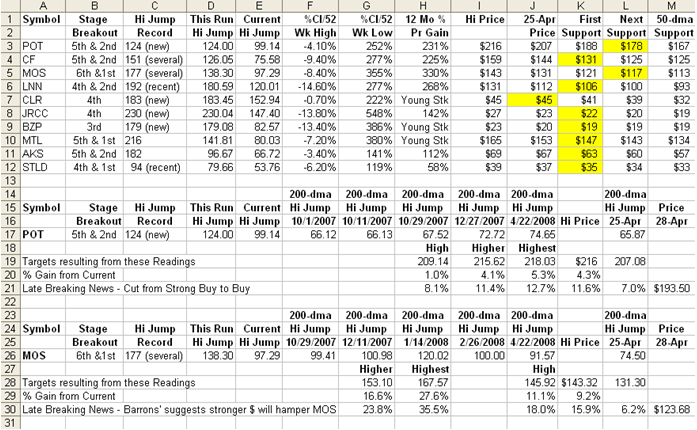
  • Response: Hi Mike:  I’m glad you asked that question as I sense many have not fully understood the full value of the High Jump Tool or how to interpret what it tells you. POT and MOS are excellent examples when people can either make a super bundle or get caught for a big loss in profits in the fight over Fear, Hope and Greed, especially if they are asleep at the switch. 

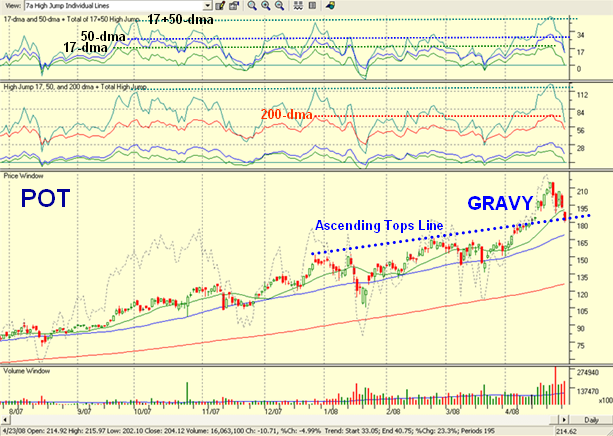
  • Let me give you the step-by-step answer of what I meant and in this case the devil is in the details on the chart, which I have since updated, to include yesterday’s Close and Low Price for both POT and MOS.  In addition, I have included a chart of POT to show that the horizontal lines for the 17-dma, 50-dma, 200-dma and Total High Jump were all screaming TAKE THE GRAVY:   

ss 

  1. I have blocked the 200-dma High Jump for several time frames for both POT and MOS as shown on the spreadsheet in blue above. In the case of POT, since it was VERY obvious that it was going into a parabolic extension especially with a gap up, it could exceed 72.72% for the 200-dma High Jump and produce a brand new High Jump record overall.  It did get above 72.72% but only just at 74.65%.  However, anything above 72.72% is extra gravy.     
  2. NEVER use Averages of the High, Higher and Highest, as you will invariably sell too low and miss the gravy.  That is why I call it the High Jump…it happens very seldom (remember the analogy I discuss of the Olympics?)  It gives the best feel for when you are just being too greedy.  Sure you can buy puts to safeguard yourself, but at Earnings due time coupled with an Exhaustion Gap Up and a Climax Run in the Stock, there is little point when the gravy is for sure going to get swallowed once the news is out.  Better to come back in when the coast is clear.  Buying Puts at other times is certainly a valid strategy to safeguard a move that one expects to continue.  By the same token, don’t forget to use the limbo bar which is the lows as shown on the chart when it is safe to buy back in.   
  3. As mentioned above, I repeat that in addition to using the total High Jump, it pays to see the patterns for the individual components of the 200-dma High Jump in particular and the 17+50-dma Combo as additional guides. 
  4. Also, I always draw an ascending tops line as I said in my note from the previous two highs to visually see that the stock is headed into a climax run.  That invariably tells me that I am in “super danger extension territory” and that I should expect that the PREVIOUS Highest Jump recorded is most likely going to be taken out.  If the new record is SUBSTANTIALLY higher it suggests that this highest jump will probably not be exceeded for a long time from now on.  That does not seem to be the case for POT right now, especially as the fertilizer story is not yet finished given the global requirements which keep growing.  However, it needs to hold at support of less than 25% to 30% from its 52 Week High Close, which it has not yet exceeded, and is another reason for my showing that information on the spreadsheet.  If it exceeds that, the stock has to regroup as did AAPL, BIDU, GOOG and RIMM have done from their recent correction, exacerbated by the Bear Market, i.e. a complete clean out.


    pot


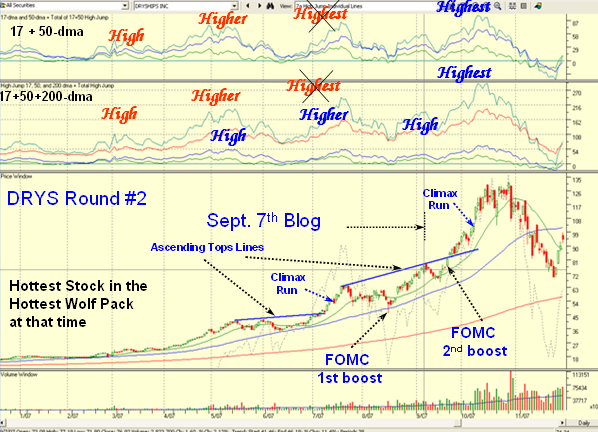
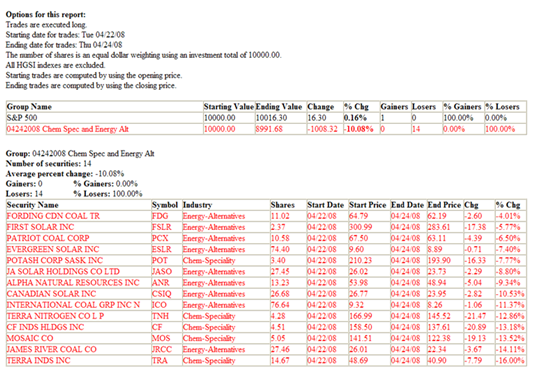
    On the other hand, with regard to that last point of the new record being substantially higher, please see the reprise on Dry Ships (DRYS) below.  I also strongly advise newbies and oldies to re-read my blog of September 7, 2007 where I gave complete treatment to DRYS at the time.  For your convenience I show you the chart from that Blog note on Sept. 7 and then show what happened after that note.

    drys 

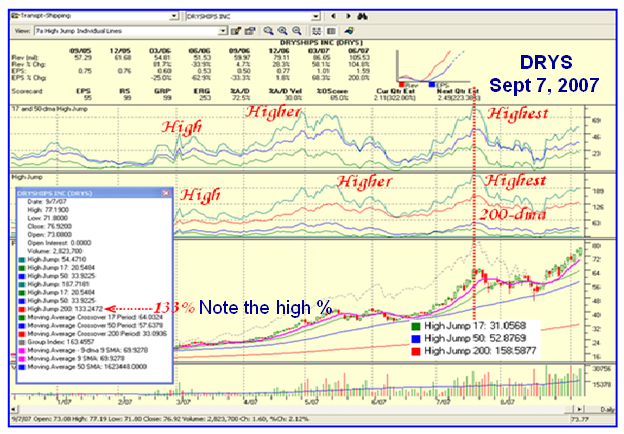
    Note that the stock corrected two days after that date, but with the boost of the FOMC actions it then went into a major climax run and peaked at the same time as all the Market Indexes, before a deep correction as shown below:

    drys2 Best Regards, Ian.

Helicopter Ben to Pop In Again!

Tuesday, April 29th, 2008

It’s again that time of the month when everything stops for a visit from Helicopter Ben.

 ben

I bet you have all long since forgotten the blog I put up on January 10th and 11th when he made that speech that the Fed was ready to take “Substantive Additional Action” relating to the Credit Crunch, and the Market yawned and in effect said “Where’s the Beef?”  I warned you then and it is time to resurrect the slide I gave you that the Line in the Sand at Nasdaq 2440 would be critical when we got back to it.  The reason is that there was a sea change in the psyche of the Stock Market that did not get changed for the better until we had slid into a Bear Market Correction.  Here’s the picture I put together later in February when the Stock Market dipped into that correction:

chart

I have Late Breaking News for you that on the eve of the FOMC making their latest statement that we have gradually climbed back out of the mire and would you believe it…we are sitting a hair’s breadth away from that fateful Line in the Sand. Fortunately the later actions the Fed took to stave off a deep Bear Market and a certain recession at that time, if we are not already in it, have given us a Bear Market Rally to bring us back to the Line in the Sand.  Here is the Updated Picture:


apr chart 

  1. In my opinion, it is not a coincidence that today was a jittery day for the leading stocks fat with profits that got hammered from head to toe.  We shall see what tomorrow brings, but be rest assured that although the Fed’s action may at most produce another 25 basis points reduction in the Fed rate (and many feel they might not do anything), it will be the words that will speak louder than the actions this time.  At long last Inflation, the Price of Oil and Food and the slide of the Dollar are of more concern, in my opinion. 
  2. Meanwhile, back at the ranch, the VIX has laid dormant for all of 20 trading days and for the first time poked its %B head above the Bandwidth today…a sign that could lead to the Bear’s dancing once again. What will it take for the VIX Bear followers to do cartwheels that their patience has been rewarded?  My crystal ball says an immediate bounce of the VIX from 20.24 to 21.56 will do the trick and that too will depend on what the Fed has to say tomorrow.  Otherwise anything below a reading of 20.00 will suggest more ambling sideways with a dormant VIX, and there may be hope for the Bulls to continue upwards. 
  3. In summary, we have a confluence of forces at this point in time between the Line in the Sand at 2440 on the Nasdaq, the Rotation vs Correction discussion, the VIX laying quiet, the Earnings Reports, all waiting for a nudge as to which way for the Market Indexes to go.  That nudge will likely come from Helicopter Ben popping in on us tomorrow. 

Best Regards, Ian. 


Wolf Pack Correction or Rotation

Monday, April 28th, 2008

A HGS Investor User is a trifle concerned that his recent stock picks are getting hit and was looking for a reason as to whether “it is shorting, profit taking, a full moon or what?”  So I felt I would continue the theme of the past two blog notes and give a more detailed response of the factors to consider at Earnings Report time on great Leading Stocks.


rotation

  •  User’s Question: I’m trying to get a handle on what is going on with the stocks that I screen for and I would like some opinions from our more experienced people on this forum. Starting last Wed it seems each group is getting hit hard with selling that I assume is being brought on by short selling. On Weds. I was forced out of a gain in LNN and on Thurs. the same thing happened with CLR, JRCC, BZP and MTL. These stocks as a group have pretty much recovered the haircut they received; unfortunately, I was stopped out of all of them and was too tentative to jump back in.  Today, I bought into CF and MOS figuring that they were safe as their earnings were out and the same thing is happening to this group. I haven’t had collective bad calls like this in quite a while (thanks to HGS). I know last week there were comments on the forum how screens were red but the market was green and I just get the feeling that these strong stocks are getting hit for a reason. Is it shorting? Profit taking? Full moon or what? Seeing I’m getting lumped up, I at least would like to know why? Any opinions would be appreciated. 
  • Answer:  It’s called the balance between Fear and Greed at Earnings Report time, i.e. Qeps Date.  There are four times a year when great leading stocks are the most susceptible to both Fear and Greed: The old adage of Buy the Rumor and Sell the News is always true at such times, especially when great leaders are into climax runs and pushing their luck at third and fourth stage breakouts.  Clearly, the Chemical – Specialty Group is a very recent and excellent example of this. POT and MOS are classic examples.  We can say the same about the Steels, AKS and STLD.  Let’s Review the bidding using Chemical – Specialty:
    1. Classic Examples: POT and MOS are classic examples of leading stocks moving into climax runs.

    2. Climax Run: A Climax Run is defined as a sharp move up over the prior two weeks of at least 25% Gain after it has already had a decent long run.  Invariably the shape of the chart is parabolic and the Index will always break the ascending tops line drawn from the previous two highs to the upside.

    3. % Price Gain from 52 Wk Low: POT is 250% up from its 52 Week Low and MOS as much as 355%, hence they are badly extended and fat with profits. They are story book stocks with all the fertilizer mumbo jumbo, hence they have had halo as far as Wall Street is concerned, i.e. are darling hot stocks in hot Wolf Packs.

    4. Vulnerability at Earnings Report Time: Such stocks will invariably go into climax runs just before Earnings Due Time, and it is usually better to take the gravy of a 25% added Price Gain than to sit through the Earnings Report, no matter how good it is on such stocks.  Of course one can always buy Puts, but the risk of loss far exceeds that of a certain gain under these conditions.  No matter how good the earnings reports, the stocks are invariably downgraded or targets for concern at such times. After all we went through this same scenario for the five horsemen of the previous top leaders…AAPL, BIDU, GOOG, GRMN and RIMM.  GRMN is dead for now, GOOG is recovering and AAPL, BIDU and RIMM have recovered and on their way again.  All had deep corrections, though exacerbated by the Bear Market Correction.  

    5. Analyst Downgrades after Earnings Report: On that last point, POT was cut from a Strong Buy to a Buy, and Barron’s had an article on MOS being impacted by a rising Dollar!

    6. The High Jump Tool: Leading stocks like these two give a strong feel for their personality as they leave their footprints in the snow.  Those are round words, but what I mean is that the High Jump and more specifically the High Jump from the 200-dma gives one a great clue as to when the stock is likely to correct.  Time and again the stock will correct at a certain % up from the 200-dma ONCE it has established its high, higher and highest jumps.  For POT that ranges from 66% to 75%, and true to form, it corrected this time at 65.87%.  For MOS the range is 97% to 120%   and it corrected at a High of 92%.  In other words, the higher the Price Gain, the more difficult it is for such stocks to beat those footprints after they are ESTABLISHED stocks with a known pedigree and behavior.

    7. Stage Breakouts: A further clue for caution comes from the # of Stage Breakouts from their low usually measured within the past year.  A stage breakout is defined as one where the stock rises to give a minimum of a 25% Price Gain and then bases sideways in a tight pattern before it takes off again.  The time of greatest danger is invariably at a 3rd and particularly 4th stage breakouts where somewhere along the line the stock will correct a minimum of 15% to 20% and then go again.  If the stock has had a 25% correction or more, then the stage count can start again, but I like to keep the original count as well until the stock gives up the ghost.

    8. Rotation or a Normal Correction: The $64 question invariably at such times is whether this is a normal correction or is it the start of a rotation out of these favorite Industry Groups? The short answer is that when such great leading stocks break their 50-dma to the downside they are likely to seek their 200-dma and stay dormant for a long time. It then depends on whether the “story” which got them recognition in the first place continues or is over. So far the story is still valid, the earnings reports are excellent and the worst of the Bear Market Correction is behind us for now.

    9. For Posterity Sake, I felt I would give full treatment to the numbers so that those who are new to the Principles of High Growth Stock Investing and specifically the value of the High Jump Tool will have a feel for what to look for in the future as to whether to Buy, Sell or Hold.  If you examine the spreadsheet, I show you both the upside opportunity and the downside risk…without spoon-feeding you.

        ss  Best Regards, Ian.


Market Rotation or a Mixture of Old and New Wolf Packs

Sunday, April 27th, 2008

wolf

Based on Friday’s performance, it seems that the old Wolf Packs were merely giving way to Profit taking earlier in the week, and they were buying back feverishly into the old Wolf Packs on Friday.  There is no question that many other Industry Groups are also rising rapidly and I have shown you the Groups that had the best advance during last week as well as the past three and five weeks.  In essence these are the best movers since the March 17th low.  The following spreadsheet is self explanatory, so enjoy:

selections

Best Regards, Ian.

Schizophrenic Market, Strange Day, Rotation?

Thursday, April 24th, 2008
  1. I had a few days R&R visiting my Son and his family in Oregon, and with the cobwebs cleared I am back to give you the pulse of the market as I see it.  In reading my backlog of e-mail, I saw headings such as the above, and many are shaking their heads when the market was up and their portfolios are down!  One thing is for sure…we cannot be asleep at the switch and as you will soon see I have figured out what the cross-currents are using the Group Performance Analysis Tool in the HGSI Software.   
  2. The beauty of the software is that we can smoke out where the money is flowing in and out NOW, but more importantly to have a set of User Groups of past leading Wolf Packs and emerging Wolf Packs.  This is particularly powerful at Earnings Report Time or as I say “We must keep a Beady Eye on Qeps Date, i.e. whether the Earnings are out or not.” 
  3. Let me give you a few pointers before I give the results of my work, which has taken a bit of delving, and I hope will be the basis for us deciding whether there is serious rotation in effect or not, or whether we have profit taking coupled with new Emerging Wolf Packs. 
  4. It is no news to you that in the last couple of days, two of the three favorite Wolf Packs that have given us good money have been hit hard the last two days, i.e. Chemical – Specialty and Energy Alternatives including Solar and Coal.  The Transportation – Shipping got hit hard earlier but they are dribbling back, so you need to watch those.  In passing you can add the Materials – Steels to the former, aka STLD and AKS as examples, which have also just announced stellar earnings but are also under recent pressure.   
  5. It goes without saying that if you were in Potash (POT), MOS, TNH, and CF you would surely have seen that most of these were hitting NEW HIGH JUMP records, particularly POT which got most people’s attention as it was decidedly moving into a climax run.  That is not to say that it won’t go higher after the correction is completed.  What people always forget is that great stocks like POT will move in anticipation of the earnings report for a final burst of Price Gain, and of course Greed and Fear play their part at such times. Enough said on that score.  But we should also balance that with the fact that the Earnings Report is stellar and with all the story lines on this Industry Group, there will be rotation of players and the stock will come roaring back given time.  Just look at the five favorite horsemen to see that they are starting on their way to recovery…AAPL, BIDU, GOOG, GRMN, and RIMM. Eventually the story gets stale and the buying dries up and they fade away, but for now keep an eye on whether these groups are just giving up profits or their turn in the sun is behind them. 
  6. The bottom line is that the Jury is out at this point in time whether we are just experiencing Profit Taking in these leading Industry Groups or whether this is the start of Rotation on these groups that have carried the market for ages and we as HGS Investors have enjoyed to our heart’s content.  Don’t be asleep at the switch and I have provided you with the stock lists to watch below, so there is no excuse for being caught with no swim suit on as the tide runs out. 
  7. In my last few blogs I have concentrated in giving you the yardsticks for establishing if this Bear Market Rally is coming to a top or it was just pausing to refresh before it moves again.  Of course, the Technical Analysts are drawing lines of resistance to suggest we are due for a correction, but the counterpoint is that the earnings reports so far in the Companies that matter most have been stellar and as such this market has shown a good deal of resilience to trotting down at this stage.  I note that Microsoft reported today with “soft” earnings performance (pardon the pun which I couldn’t resist), so tomorrow may be another story. 
  8. Now to the point of new Emerging Industry Groups; this would seem to be essential if this rally is to continue to get us into a “safe zone” which implies getting the Indexes up at least 15% from their lows.  I won’t belabor the point, but I have ferreted out two Groups right under our noses that are on the trot…or maybe I should say are starting to gallop.  Of course Technology is one and the other is of all things Fin – Equity Reits, many of which pay good dividends and are appearing out of the ashes.  Just look at the results for just four days trhis week compared to the S&P 500.
  9. I hope with all the snapshots I give you below that I do not have to do more than tell you that the stocks selected all had both Bongo Daily and Bongo Weekly signals “Yes” and that Earnings are already out for starters.  You figure how to go from there, but I think the evidence is pretty convincing as to why it seems we have a Schizophrenic Market, A Strange Day, and Rotation, all rolled into one!  As a winky-winky, you know you have to start with a Stake in the Ground and although I am giving you four different pictures to chew on, I STRONGLY suggest you put these same Stocks into User Groups and then start your Group Performance Analysis (GPA) on my Wife’s Birthday, i.e. March 17, 2008!  You will be amazed at the results. 
  10. On second thoughts, for the benefit of the doubting Thomas’s I will do just one snapshot at the end that shows how we have made good money in our Portfolios following Hot Wolf Packs, using March 17th as the Stake in the Ground, which is just five weeks ago…up  31.45%.

Chem tech reits march 17 

Just look at the whopping Gains in this Portfolio of Hot Wolf Packs in just five weeks, and that is after they have been drubbed for two days!  These stocks have been there on this blog for all to see going back over six months or more.  That is the Power of the HGS Investing Principles and of the Software.  Good Luck.


Best Regards, Ian

Copyright © 2007-2010 Ian Woodward
Disclaimer: Commentaries on this Blog are not to be construed as recommendations to buy or sell the market and/or specific securites. The consumer of the information is responsible for their own investment decisions.