 Ian Woodward's Investing Blog
Playing Checkers in Volatile Stock Markets
As I said in my last blog the market has played into the short term traders and
Type 3 swing traders hands. The Rally this past month has given the Bulls
breathing room and a cushion above the abyss of 667 for the S&P 500. As I said
before, that line in the sand is crucial:
1. When one has five uncontested Eurekas inside 12 days, that suggests the
Big Bulls are beginning to put their money where their mouth is. They have
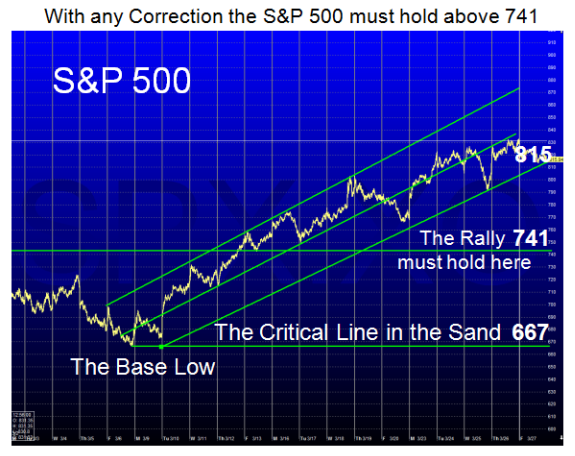
tread water these last four days as shown by the chart of the S&P 500 below.
If the S&P 500 breaks down below the lower channel at 815, the line in the
sand is 741 for any chance of this rally to continue. That is 11% down from the
rally high of 832 and is as much as they dare give up. Any further drop and the
rally is suspect if not over. 667 is a strong line in the sand for the Bulls and is the
last stand at the OK Corral. After that the Market morphs to the depression
scenario once again.
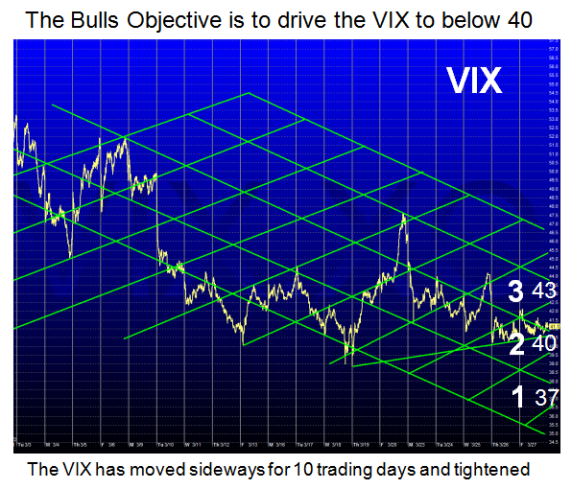
2. We have now gone sideways on the VIX for two weeks…gone quiet, and
sitting quietly in the 40 to 42 area. That would seem surprising as I remind you
that the Bulls have charged up 22% from the Base Low during this period. We
would have expected it to break down below the 40 level by now.
3. The Fear, though subsided, is still hovering around for the next shoe to drop in
either direction. It must break to the downside below 40 and head down rapidly
towards 30 for the second leg of the Bear Market Rally to continue. Conversely,
if it drives up rapidly above 45, the fear will be back and the rally will be over for
now.
4. The Game of Checkers is simple. We are currently hovering in Square “2”. The
Bulls want to drive it down to Square “1” while the Bears can’t wait to move to “3”:
5. As I said in the last blog, the Bulls must break the fear by driving the VIX down
to below 35 and then with luck to 30.
6. How do we know if the Bulls are winning and have the Bears on the ropes? There
must not be any Phoenix signal for 50 days from the last one on 03/02/2009 and we
are just half way to that point. At that stage there is an 80% chance after a small
pullback that the Bear Market Rally is still intact and on its way to achieve a sizable
rally measured as over 40% to 60% from the Base Low of 667.
7. Conversely there is a 50:50 chance that a Phoenix can appear now, so we are still
in the arena of a toss of the coin that we could trot down.
Net-net, the Messages are:
I. If the 815 trendline of Lower Lows is penetrated to the downside, it must hold
above 741, preferably above 757, and then move up to go for a second leg up per
the Template I gave you at the seminar. A strong push up from here is key.
II. At that time Type 3 swing traders may feel they should try to nibble for a move
which could last a further few weeks until the bulk of the Earnings are out by the
first week of May, when the Market traditionally is inclined to swoon.
III. The street will be watching the EPS reports for the Big Banks for the 1st qtr. and
if they are not positive, the rally will probably fizzle.
IV. The Big Banks, Technology and Small Caps will probably lead if the EPS reports
are healthy. If not…back to the foxholes and/or go short.
Best Regards, Ian.
