 Ian Woodward's Investing Blog
Is Your 401-K Nuddled Hollywood Style?
I haven’t gone balmy, but I couldn’t resist using the latest crazy novelty from Hollywood to make a point about nuddling your 401-K. I know you enjoy the “cartoons” I use to give the gist of the message…it takes me more time to scour the Internet looking for ideas to fit the message than it does to write it!

Anyway, my last few messages have been a trifle up beat with the Santa theme, but let’s not get too carried away with irrational exuberance, though it is a joy to boost our spirits with something positive to say at this festive time of the year. Even the disappointing news on the Housing Market was sloughed off today, and the VIX hit a low of 21.63 at the close to add to the calm. Of course all the pundits keep shaking their heads in wonderment and indicating that some day the Yo-Yo Market with an upward bias will slowly but surely come to an end.
Ron and I gave full treatment to both the upside and downside at the Seminar, and it goes without saying that the airwaves are full of scenarios for both, particularly when this market stubbornly inches higher. The intra-day and few days trading artists are quick to point out that we now have an Inverse Head and Shoulders Bottom on the VIX and that is true as shown below.
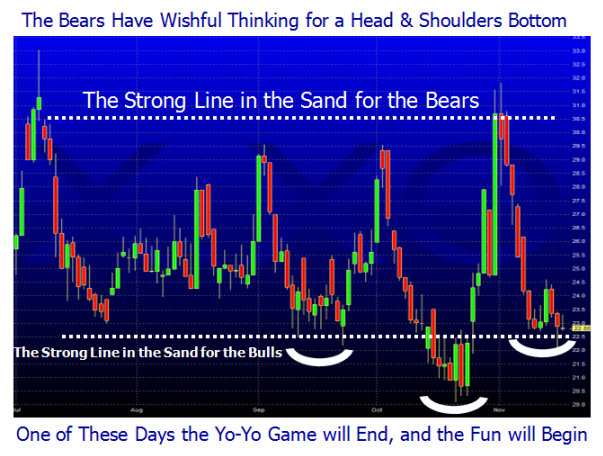
I have shown the yo-yo picture for the VIX umpteen times before now as to the lines in the sand and so there it is one more time. As you will see nothing has changed; we still oscillate between 22ish and 30ish with monotonous regularity. Nimble-be-quick will always get a short term trade one way or another when we get the famous Connors 10% above or below the 10-day MA good stuff. So what’s my point? This stuff becomes regular fodder to chew on, as short term artists will always know which way the wind is blowing with these wind gusts for such moves.
But what do the Type3’s and 4’s do with all of that? Nothing…they either get whipsawed, stay out and wait patiently, or have given up waiting and get in biting their finger nails. The higher it goes the worse it gets the later they get in. Eventually, the Big Players are pulling out when the Little Players are frothing at the mouth and falling all over themselves to get in. In times of long rallies in the market over several years as we enjoyed during 2003 to 2007, it was easier to spot this phenomenon and it can be said in two words that saved our bacon, i.e., Hindenburg Omen. It is most unlikely that we will see that Indicator sprout up at this stage of the Market Recovery. However, as HGSI Users we are a lot stronger in spying early warnings of what to look for. Let me demonstrate that to you with just three charts.
This chart draws on our experience of how the Kahunas have behaved these past ten months. A Kahuna is a 1-Day Change in %B of the Bollinger Bands of 0.24 or 0.40 either up or down:
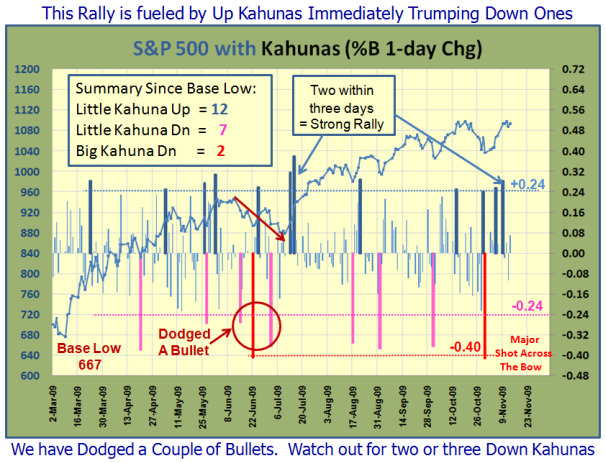
Note that the chart covers the period since the Base Low, i.e., the full Bull Market Rally so far.
1. The Up Kahunas with a count of 12 to 9 are a few more than the Down, and is reasonable since the bias is up.
2. When the market corrected in June/July by about 9%, we had three shots across the bow where I note that we dodged a bullet
3. Also take note of the two Kahunas essentially within three days on two occasions in the second leg up of this rally which assured the direction would remain up. The Bears did not have the support either back in July or in these last few days to assert their authority and drive the market down. The overall sentiment is still up for now. It will not change until Wall Street Bonuses give way to Jobs, Jobs, Jobs as the hue and cry!
I say learn from those signs and when we see the reverse happen get ready to run for the hills as it will be one of the earliest clues we will see that things have reversed and that the Bulls have no further answer up their sleeve to thwart a Bear assault. But that in itself will not be enough, so let’s look at the next chart which shows the roadmap signs of what to expect:
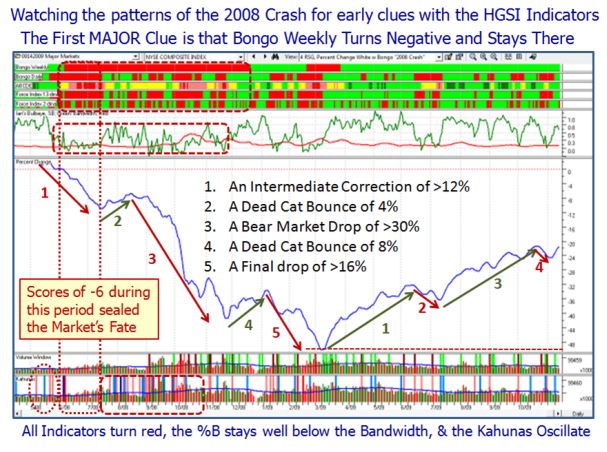
There are six points to be made from this chart as to what to look for given a Correction:
1. The first clue will be at least two if not three unanswered Kahunas to the Downside in quick succession as mentioned above.
2. Although late, probably the best clue that things are going wrong is a Bongo Weekly Red
3. Prior to that the HGSI Indicator scores will be at least -4 and trending to -6 or more
4. The %B will have rapidly descended and will stay below the Bandwidth
5. The Correction on the Major Indexes will be > -8%
6. The Kahunas will oscillate back & forth between Blue and Red, indicating Bulls and Bears are fighting for control.
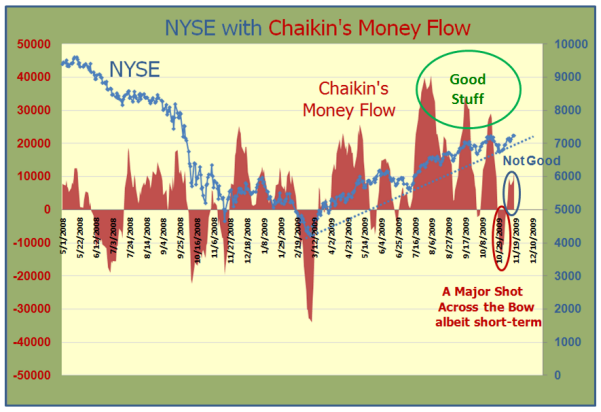
Finally, the above chart of Chaikin’s Money Flow is looking a trifle precarious and needs to show a lot more strength.
I’m not saying this will happen, but anticipating what must occur provides an “On Guard Plan”.
We shall see how all of this unfolds down the road.
Best Regards, Ian.
