The Bent Fork in the Road
Sad to say I got hijacked and my address book was pilfered. I apologize to any of you who got a spurious message from me, but I am sure you ignored it if you did. I am back in business thanks to my good friend Bob Meager who sorted the bug out.
As a follow up to my last blog where we were at the crossroads, Friday’s debacle leaves little for the hopes of a bull rally except for a miracle this coming week, and suggests the Fork in the Road is bent to the downside:
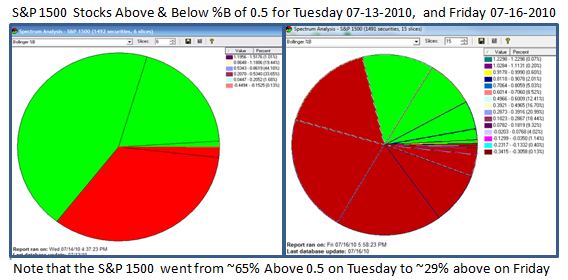
My friend Armand asks among other things “…The logic would suggest that if the distribution was also a Phoenix, it would dramatically increase the chances of the failure rate.” As Ron and my supporters of the High Growth Stock Investor Newsletter will know, we now have good insight not only in the fact that a Eureka or Phoenix occurs, but also the intensity of that Impulse Signal. As a follow up to the HGS Investor Newsletter published last Friday, here are two slides hot off the press to give you a feel for the power of Friday’s Distribution Day, but also what we can now do in gauging its strength or weakness as well.
The Pie chart depicts the three day shift from Tuesday to Friday of those stocks in the S&P 1500 which were above (Green) or below (Red) the Middle Bollinger Band of %B at 0.5. The shift is dramatic, and shows the extent of about a 2% one-day change in the Index.
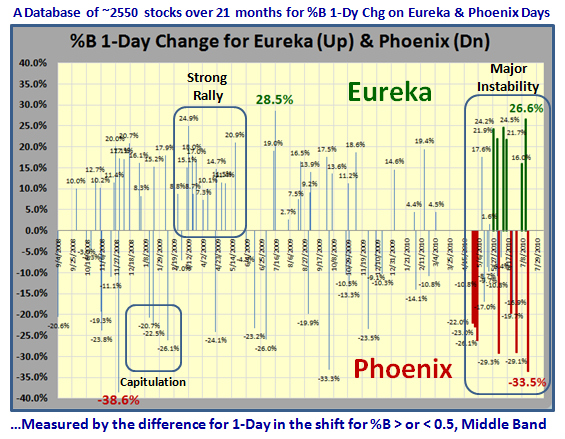
The chart above shows the history of all Eureka and Phoenix Impulse signals for the past 21 months or so, and as you can see from the reading at the bottom right, we suffered a -33.5% 1-Day Change in the Database of some 2550 stocks to the downside of the %B 0.5 line. It is the second worst reading recorded. We can now measure the intensity of the Impulse Signals. Friday was as bad as they come. So, Armand, you got more than you asked for and don’t forget the “Diamonds for Suits!”
Best Regards, Ian.
 Ian Woodward's Investing Blog


