Reset the Market for a Rally?
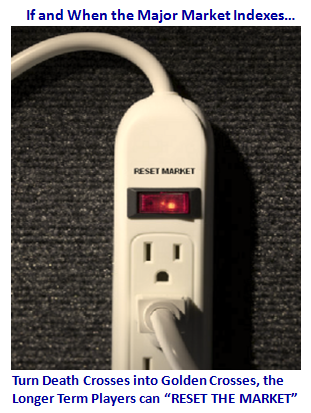
My good friend Mike Scott sent me the following picture to use when appropriate. The Bears are saying “Not so fast my friend”, and they are right until the Bulls turn Death Crosses into Golden crosses. Only then Longer Term Players can “Reset the Market”.
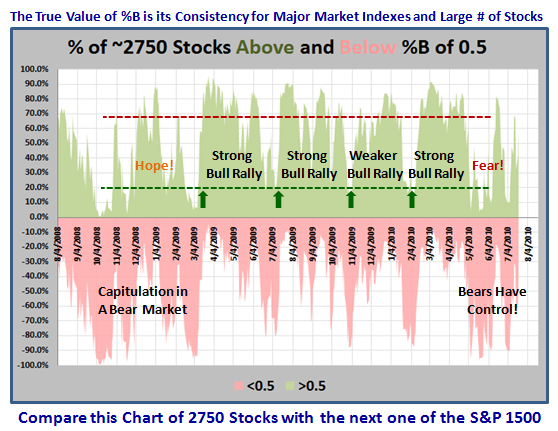
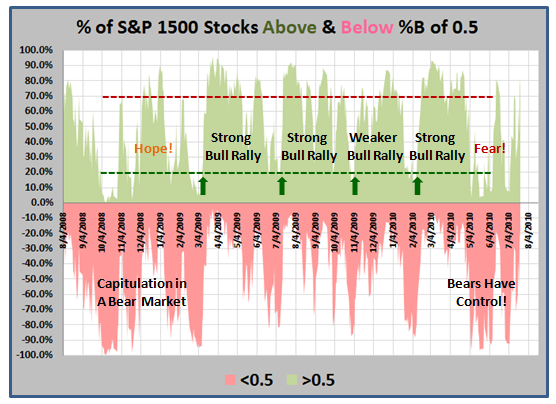
So, let’s review the bidding as we go into a fresh and critical week. I offer you two charts using %B for a User Group of ~2750 stocks and the S&P 1500 showing their history over two years. They are self explanatory. The Message is “CONSISTENCY.”
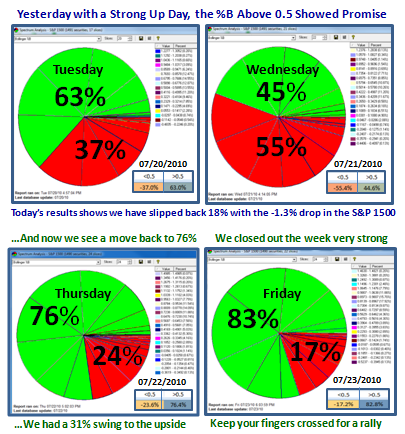
The next chart I used in my last blog, but felt it important to show again here for the continuity of the message which is that things are perking up for the Bulls, with a big swing to the upside in %B stocks for the S&P 1500 over 0.5:
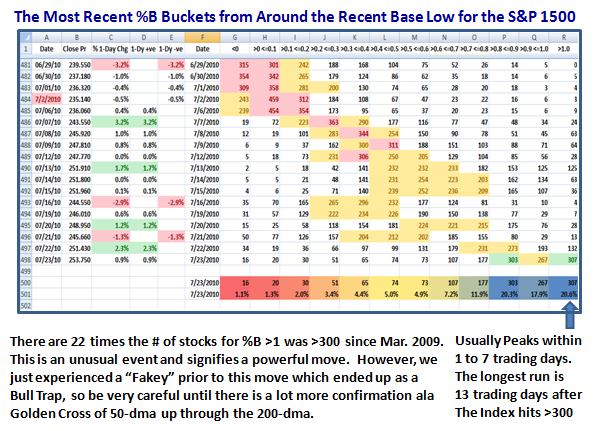
This next chart has a lot of information in it, which you should study carefully. It starts with the Phoenix on 6/29/2010, leading to a Base Low on 7/2/2009, as shown. I have shown a heat map to depict how %B was predominantly down in the dumps at below 0.2. It has risen rapidly in the past two weeks to finally sit with 300 stocks of the S&P 1500 above 1.0, i.e., above the Upper Bollinger Band. “So What?” say you. This is a significant milestone as it has occurred only 22 times from the Base Low of March 2009, so it is a rare beast. On the one hand it is a sign that the Market is repairing. On the other hand, expect the market to peak usually within 1 to 7 trading days for this particular run, with the longest run being 13 trading days in July 2009, after the Index hit >300. This is insight I garnered using Chris White’s EdgeRater Software…good stuff.
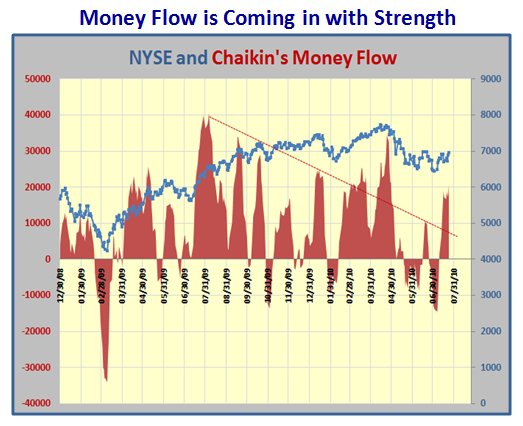
Bulls can also take heart in that Chaikin’s Money Flow is also looking strong:
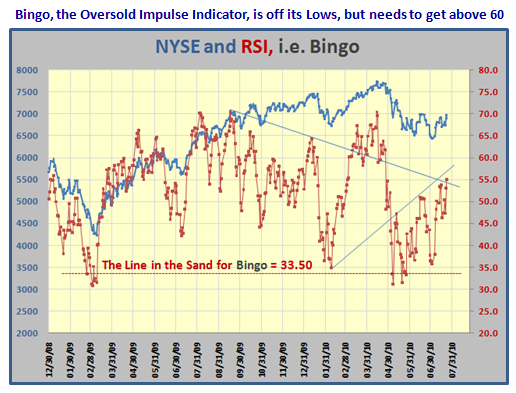
Likewise, the Oversold Impulse Indicator we call Bingo, is now well off its lows of below 33.50 when it signalled back in early May, 2010, and is now at around 55. It needs to show more strength with RSI getting above 60:
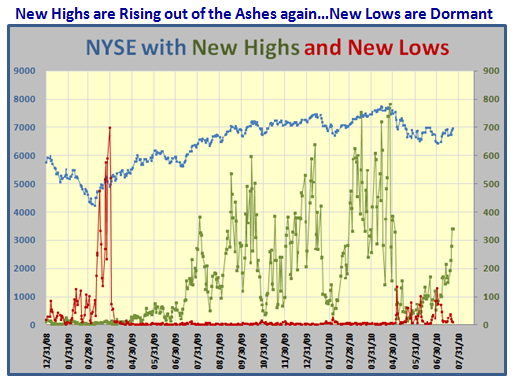
Furthermore, the New Highs vs New Lows Picture is improving with new high coming out of the ashes to a respectable >300 shares. That also needs to continue:
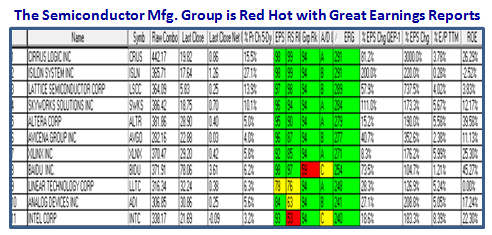
There are many Industry Groups perking up as a result of their Earnings Reports and one that caught my eye given their big Earnings Reports is the Semiconductor Mfg. Group:
So all in all the Bulls seem to have many friends around them and it takes Solidarity to drive this market to new heights. The bears are waiting rubbing their hands at the usual spot of a Head and Shoulders top, but until then there may be the ghost of a chance for the bulls to drive this market once again for a decent rally. Of course there can always be the “Fakey” we experienced less than a month ago, so be on guard:
May the Wind be at your back is the wish of your friend, Ian.
 Ian Woodward's Investing Blog