Stock Market: Twelve Drummers Drumming!
I’m sure you are saying “A Trifle Early for the Santa Claus Rally”, but you take it when you can. However, the message has a different meaning and one that should stick in your memory forever.
My good friend Robert Minkowsky as always is on the ball and wrote:
Ian; For the S&P 1500, %B > 1.0 was 570 yesterday or 38%. There was a Strong Eureka and we had 2 Little Kahunas this week. If we start counting the days of this rally from 9/1 today is the 47th day. The average of the # stocks > 1.0 during this period is 150. Your chart in the newsletter shows the top rally for the S&P 1500 at 52 days.
It looks as if we will break that barrier with this run that started yesterday and that may turn out to be a climax run.
Any additional thoughts? Best regards, Robert
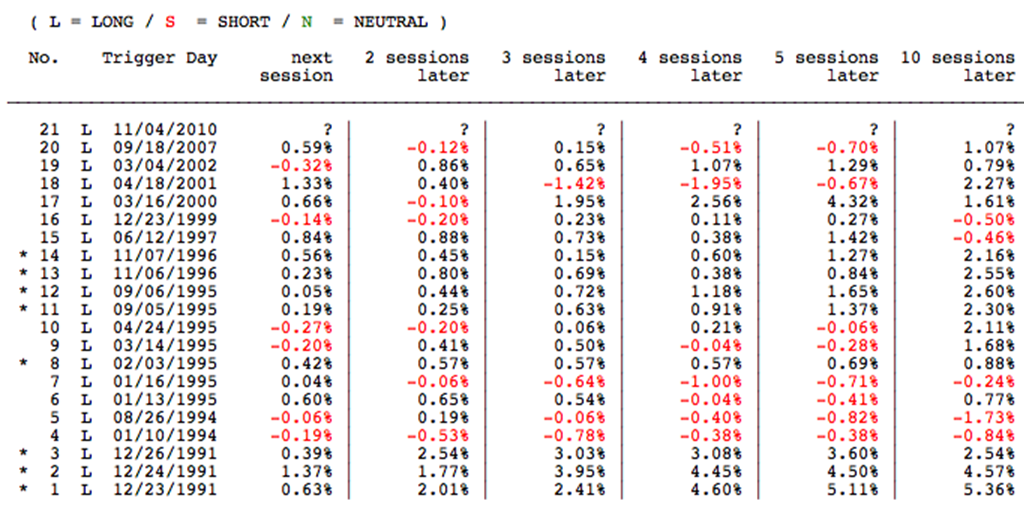
Ah Robert! You crafty fellow! When I saw 570 and %B above the 1.25 threshold, I immediately went back to see if there were other recent occasions where that number hit the history books. Not in my books that only go back to 1999. However, I was lucky enough to find an article which says there have been three occasions on 11/06/1996, 09/05/1995 and 12/23/1991 on the SPY , i.e. the true days of wine and roses:
So, if History is to repeat itself, we are golden up to the next twelve days.
But those few readings are not enough to have any statistical significance. However, as luck would have it here is a sample of events that hit 1.15% for the SPY (not the S&P 1500). It’s still not statistically significant, but close enough for Gov’t. Work to at least know which way the wind should be blowing:
Again, take this mumbo jumbo for what it is worth, but the message is that the losses are minimal and there is about a 75% chance that the Market will be up about 2% to 5% after ten sessions. Your observation regarding my point in the newsletter is spot on about looking for a climax run, but let me take you back to an earlier Newsletter where I suggested that when the S&P 1500 reached above 525, that twelve drummers drumming was the answer! I said then:
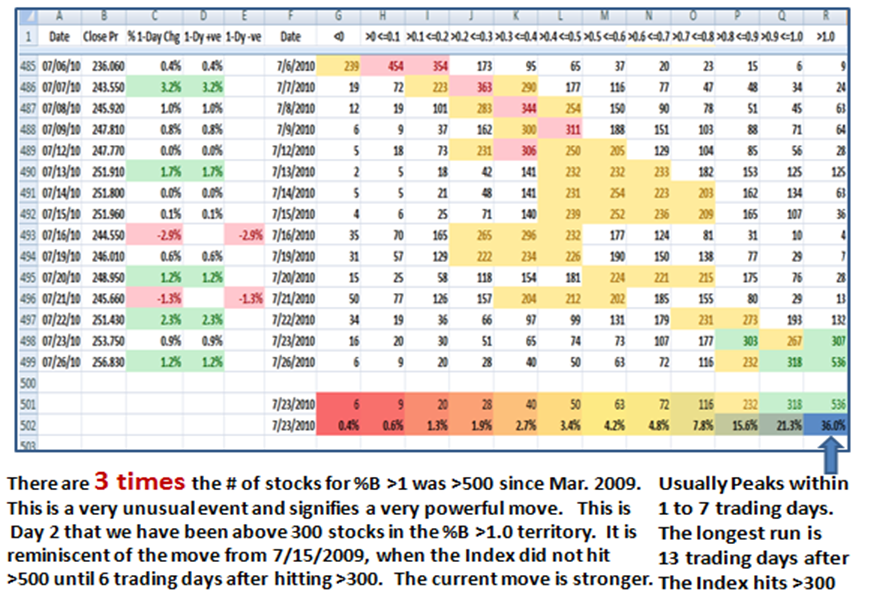
“You will recall the following chart I alerted you with on the Blog Note of August 8th, just a week ago that gave us the clue that something unusual had transpired on 07/26/2010. There was a sudden gush of 536 stocks in the S&P 1500 moving in one day to being well overbought and sitting outside their Upper Bollinger Band, from 307 stocks the previous day.”
In that Blognote of August 8th I posted this chart which suggests we have 1 to 13 trading days to the peak after the S&P 1500 Index hits >300:
It goes without saying that this current “Bump Up” beats all others in strength, and the only caution out of all of this is that the higher they rise the harder they fall. Remember that the most money is made and lost at the Fat Tails end of the business, i.e., >2 Standard Deviations, so Make Hay while the Sun Shines and keep an eye out for the Drummer Boy in Trading Days! Now what should you turn to, to keep an eye on EXTENSION…the High Jump! Corrections there will be, but how much is in the lap of the gods!
I know what you are all saying “So much to remember, Ian” but you must admit I do boil it down for you…if only you would remember! I will use this in my Blog with a lot more to come and a Partridge in a Pare Tree! I will do another note this weekend.
Best Regards, Ian.
 Ian Woodward's Investing Blog


