Stock Market Ebb & Flow in a Nutshell
This past week the Stock Market has been acting a trifle jittery, but as I said in my last blog note that despite the obvious bifurcation and rotation in the market, the Institutions were not about to let it drop when we had the State of the Union Address this week, and true to form they have propped it up one more time.
This note offers you the Ebb and Flow of the Market in a Nutshell using Grandma’s Pies and Bucket Skipping.
Two points of explanation on understanding the Pulse of the Market with %B of the Bollinger Bands:
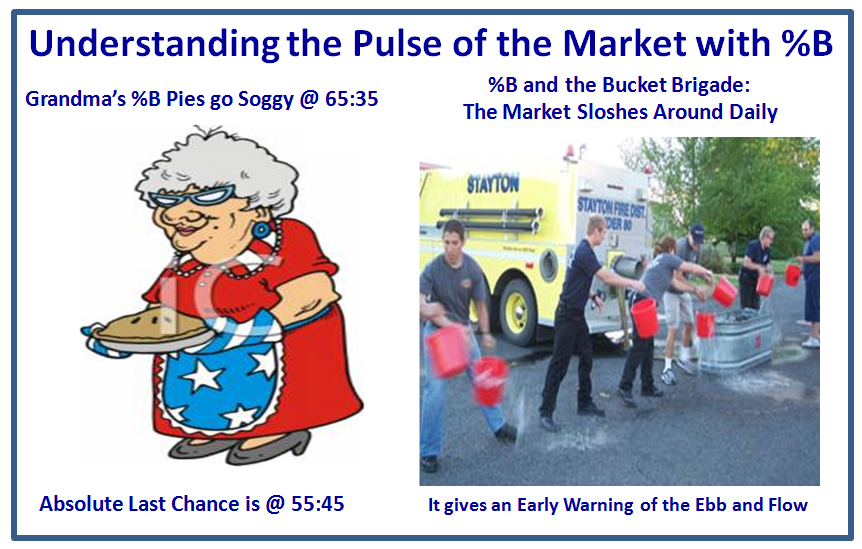
1. Grandma’s Pies are a quick way to know who is winning…Bulls or Bears. I use it with the S&P 1500 to give a large sample of stocks to know the % of stocks above and below a %B of 0.5, the Middle Band of the 20-dma. As you see from my notes on the chart below, the areas of the most jitteriness are a ratio of 65:35 with a last call of 55:45. You can of course use any Index you wish.
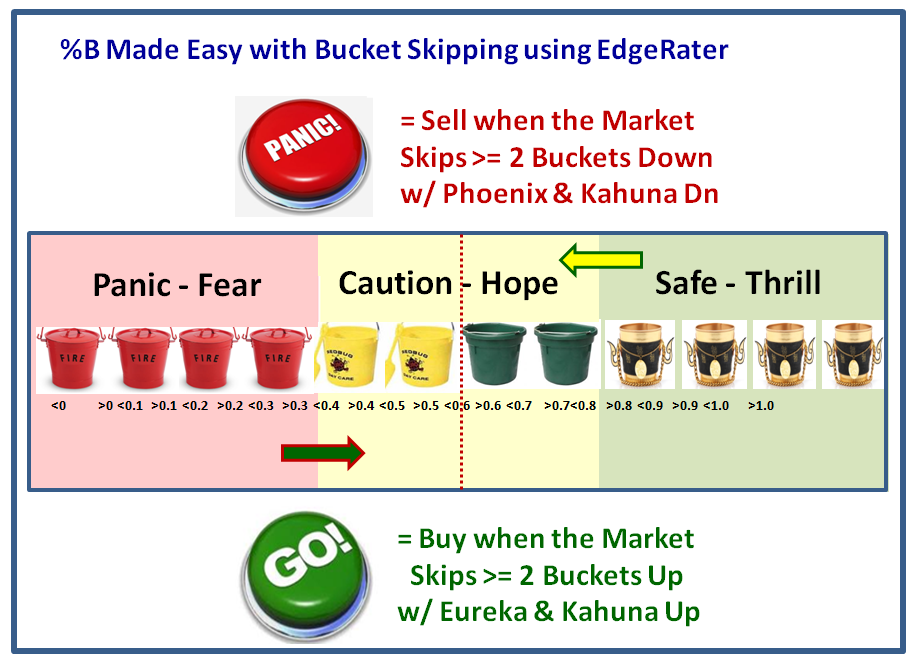
2. Likewise, I have coined the term Bucket Skipping and those who follow my strategies know it means a 1-Day Change in %B which is in excess of 0.10, representing a single bucket skip. Since my Kahuna signal requires either a 0.24 or a 0.40 1-day change either up or down, this would be tantamount to a 2-bucket or a 4-bucket skip, respectively; in other words a significant change in momentum in an Index, a Stock or an ETF.
These concepts are shown in the next two slides:
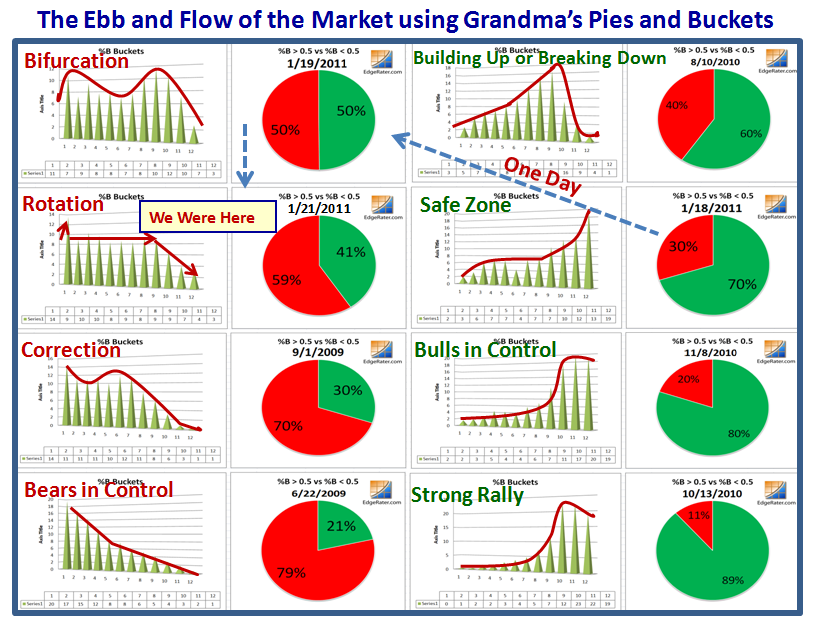
Using the Edgerater.com Software which my good friend Chris White has provided, we have an easy way to watch the Ebb-Tide of the Market with Grandma’s Pies and Buckets as shown below:
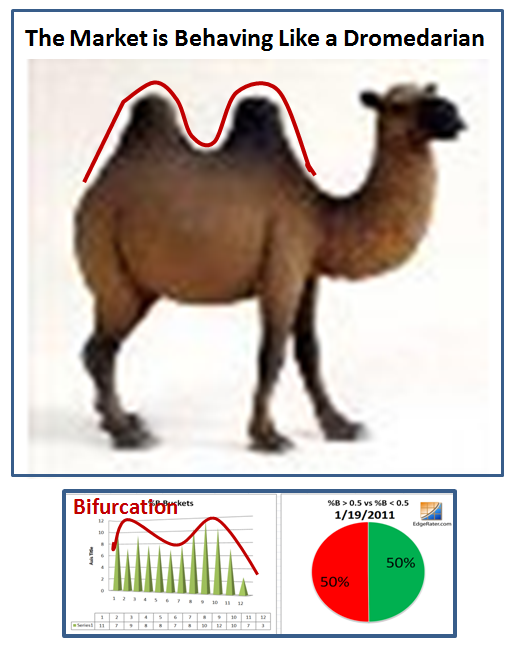
It doesn’t take two minutes to see which way the wind is blowing by the green and red portions of the pie charts and the sloshing of the market from left to right by the contents in the “buckets”. More importantly, one can see that it can take just a day for the Market to swing from the Safe Zone of 0.70 and above, to Bifurcation as shown by what transpired from 1/18/2011 to 1/19/2011 by the blue arrow.
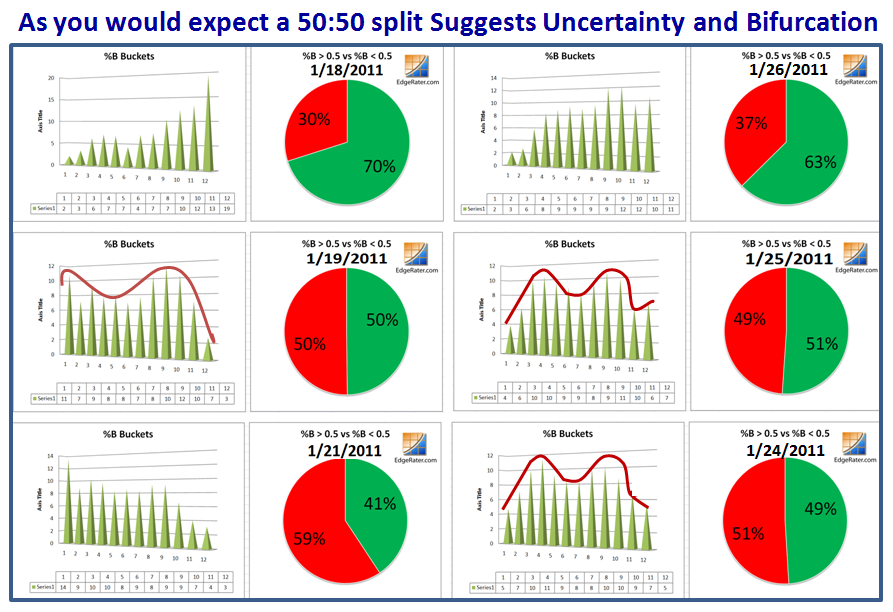
You might wonder how the Market has performed this past week and so here is that picture. I left out 1/20/2011 as it didn’t add anything to the information and I wanted to show six snapshots on the page:
Remember that if you wish to see a larger picture, just click on the chart and enjoy. So, net-net we have a humped back effect, and our good friend the Dromedarian is a good way to remember Bifurcation!
So there you have it, the EBB-Tide of the Market to understand the High, Low and Middle Road Scenarios in a Nutshell. You can use any Market Index or your own Portfolio of Stocks and/or ETFs to follow the sunshine and avoid the rain with sufficient warning to do so.
It’s time you folks make your reservations for the Seminar as the Hotel Arrangement at the Marriott Courtyard that give you a break in price holds until March 7th, 2011. In any event you need to get early bookings for your plane fares, and we need to have ample warning of who is intending to participate at the seminar from March 26 to 28, 2011.
Best Regards, Ian.
 Ian Woodward's Investing Blog
