Stock Market: Champagne Bollinger with a Taste of Woodward
As most of you know, I have been a strong follower of John Bollinger and have built on his Bollinger Bands techniques.
Here is a response to a good friend of mine, Paul Reiche, whom I have known for over 15 years, who was a Seminar Attendee this past week and asked an astute question as follows:
Ian,
When the bandwidth starts to widen in a rally, above 0.11 as we see now, is that to be regarded with the same caution as on a down stroke?
Paul R
Hi Paul: The quick answer is “No”. You crafty fellow with those beady eyes that spotted what I saw as well. I had to go back to the Stake in the Ground on October 2008 and the Measuring Rods using that Benchmark to understand the dynamics of what you and I saw!
However, the short answers are:
1. You must pay attention to where %B is relative to Bandwidth
2. The famous Bandwidth Squeeze which can take you either way
3. After a disastrous quick drop, any recovery will show a widening of the Bandwidth AFTER the Market starts to come up out of the Mire.
4. Watch for a Hockey Stick on the Lower Bollinger Band to see a Recovery forming
So What: Rest easy on what you see UNTIL the Market Heads down sharply again. As long as %B sits up above 0.7 in the Champagne Buckets, have no fear!
Now for the long answers that come together clearer with pictures, which are worth a thousand words:
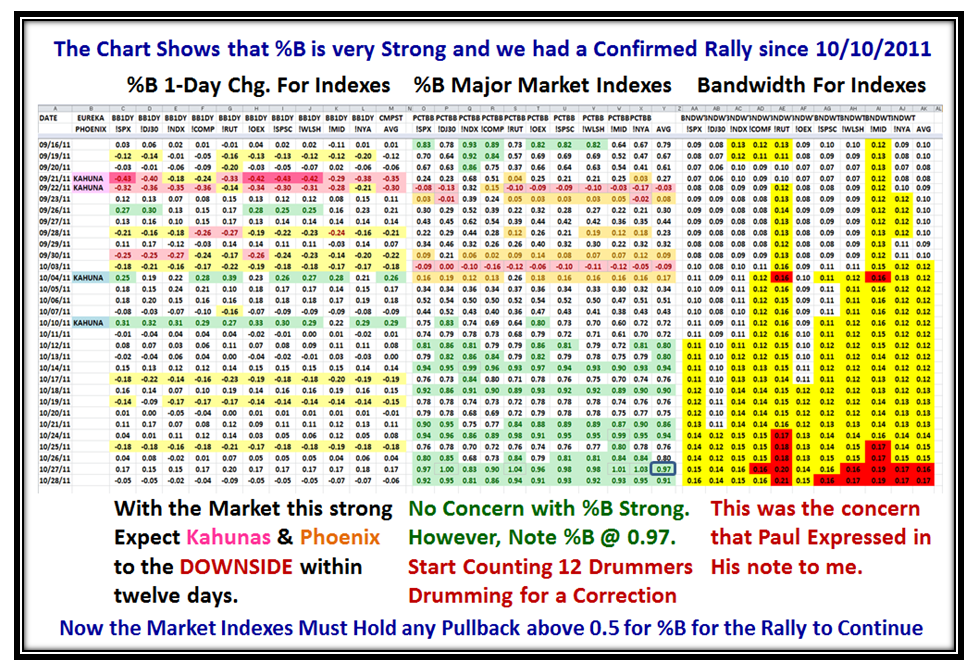
The first chart shows the dilemma with the “red” creeping back into the Bandwidth as shown below. There is no concern as long as %B stays up in the “Champagne Buckets” of %B >0.7. Note the strength of the market in the middle of the chart with the Average Composite %B for all Indexes at 0.97 on Thursday.
It goes without saying that all Type 3 and 4 Investors are itching to get in and those who are in, be they any Type, are wondering when this Market will break down again after the huge surge from the euphoric news from Europe that they have a solution for the Debt Crisis in their domain. My notes in the body of the above chart say it all, since the key clue to being overbought is the 0.97% for the Composite Average of all Market Indexes. In my previous Blog Note of Thursday, I mentioned that a reading of 45% of all S&P 1500 stocks >1.0 (above the Upper Bollinger Band) was very high…only one other reading has beaten that in 12 years! That was on 7/1/2011 with 48%, and you have only to go back and look at my previous blog notes of August 1 to 4 to see the handwriting was on the wall then, which followed a month later.
Now please understand that the 48% on July 1 was at the end of a long Bull Rally from September 1, 2010; it was the culmination of a week of %B running up outside the Upper Bollinger Band on light volume, tantamount to a Climax Run as we discussed at the Seminar. However, this 45% is at the start of a New Bull Run which is still trying to dig itself out of the MIRE. Expect a Correction, but what happens after that is the Key clue. Does it hold at above %B 0.5, the Middle Bollinger Band or fall down again to make the Rally short lived? Understand that this Market lives day to day and is totally News Driven.
Also, take heed of the note in red that says “Start Counting 12 Drummers Drumming for a Correction” which I have covered several times on this blog. It suggests that when all markets are this overbought with %B registering 0.97 for the Composite Average, one should expect some form of a correction within twelve days as a rule of thumb. If that occurs, then the Market Indexes must hold above 0.5 for %B for the Rally to continue without another round of gloom and doom. If Kahunas and Phoenix don’t appear in quick succession, then the likelihood is that the Rally will hold and continue upwards.
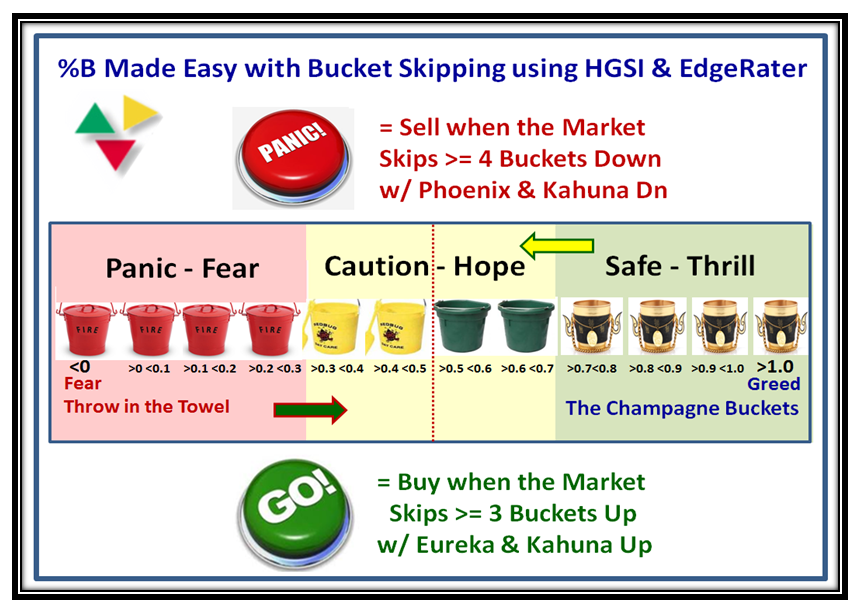
This next chart is all you need to know about Bucket Skipping, but be rest assured if you don’t understand the importance of Large Bucket Skipping then you may never stay on the right side of the Market. Those at the Seminar now understand that this is their lifeblood, so digest it:
I showed you in my last Blog Note that yet again, a couple of Eurekas sprinkled with simultaneous Kahunas and a 3-bucket skip to the upside was the ticket that a new Rally was on and all of this preceded the official Follow Through Day (FTD) by a couple of days. Go back and digest it.
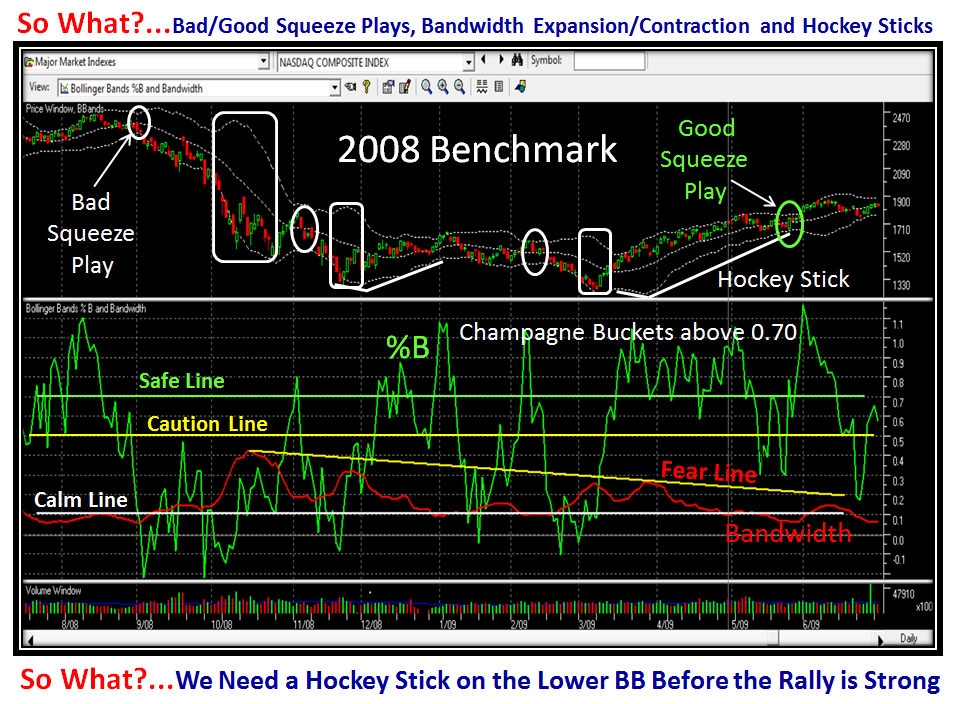
Now let’s move forward to understand how you can use the HGSI software to analyze the key characteristics in anticipating good and bad moves in the market using the weapons that John Bollinger describes in his book “Bollinger on Bollinger Bands”. If your eyes are rolling in the back of your head move on, but if you are interested the key to coming out of the current MIRE is a Hockey Stick! In my youth I used to be a decent field hockey player, being captain of my college team at Faraday House and later with the Treble One aerobatic squadron of the Black Arrows at RAF North Weald. Happy Days!
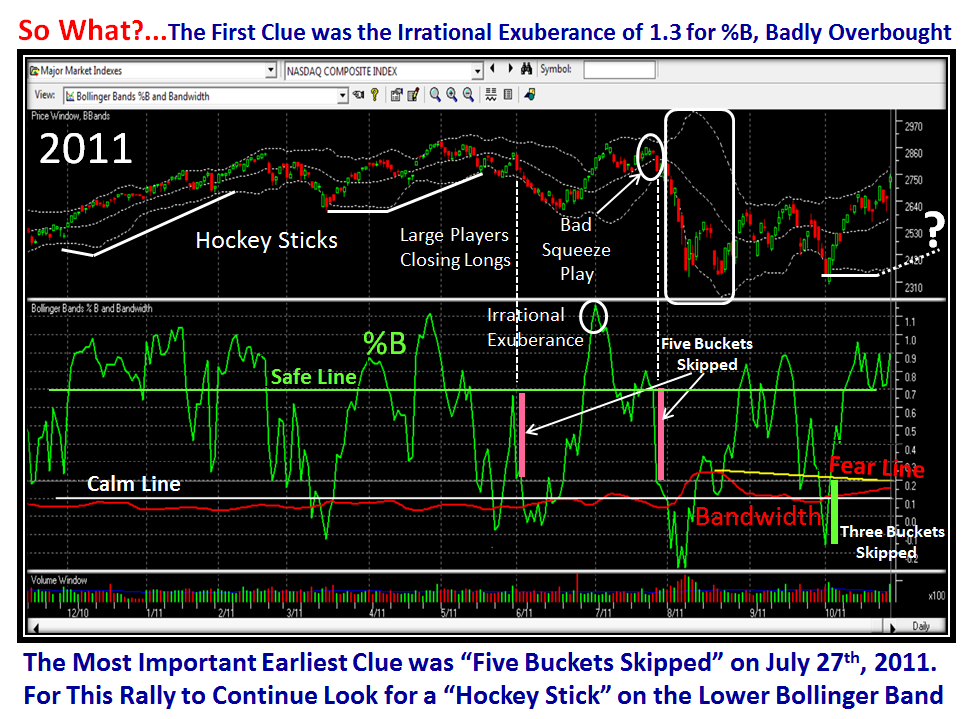
I know there is a lot to take in, but since you were one of the lucky ones who attended the Seminar for which Ron and I thank you for your support, this should be a snap for you! It all comes down to Hockey Sticks! Let’s fast forward to now and you will soon see what I mean on the following chart:
A good supporter of ours, Gary Lalone, wrote to me much earlier and suggested that the Institutions (Large Players) closed out their long positions back on 6/1/2011 with that five bucket skip down on that day, and then waited for an opportune time to short. And that’s my Story for Today!
Best Regards, Ian
 Ian Woodward's Investing Blog


