Stock Market: NASDAQ Highest Jump Target is 4350
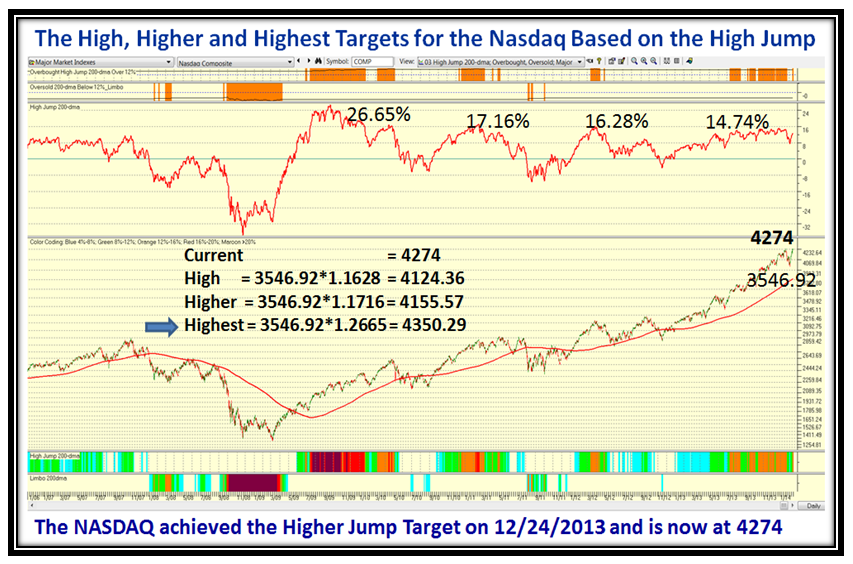
Those of you who follow my blog faithfully will recall on the December 26th, 2013 Blog I showed you the rationale for the “High, Higher and Highest” Targets using my High Jump Process. We had just achieved the Higher Jump Target on Christmas Eve of 4155, and then the Market corrected sharply.
We were on the brink of a more serious correction ten days ago, when the “Janet Yellen Halo Effect” took place with the NASDAQ rising ten days in a row! So the Market is rising into New High Territory, and I felt it would be wise to dust off those old targets for your perusal.
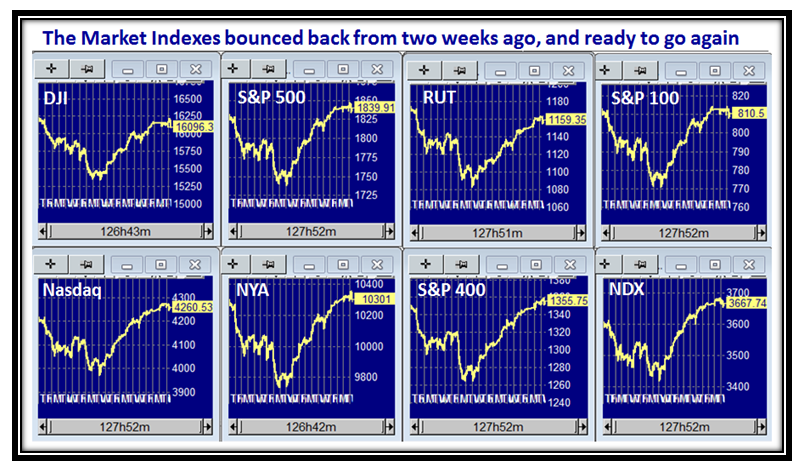
The Market Indexes are down a little bit today as I write this blog but you can see at a glance that the snapshot shows we are now back to “Double Top” territory with the potential for going higher:
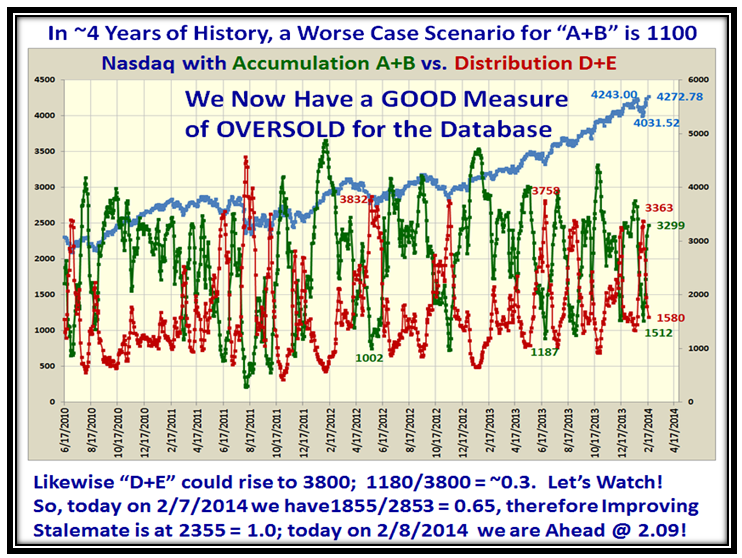
Likewise, the Acc/Dist Ratio has snapped back from being oversold to a respectable ~2:1 Ratio, so things are looking up for the Bulls once again:
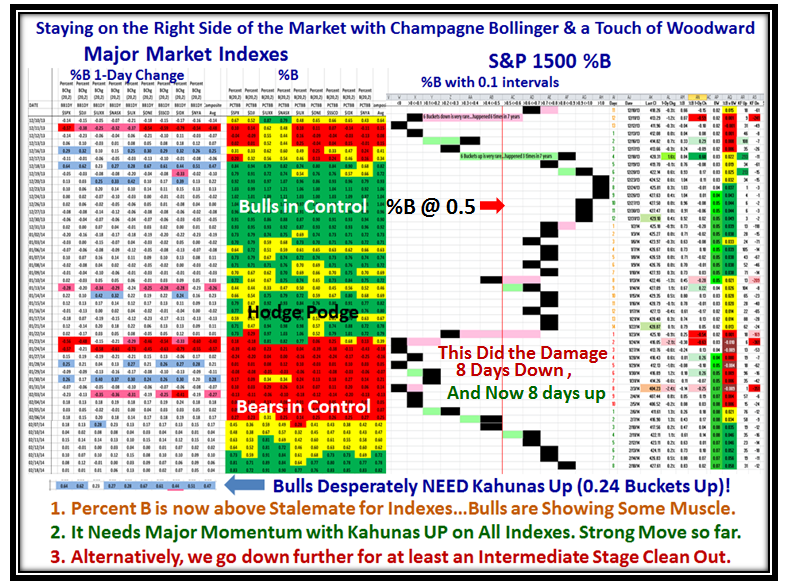
With that preamble in setting the stage for an upside move it pays to look at our favorite chart to get one more confirmation before we look at the High Jump Targets for the NASDAQ. It is the current picture of the S&P 1500 with its buckets compared to the Major Market Indexes with their %B, and %B 1-Day Change:
Now let’s get to the meat of this Blog relating to the Next High Jump Target. For your convenience the next two slides are plucked from the December 26th Blog which you should go back and review by selecting that timeframe from past blogs on the right hand side of the first page.
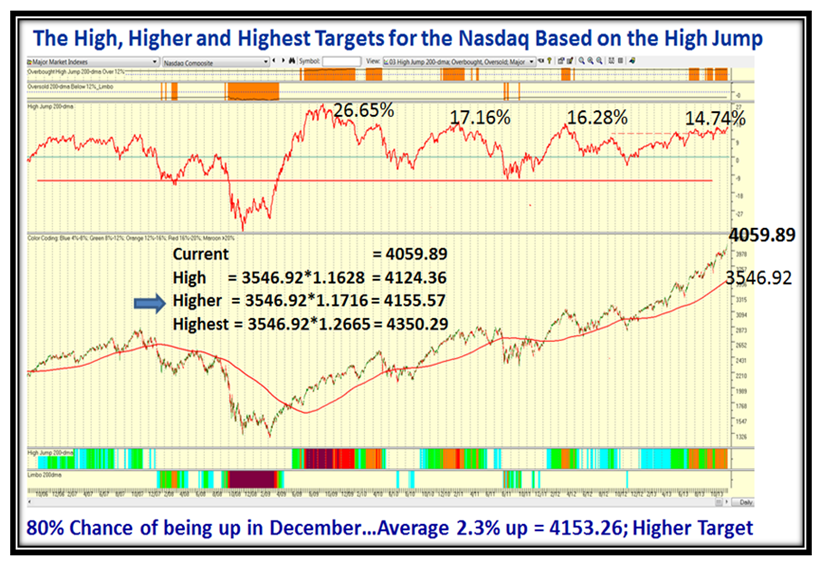
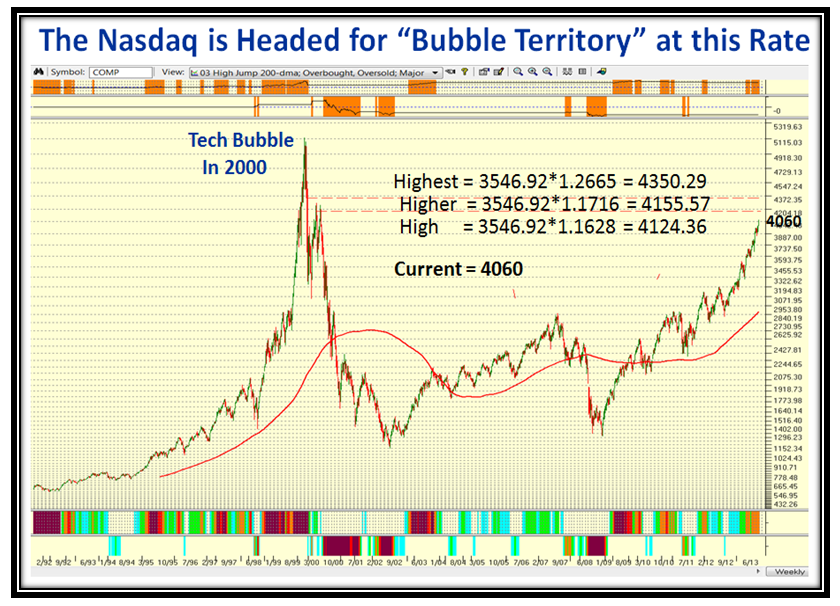
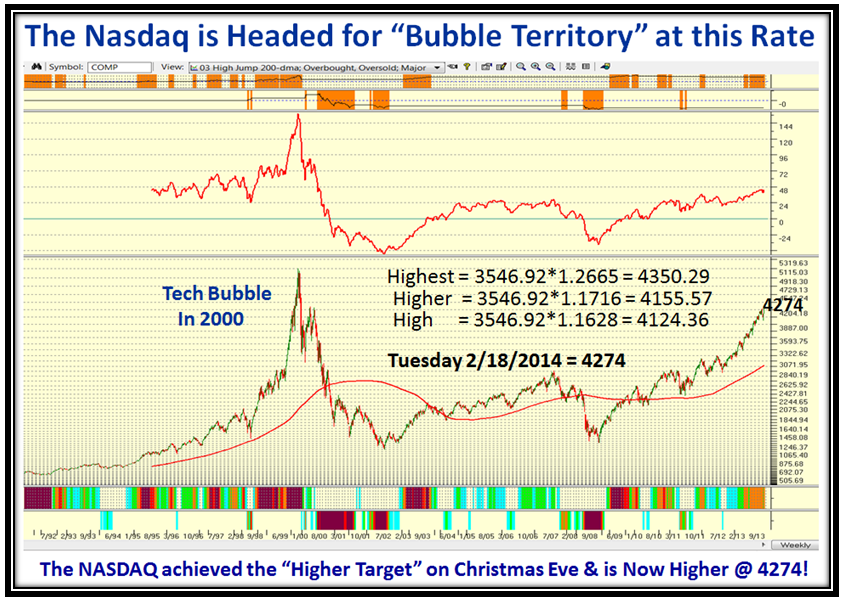
Those two charts served us well over the Santa Claus Rally period and we achieved the “Higher” Target then. The temptation is to apply the same technique to NOW, but my advice is not to do that, as one would then be compounding the “Greed Factor”. Far better to stick with the old Targets from back then and set one’s sights on the Highest Jump Target of 4350 from that previous exercise. If and when we pass that Target we can set new Stakes in the Ground, and measuring rods. So rolling forward two months from then we get:
Yesterday along the way I captured this screen shot above when the NASDAQ was at 4274, and I direct your attention to the flatness of the High Jump since the December 24th Timeframe where it had not surpassed the 14.74% mark on the High Jump. Going forward we need to see that broken to the upside and aiming for 16.28%. That would be a clue that we are approaching 4350. The second thing if we are lucky is that this next move is a climax run blow off and that we see an “Eureka” appear which would be a sign of a late stage exuberance for a climax run! At that point we are well into “Greed” and so watch out below.
On this chart the Clue is the Weekly High Jump, which needs to spurt up to “72” before we get too excited, and if we are lucky that all of this should happen, then mark my words we will not only have met the 4350 Target but also be ready for a pratfall, which we have fortunately not had as of yet!
I am not a Soothsayer, but I have faith in the High Jump Tool which has served us well over these past 20 Years, and we shall see if it proves itself one more time. Can the NASDAQ go higher than 4350?…yes, of course. But let’s get there first is my point, if we are to go higher from here. If not then you certainly know what to look for on the downside with -4% from the high and then -8% as the measuring rods!
Best Regards,
Ian.
 Ian Woodward's Investing Blog
