 Ian Woodward's Investing Blog
Stock Market: Bifurcated Bactrian!
It has been more than a while since I used Camels to depict the Behavior of the Market (I stand corrected as I used Dromedarian earlier and am correcting it per one of our supporters as a Bactrian has two humps and not a Dromedarian), but that is exactly where we stand after the behavior of the Market Indexes these past few weeks, and I am sure you get the point:
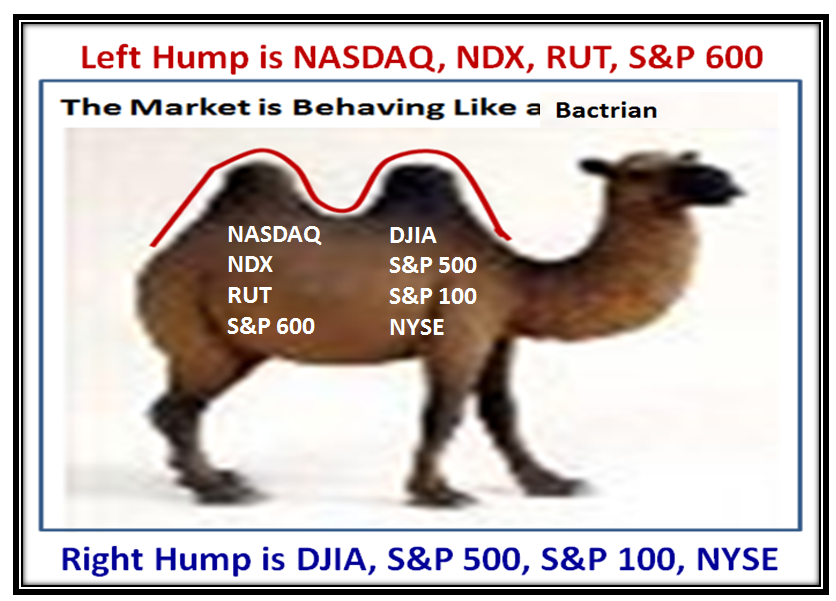
When a Market is essentially at Stalemate, and the chart pattern of Grandma’s Pies is double humped, it pays to see if there is a separation of Growth Stocks and Indexes vs Value. Here is that picture:
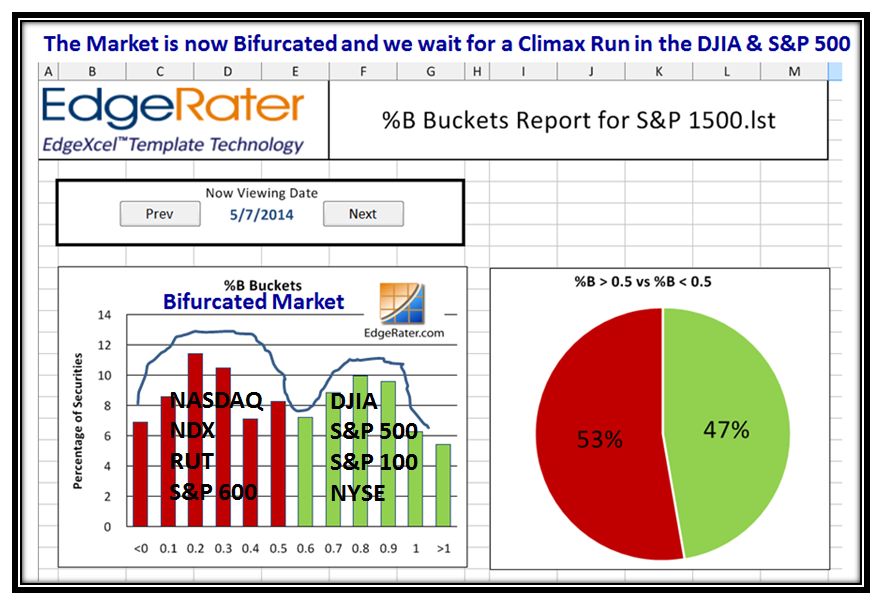
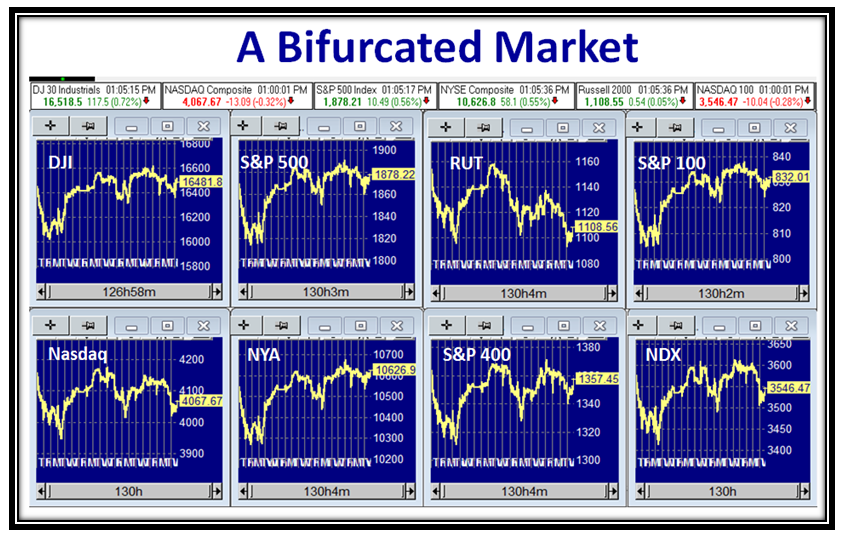
The Market Indexes show the same problem with the NASDAQ and RUT lagging the rest:
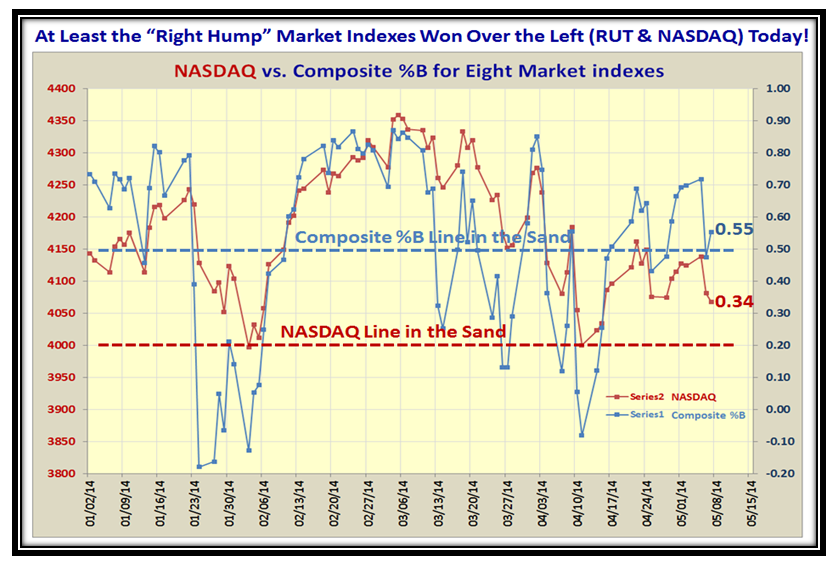
This next chart shows the Rationale for watching the Composite %B which is currently at 0.55 to ensure we focus on more that one particular Index like the NASDAQ or the Small Cap RUT:
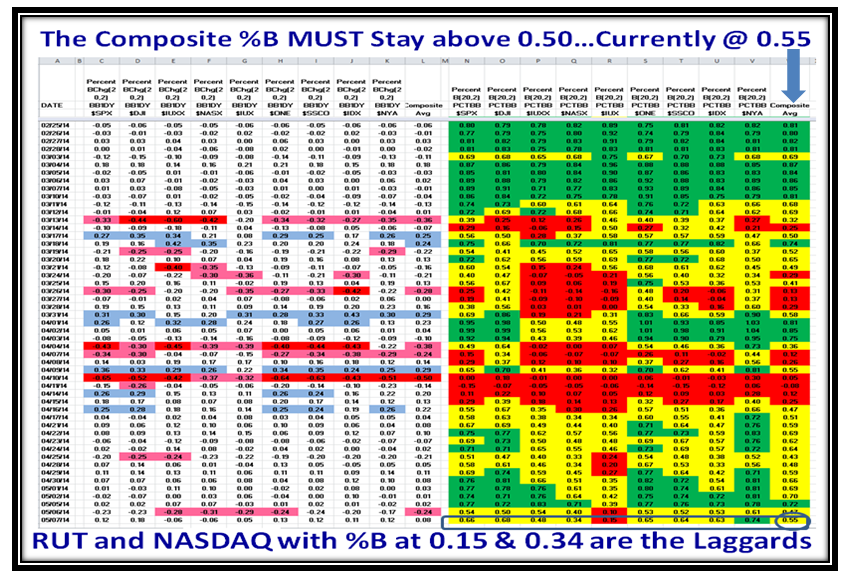
This is a New Chart which shows the relationship of the NASDAQ not to its %B, but that of the Composite %B. We note that at least for today the DJIA, S&P 500, S&P 100 and NYSE pulled the other Laggards up a bit where the NASDAQ %B and RUT are as low as 0.34 and 0.15, respectively.
Now we wait to see which set of Market Indexes either pull the other set up or take the Market down.
Best Regards,
Ian.
