The Latest Feature of HGSI…The Hindenburg Omen Indicator
A technical indicator named after the famous crash of the German airship of the late 1930s. The Hindenburg omen was developed to predict the potential for a financial market correction. It is created by monitoring the number of securities that form new 52-week highs relative to the number of securities that form new 52-week lows – the number of securities must be abnormally large. This criteria is deemed to be met when both numbers are greater than 2.2% of the total number of issues that trade on the NYSE (for that specific day).
For those who are interested in understanding the development of this Indicator, I suggest you Google using Hindenburg Omen and then select the following article, which is the second one down on the list: “Safe Haven – The Past Performance of the Hindenburg Omen Stock Market Crash Signals 1985 -2005”.
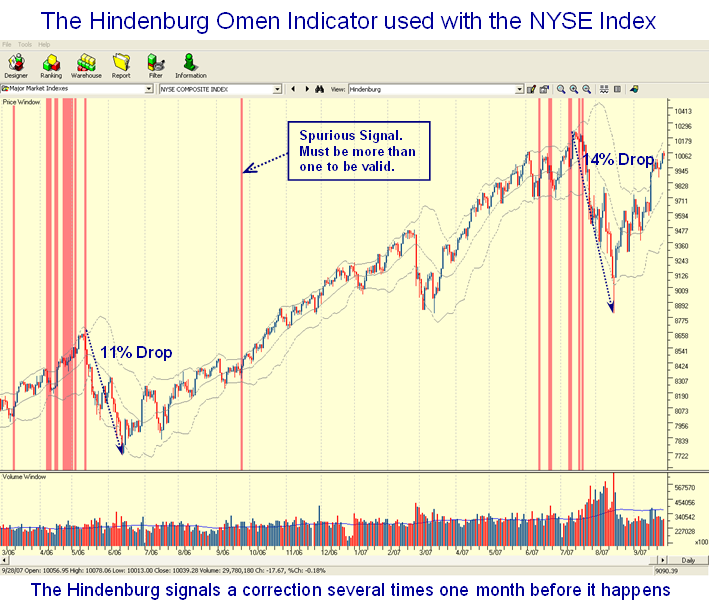
In reading this document, we find that their evaluation of past signals indicate a 77.2% probability that a stock market decline of at least 5% will occur in the S&P 500. There is a 54.5% probability that a sharp decline of greater than 8% will occur as happened in the most recent corrections in 2006 and 2007. There is also a 25% probability of a market crash defined as a >15% correction will occur after we get a confirmed (more than one in a cluster) Hindenburg Omen. As you will see from the Chart View below we have dodged two such bullets in the past year. Since the correction is now over for the recent one in 2007, one would expect there will need to be a similar series of signals before there is a renewed warning that a correction is imminent be it 5%, 15% or something in between. Note that the value of the indicator is that it seems to take at least one month before one gets a sufficient cluster to occur, giving ample warning. HGSI users will also be shown that during this cluster formation in 2006 and 2007, there was a Eureka signal which we know occurs after a long bull rally before a decline occurs. All of this will be discussed in the October 27 to 29 Seminar.
Those who are users of the Monthly Newsletter have known that we were in the process of developing a way to simply depicting the Hindenburg Omen Indicator using the proprietary Visual Filter Back-Test (VFB) feature, and I am happy to say that those attending the October Seminar will be the first to see it included in the Chart Views.
However, I felt all of you would like a sneak preview of this Indicator and demonstrate to you its value in the last two significant corrections in the view below. The HGSI software is the only known software that has this feature included in its bag of tricks and joins the other unique indicators we have developed over the years including Eureka, Kahuna, and Tsunami which I described in one of my earliest notes on this blog. This view demonstrates the value of the HGSI software in depicting the two most recent big corrections as shown in 2006 and recently in 2007.
The bottom line is that when these signals occur in a cluster, it is time to sit up and take notice. That is precisely why we feel this Indicator will be of tremendous value to HGSI Software users. To be fore-warned is to be fore-armed, and HGSI users will be fore-warned from now on.
Best Regards, Ian.
 Ian Woodward's Investing Blog

