The Different Flavors of Grandma’s Pies
We have a Major Improvement in the HGSI Software with its Spectrum Analysis Pie Chart Tool. Let me give you a sneak preview of the kinds of things we can now slice and dice which I label Grandma’s Pies:
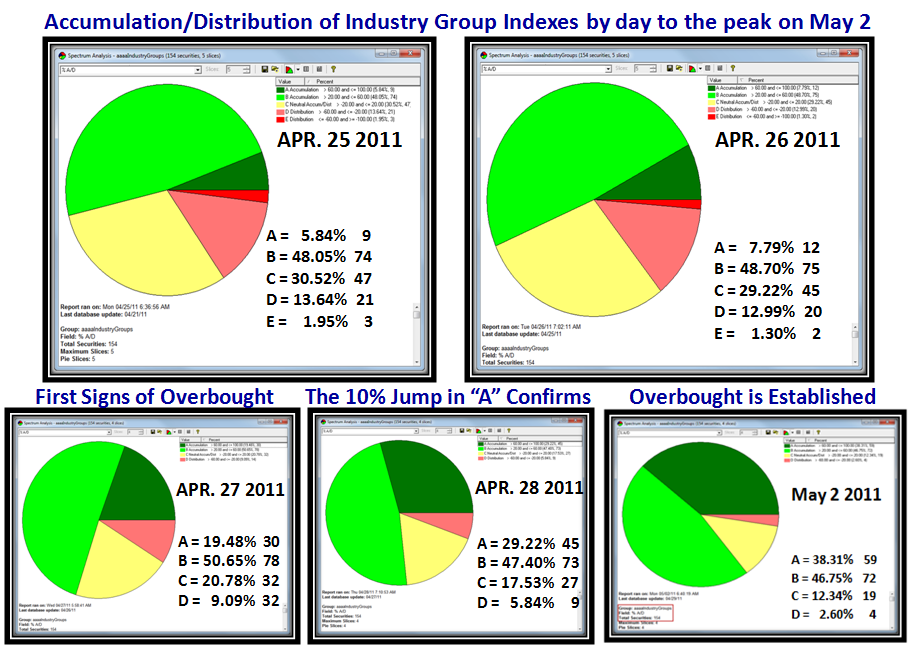
Let me show you some new Slices we can use to understand the Internals of the Market. The first one is the Acc/Dist Function relating to the Market Indexes. As you well know there are five different slices, which I refer to as Knowing your ABCDEs:
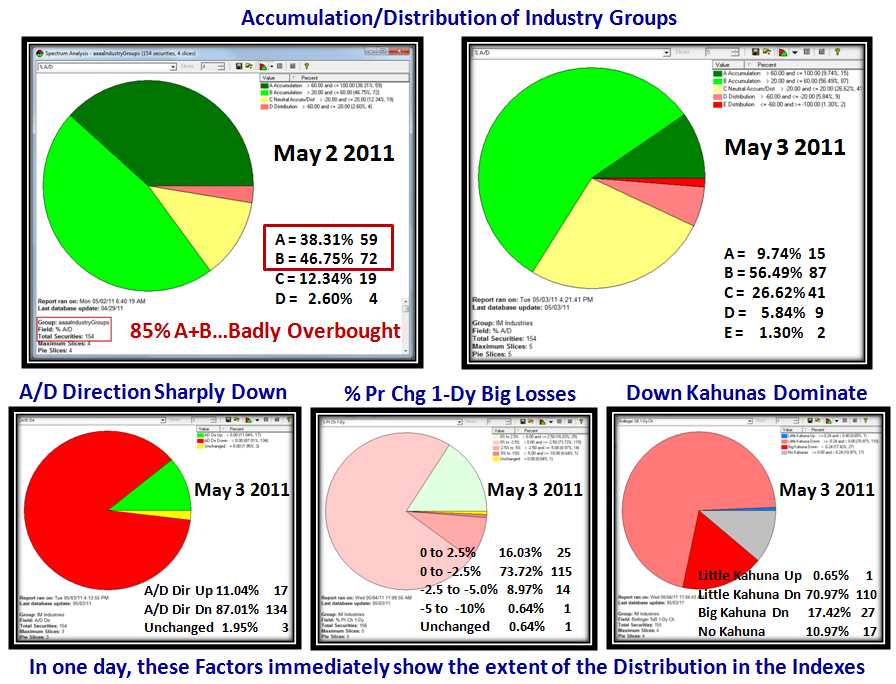
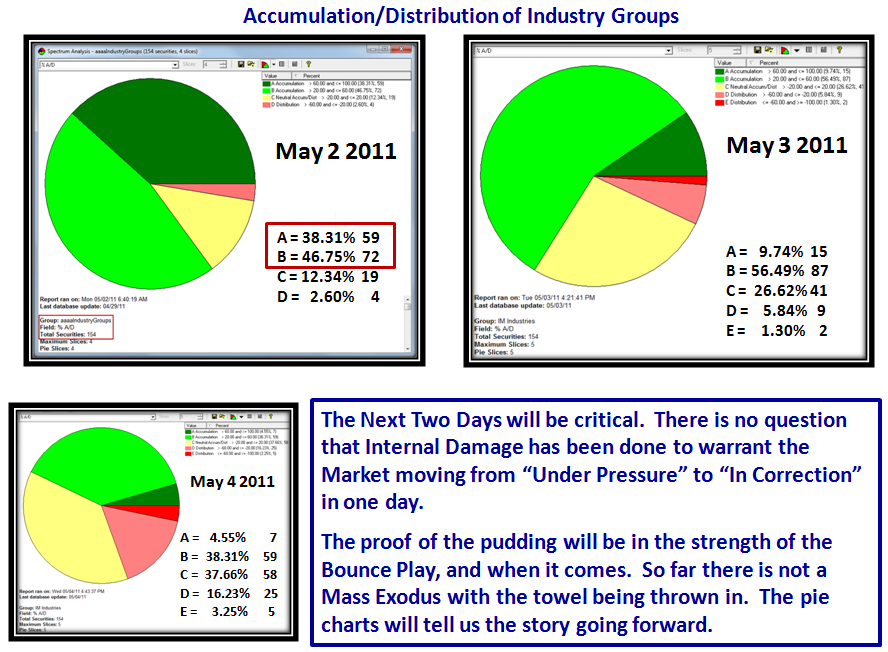
It doesn’t take a minute to see that the Market Indexes had first shown a climax run on Apr 27th. and was truly Overbought by May 2, 2011. 85% of the Market Indexes were either “A” or “B”. But it didn’t take long to confirm that we were headed sharply down in the Internals of the Market as it was just a day later that we could use three new slices to confirm that, i.e., the Acc/Dist Direction, the % Price Chg 1-Day, and the Kahunas both up and down that registered that day:
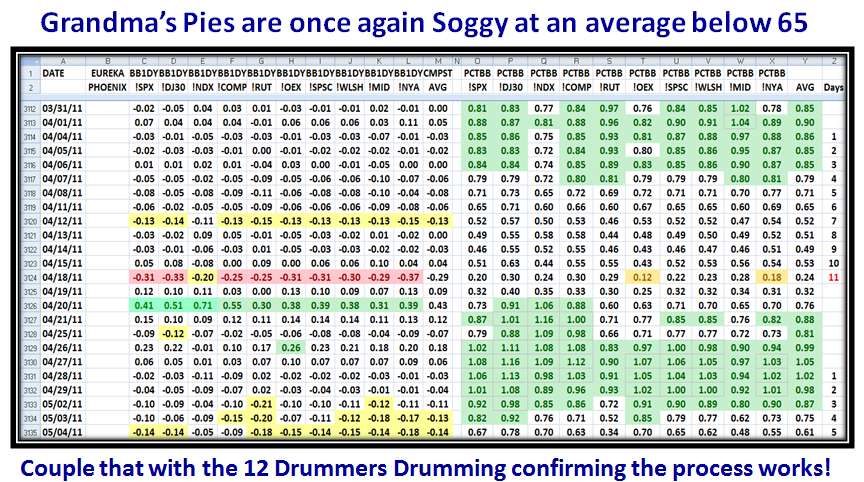
The numbers and pictures speak for themselves and leave no doubt that the Market had turned, and we had only one more day to wait to establish that the market had moved from being Under Pressure to a Market Correction. How much remains to be seen. We have our old faithful view to see the pattern evolve from the Market Indexes reaching a Peak only to be followed by up to 12 Days before we see a deterioration. We are now in the fifth day:
The next two days will be critical. So far there is not a Mass Exodus with the towel being thrown in. The pie charts will tell us the story going forward. The proof of the pudding will be in the eating with the strength of the Bounce Play, and when it comes.
Stay tuned and it won’t be long before you can do this for yourselves. Ron and I will keep you updated.
Best Regards, Ian.
 Ian Woodward's Investing Blog