Ian Woodward's Investing Blog

Archive for the ‘Market Analysis’ Category

Stock Market: Happy Thanksgiving!

Saturday, November 23rd, 2013

We have a lot to be thankful for despite the difficult market that keeps confounding the gurus as they try to call the top in this overbought market.  We are only a week away from the start of the Santa Claus Rally and there are still few signs of a breakdown except for the Canaries which are long in the tooth and taking a breather.

Thanksgiving Picture

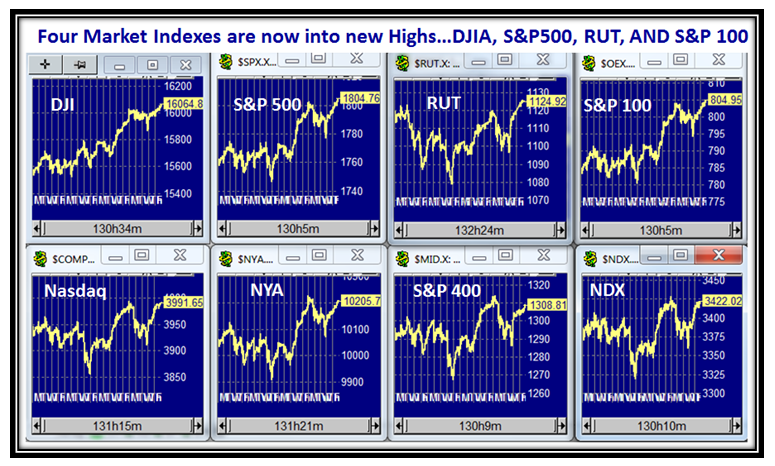
The long march upwards continues with four of the eight Market Indexes into new high territory this week:

Thanksgiving Indexes

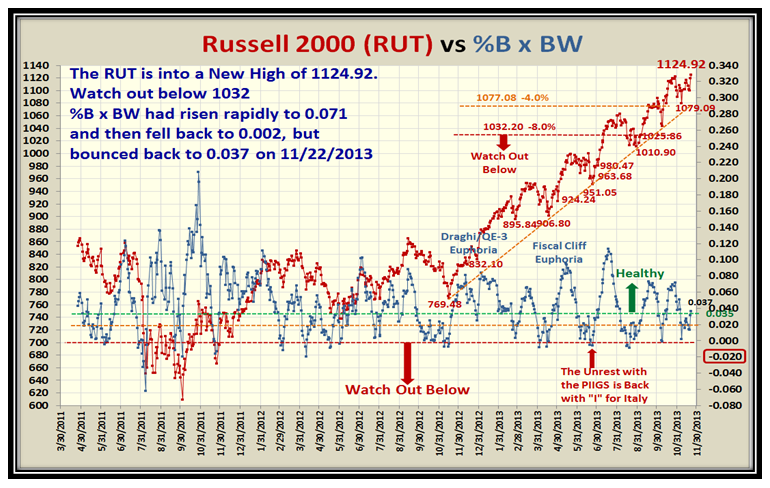
The Russell 2000 (RUT) is back in high gear and into new high territory as the small cap stocks take command once again:

Thanksgiving RUT

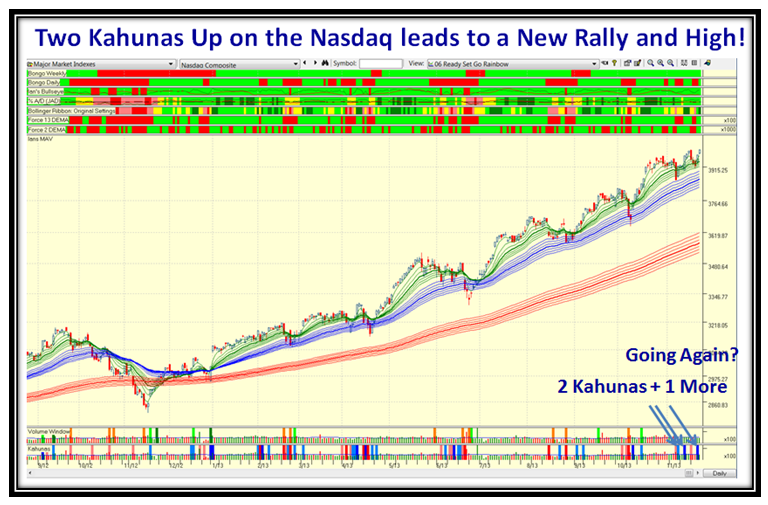
In the past three weeks since the October Seminar, although there have been Knee Jerks, the Markets and the JIRM Index show that at this point in time there are no signs that the big guns want to throw in the towel and take this Market down:

Thanksgiving Nasdaq

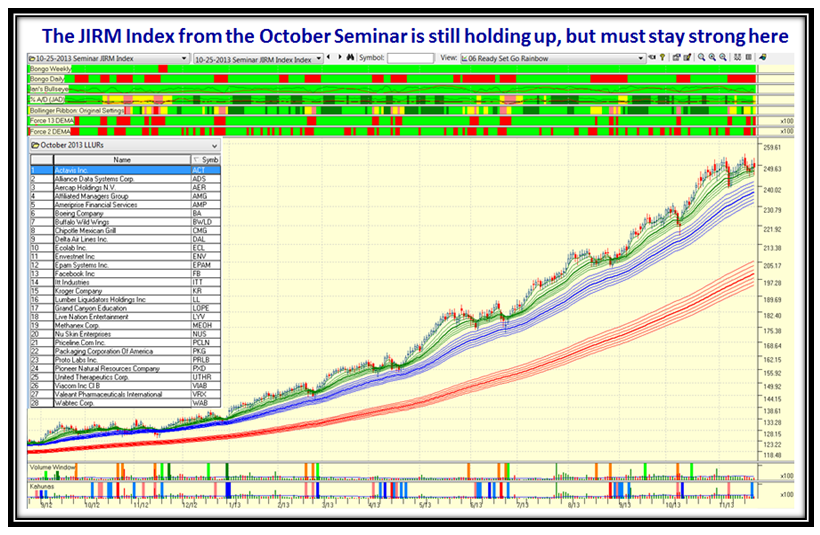
…And here is the JIRM Index which again is still holding up, but must continue strong here to avoid a triple top.  Please note that the clusters around the 17-dma (green) have NOT collapsed, which is a good sign as it too reaches into New High Territory:

Thanksgiving JIRM

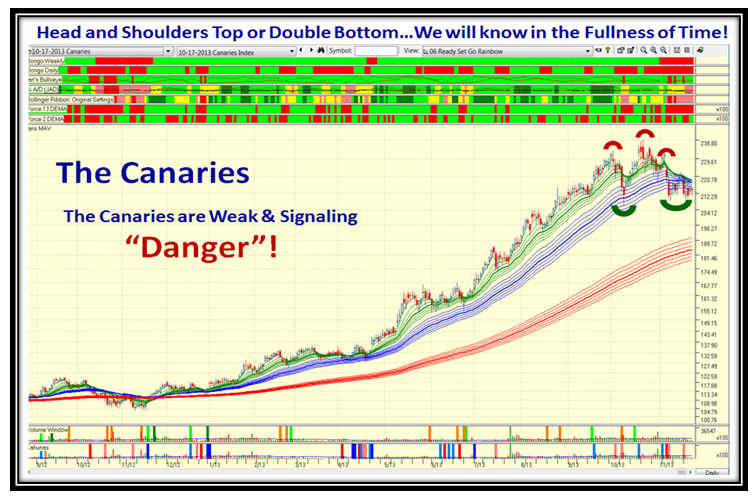
The Canaries are suggesting Danger ahead, but these have had a very long and envious run so it is to be expected that there would be profit taking, and these have fulfilled their role for us in being the first to signal a correction may be at hand.  Note the value of the Rainbow charts which quickly show that when a cluster around the 17-dma eats into the 50-dma cluster we have fair warning that a potential big fall is about to happen.

Thanksgiving Canaries

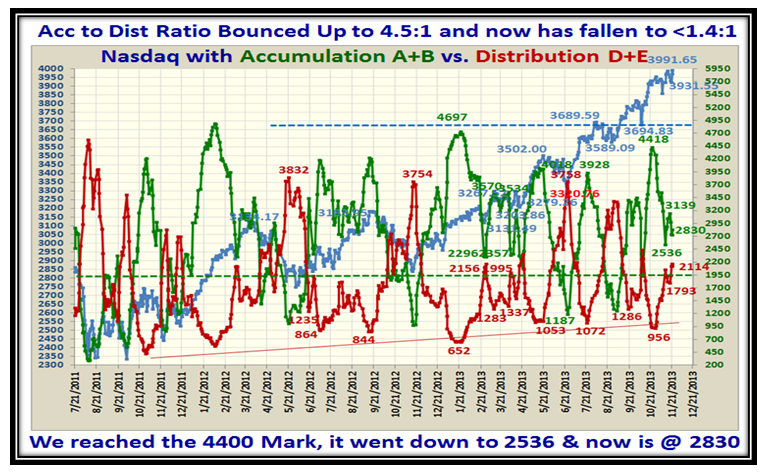
Now for a look at the Internals with regard to the abcde’s…the accumulation of A+B vs. D+E.  Having hit a high of 4418 three weeks ago we are back in the doldrums and heading for stalemate with a ratio of 1.4:1:

Thanksgiving abcde

It goes without saying that the opportunities are primarily very short term…quick be nimble and nimble be quick action:

Thanksgiving Pat

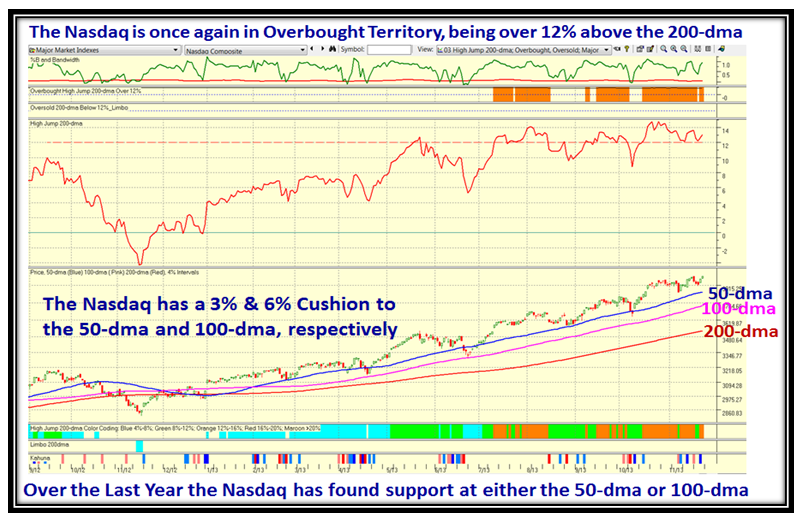
…And now for the So What?  Despite all the fru-frau of overbought and very extended, the NASDAQ has a BIG CUSHION before major damage can be done.  Unless we have a huge knee jerk down, we should have plenty of warning that a major correction of 12% or more  is underway.

Thanksgiving Nasdaq 2

Have a Happy Thanksgiving to you all!

Regards,

Ian.

Stock Market: Two Days of Wibbly Wobbly!

Sunday, November 10th, 2013

Thank you for your patience…we had a great seminar and I am back with all sorts of goodies for you to digest and enjoy.  This chart says it all and the rest back it up:

Crazy Picture

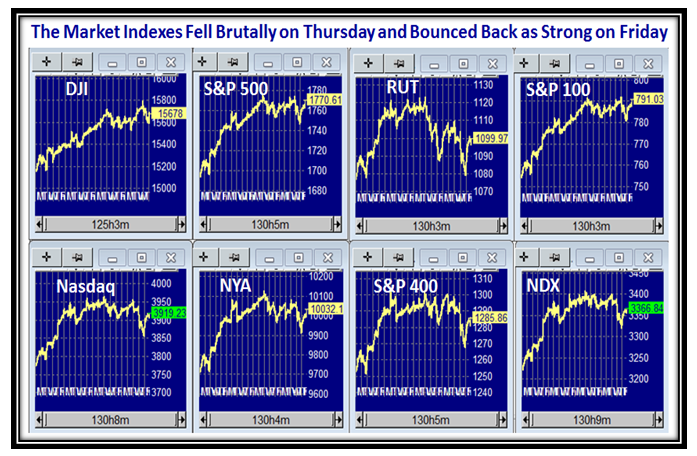
Here is the picture of how the Major Market Indexes have behaved the last twenty days:

Crazy Indexes

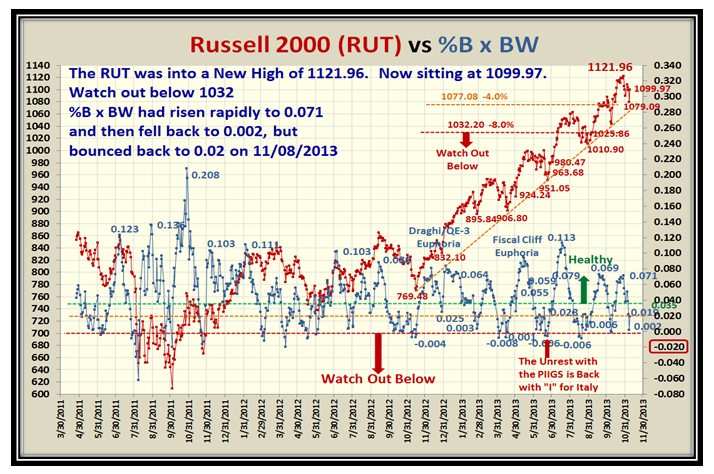
The Russell 2000 (RUT) keeps chugging along bouncing off a 4% Correction as it leads most of the other Indexes upwards:

Crazy RUT

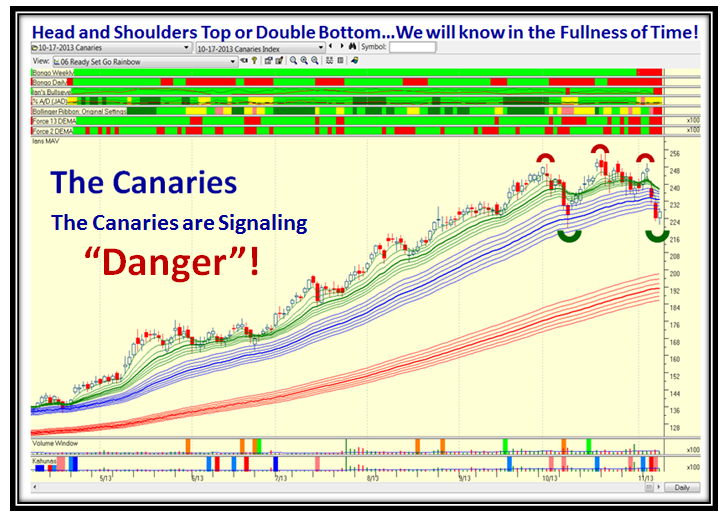
That little trick of mine is working well…I’m sure you recall the Canaries I gave you to watch as being the first clue when the Market is extended.  They are at equal balance between a Head and Shoulders Top and a Double Bottom.  Next week should show the direction of a correction first before Thanksgiving and then up for the Santa Claus Rally into the New Year or a Bounce Play off a one day blip which continues up:

Crazy Canaries

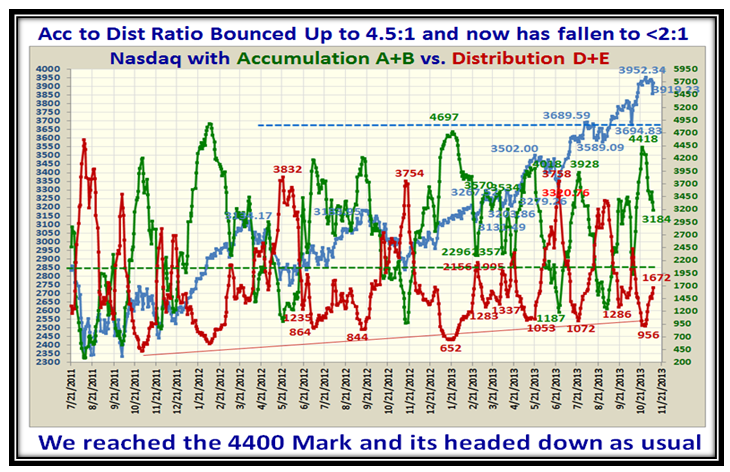
The Accumulation to Distribution Ratio hit a peak of 4.5:1 and in usual fashion has backed down these last nine days to a 2:1 ratio:

Crazy abcde

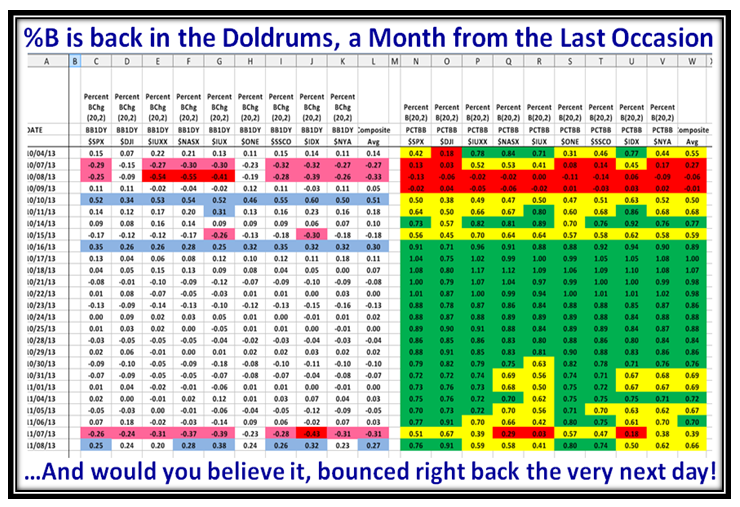
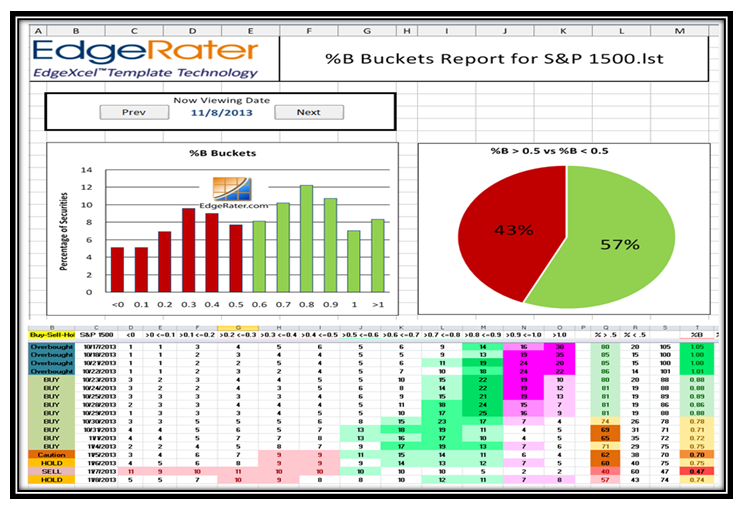
As the days roll by into months and years, I am more and more comfortable that Bucket Skips, i.e. Kahunas up and down coupled with 12 Drummers Drumming is the key to knowing the swings in the market, but you judge for yourself, where this picture says it all once again:

Crazy Drummers

Of course the pattern changes over time, but one gets a sense of the pulse and rhythm of the market if you watch this inter-relationship.  We are now sitting at around stalemate on Grandma’s Pies and this week should define the direction until Thanksgiving.

Crazy Pies

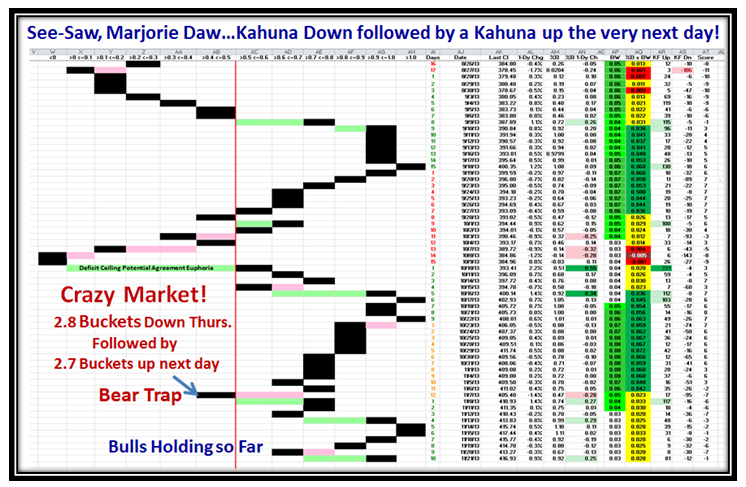
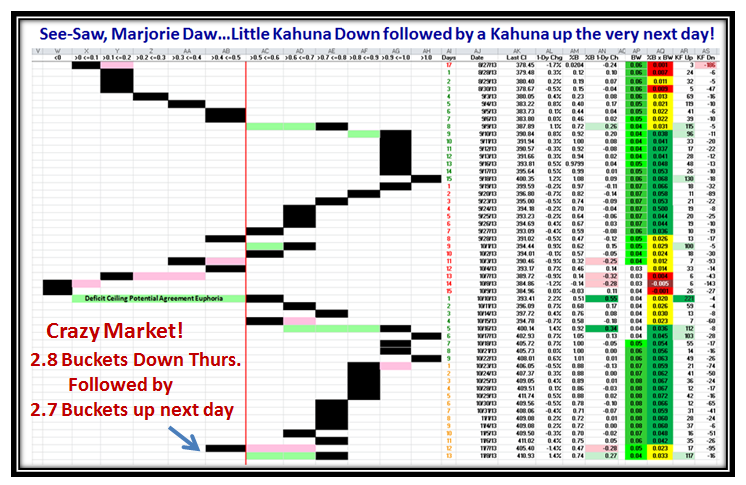
…And here is the See-Saw, Marjorie Daw Market we are putting up with:

Crazy seesaw

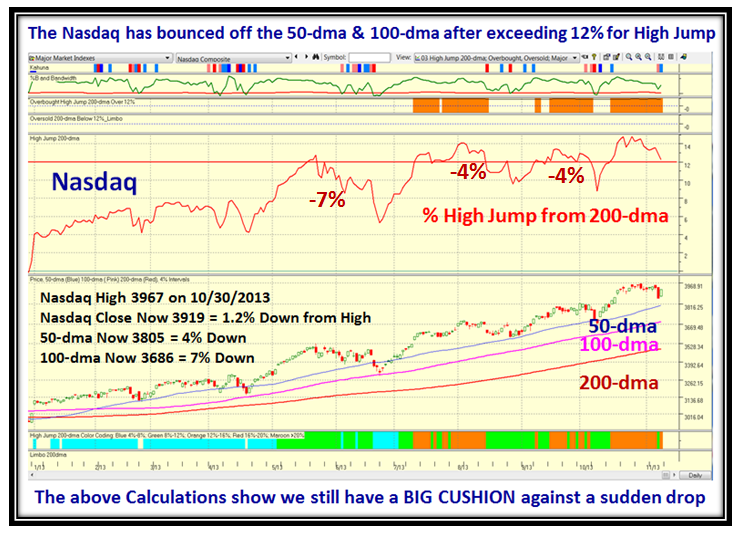
The calculations on the High Jump Chart says it all as to what to look out for to stay on the right side of the Market.  Despite the Gloom and Doom, the main message is that we still have a decent cushion before the real fear should set in so watch carefully with tight stops and be on guard:

Crazy Jump

Have a good week and Best Regards,

Ian.


Stock Market: Canaries are Gasping in the Coal Mine

Tuesday, October 8th, 2013

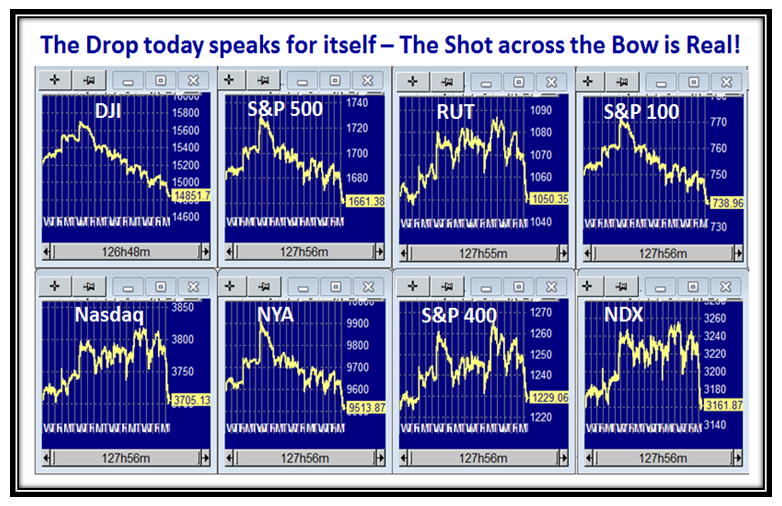
I am sorry I am late with the obvious news but I have been working feverishly for the HGSI Seminar we will be holding in a little over two weeks time.  As I write this in mid-morning we have a Major shot across the bow and the big institutions are cashing in.  Why so you ask?  Because I warned you that when the Institutions hit the Canaries big time, the party is probably over and they are in the process of doing that right now.

Canaries Picture

The picture of the eight market Indexes which you are familiar with speaks for itself:

Canaries Indexes

I’m sorry to belabor the point, but you will remember this concept well and truly from now on:

Canaries Canary

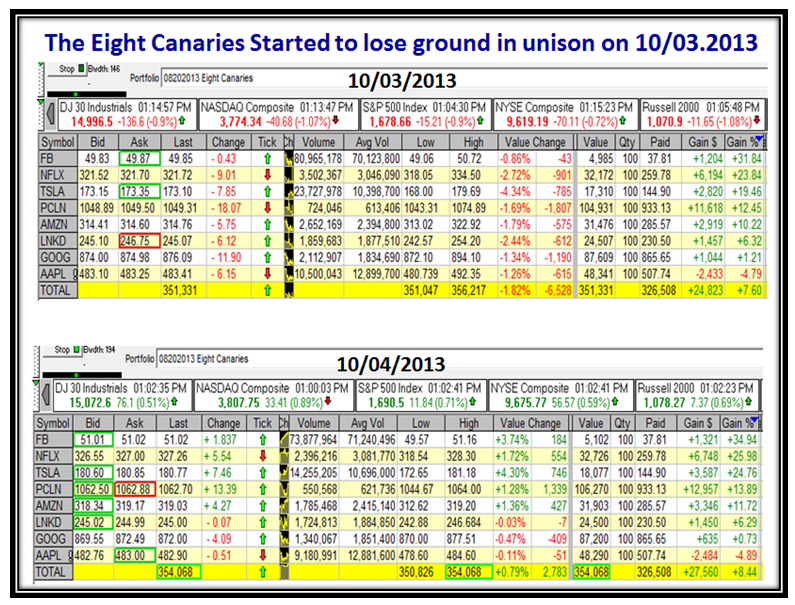
Now for the latest week’s fodder that confirms what I said to you many moons ago about watching these eight stocks:

Canaries Data

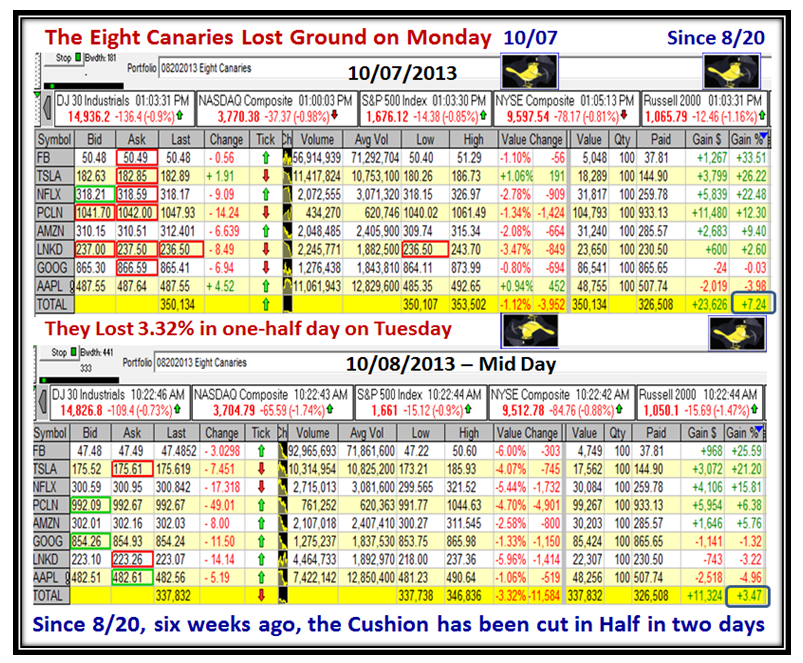
…and here is the latest hot off the press with the most recent mid-day data shown below:

Canaries Data2

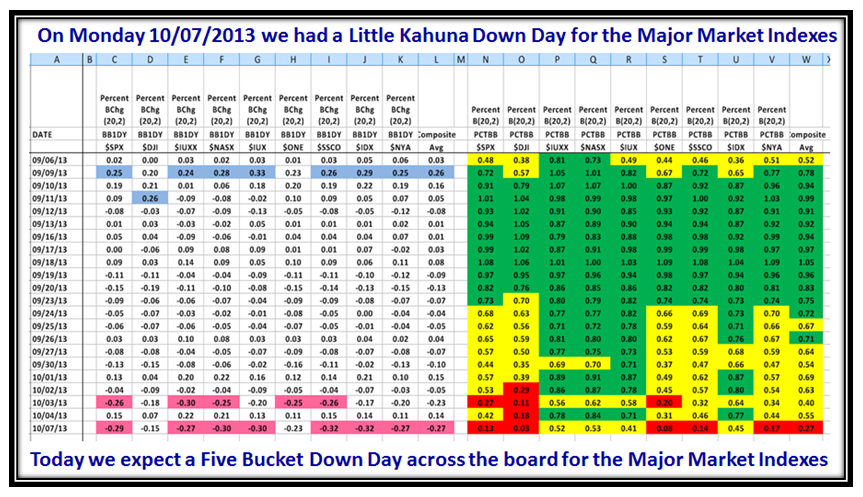
…And last night’s Little Kahuna down on most Market Indexes suggested we were in for the floodgates opening today:

Canaries Indexes2

Hurry, hurry, hurry to sign up for the seminar where we have raised the bar yet again!

Best Regards,

Ian.

Stock Market: Miracles Happened Overnight!

Wednesday, September 11th, 2013

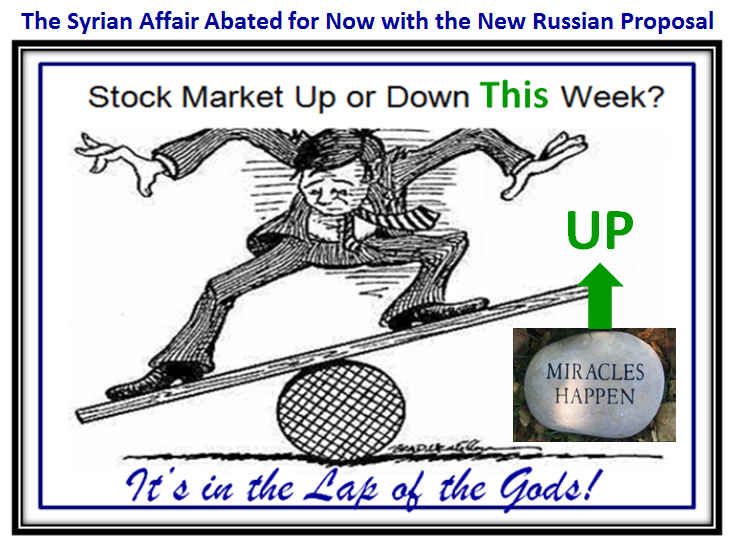
Before I address the Market, let me pause to Remember this fateful day which is all on our minds:

Miracles Picture

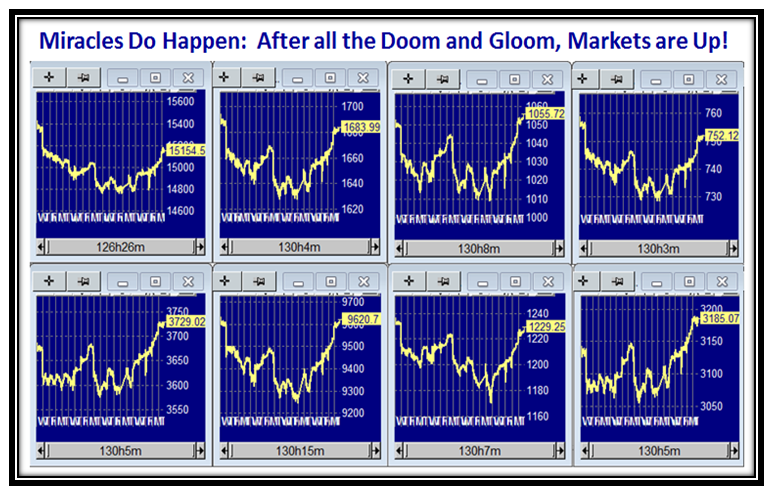
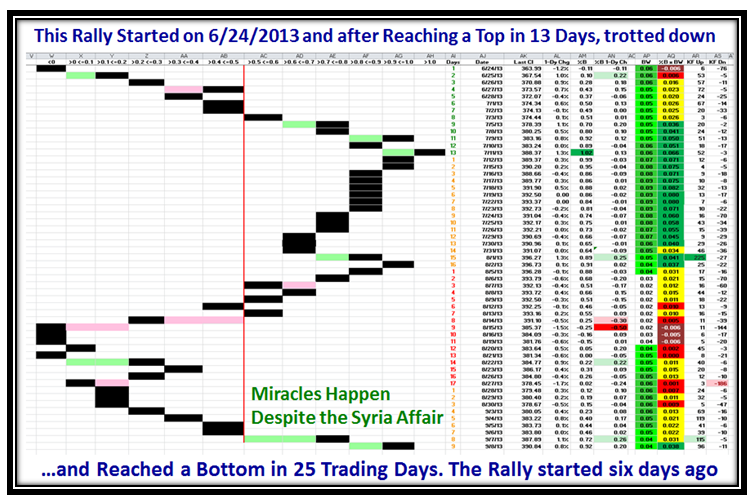
Out of the Blue with all the Gloom and Doom around us with regard to the Syrian Affair, we got a Miracle:

Miracles Market

…And here to prove it the Markets were all up on Monday and Tuesday, and holding today:

Miracles Market2

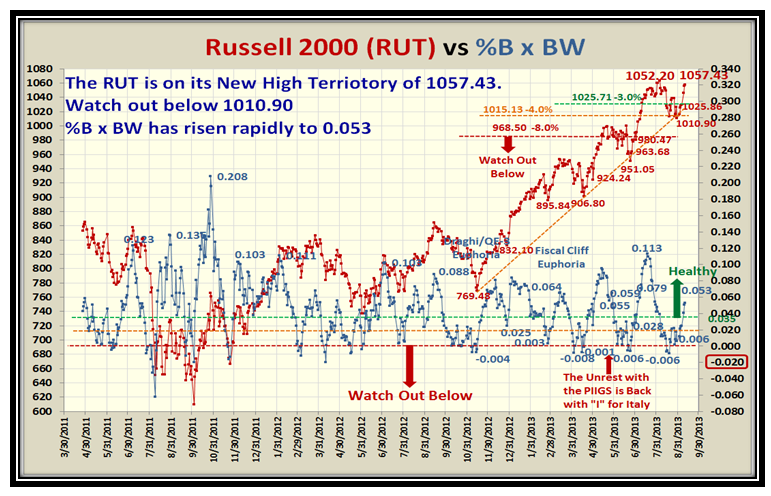
The RUT is flying high again at Mid day on Wednesday morning as I write this blog note:

Miracles RUT

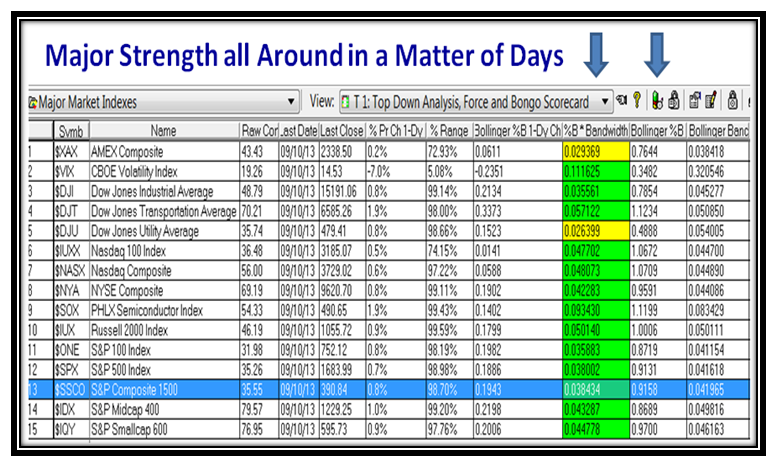
It doesn’t take two seconds to see the strength come back into the Market in the last couple of days:

Miracles Market3

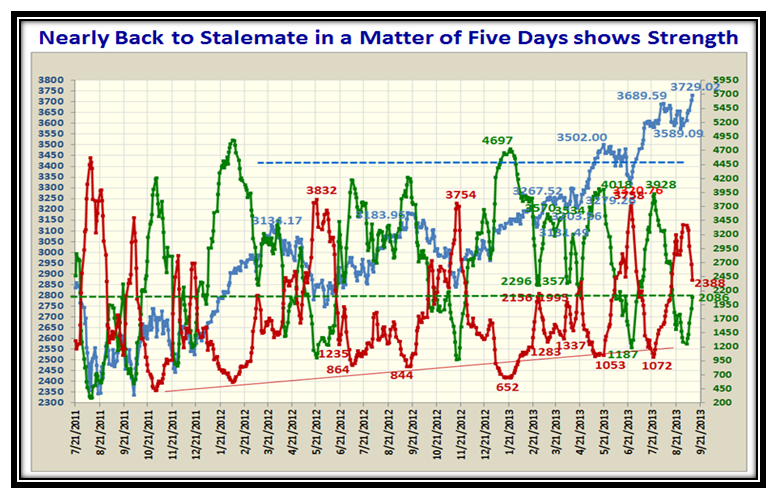
Even the Accumulation vs. Distribution Ratio is almost back to Stalemate:

Miracles abcde

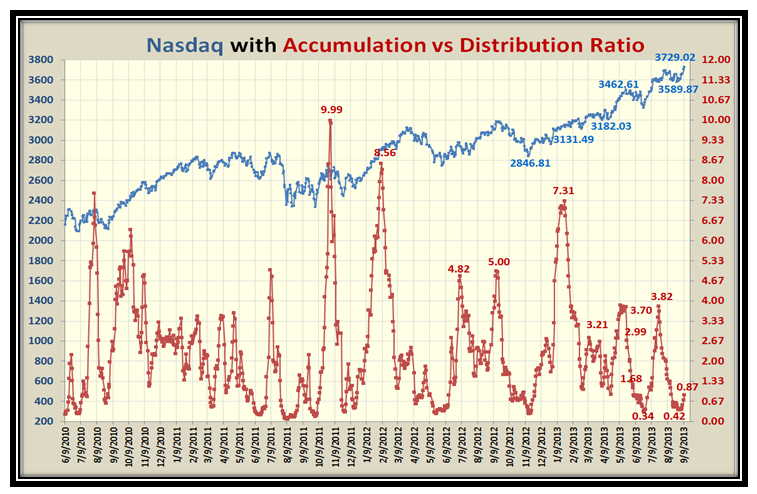
With the Ratio this low at 0.87 and the NASDAQ into New High Territory, it suggests we have a lot higher to go.  We’ll see:

Miracles Ratio

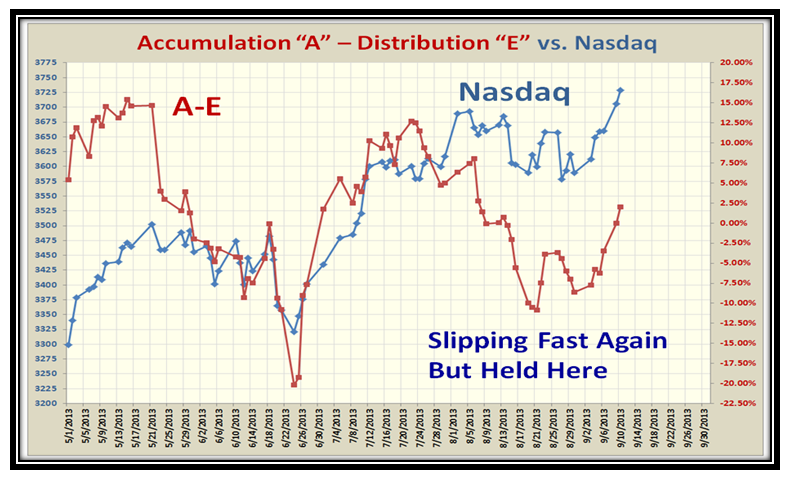
Even %A-%E is showing signs of life again:

Miracles a-e

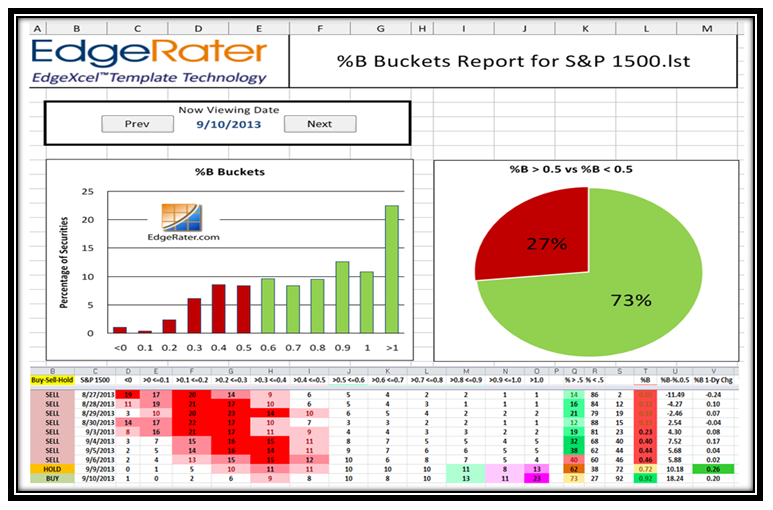
Grandma’s Pies show the Bulls are back in control:

Miracles Pie

…And last but not least, look at the Bucket Skips the last two days, showing the Bulls are back in control:

Miracles Pat

Many thanks to all of you who wrote to wish me for my Birthday last week.

Best Regards,

Ian.

Copyright © 2007-2010 Ian Woodward
Disclaimer: Commentaries on this Blog are not to be construed as recommendations to buy or sell the market and/or specific securites. The consumer of the information is responsible for their own investment decisions.