Ian Woodward's Investing Blog

Archive for the ‘Market Analysis’ Category

Snakes and Ladders in a Yo-Yo Market

Monday, September 5th, 2011

I need hardly tell you that this coming week is a Do or Die Week for the Bulls!  Mark my words, Friday September 9th. will be a Pivotal Day!  On September 8th, President Obama delivers his jobs/economic address to a joint session of Congress, and the airwaves will be a buzz with the Market’s and Pundits’ reaction to his speech.  We hope it will be one with reasonable specific actions to re-assure the Markets of significant improvements to come for the short and long term future of this country.  If not, expect more turmoil, as we are already in a Snakes and Ladders Market.

Hold your horses…we may not have to wait that long as Late Breaking News from my good friend Manu says ” European Stocks Fall Sharply as Debt Fears Hit Banks”, and here are the results to prove it:

Oh well, enjoy your Labor Day Weekend, and as Doris Day used to sing “Que Sera, Sera! Whatever will be, will be”:

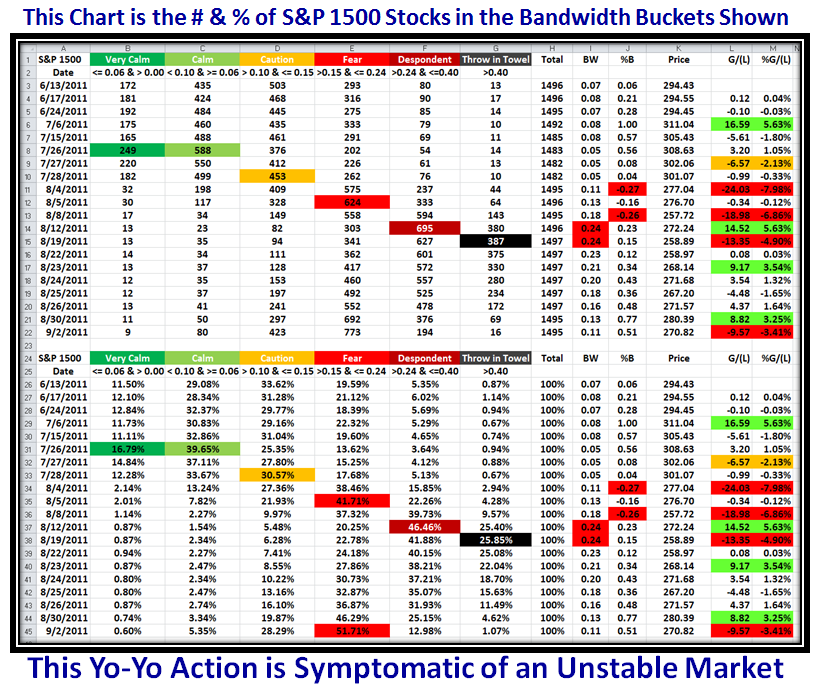
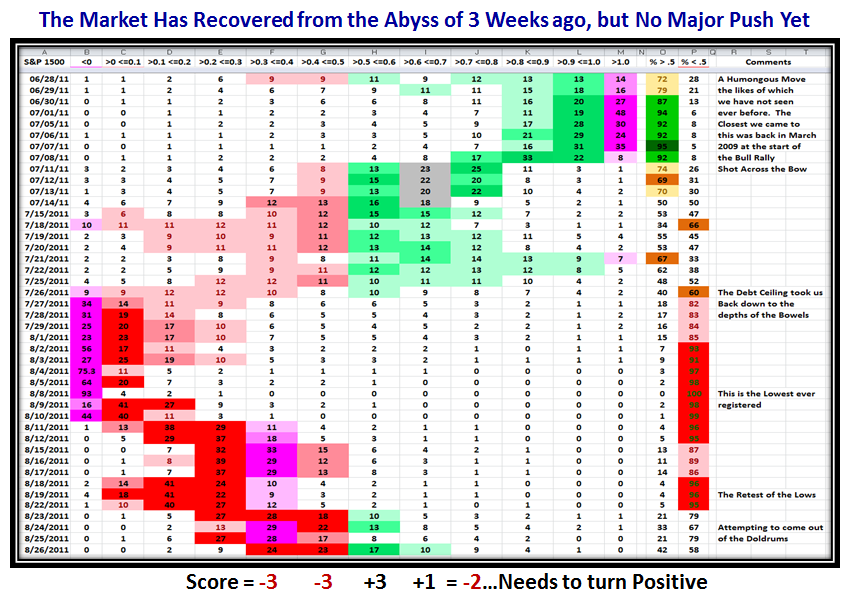
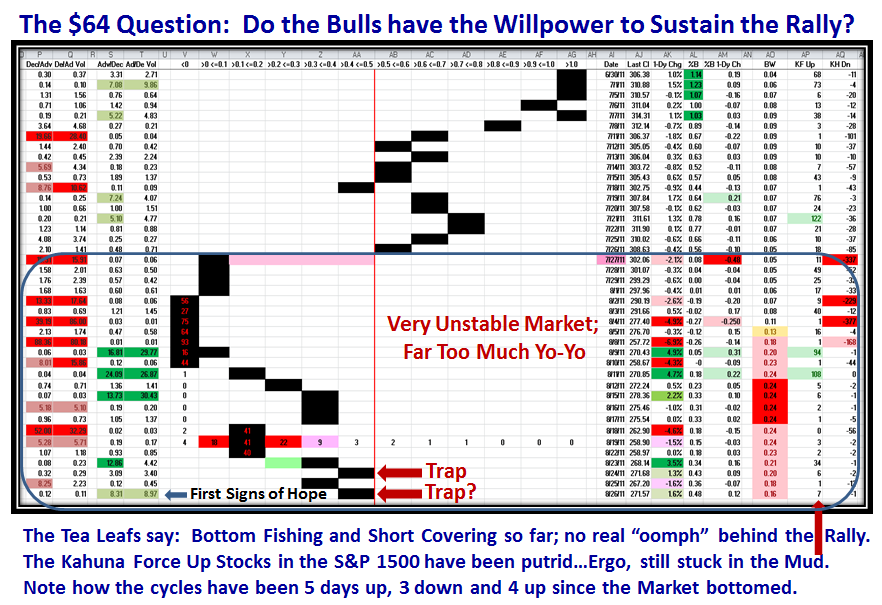
Now on to the “Good Stuff”.  Here is a dose of Bandwidth Buckets to bring you up to date on the work I have been doing on this score.  In the following chart, I have milked the Concept of Buckets and have kept a log of the progression of how the various Buckets have been filled for Bandwidth criteria as shown on the chart ranging from Very Calm all the way up to Throw in the Towel.  My good friends Ron Brown and Steve Paris filled me in with past data to help build this picture.  It captures the decay in the market very well inside three weeks from Very Calm to Throw in the Towel:

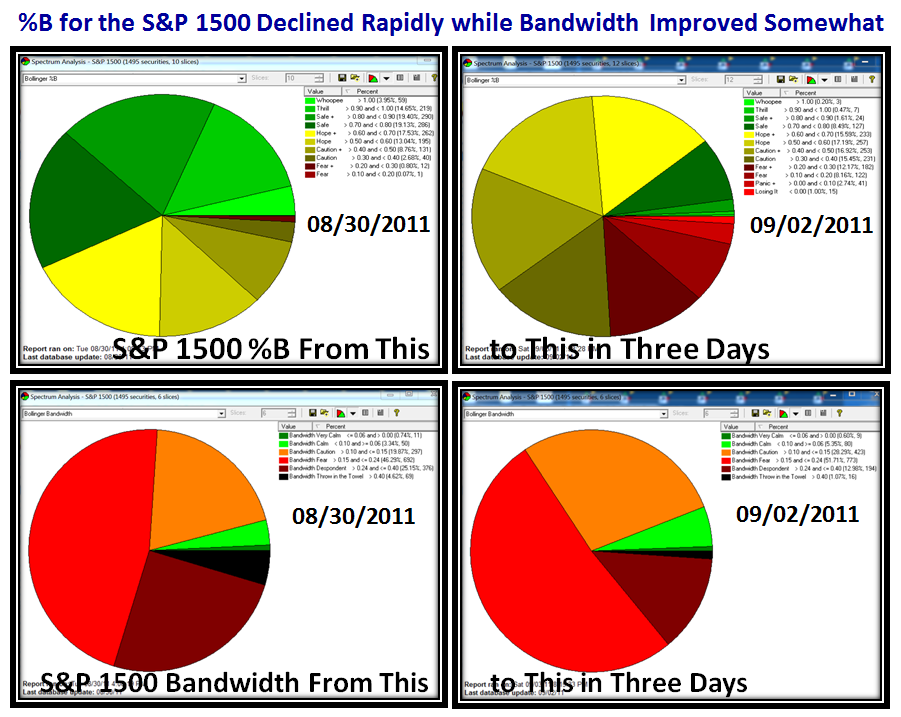
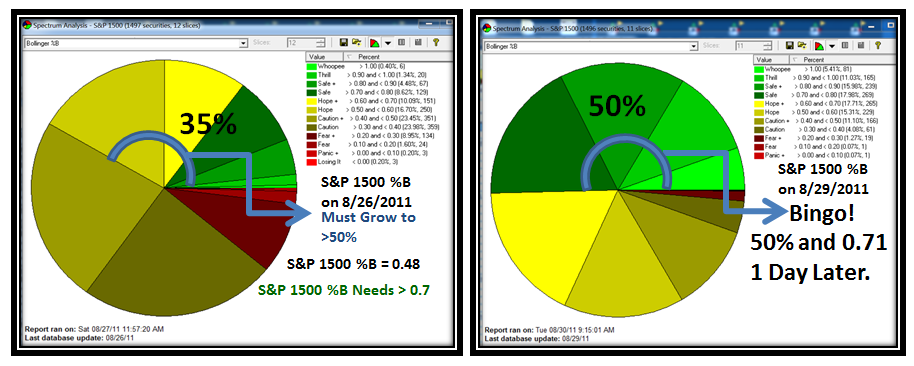
…And here for good measure are the Pie Charts for both %B and Bandwidth for the S&P 1500 comparing the change in three days, where things were looking rosy on 08/30/2011 and then took a major turn for the worse on this last Friday, 09/02/2011.  You can immediately see the Sensitivity of %B as it changed from Sunshine to Gloom and Doom:

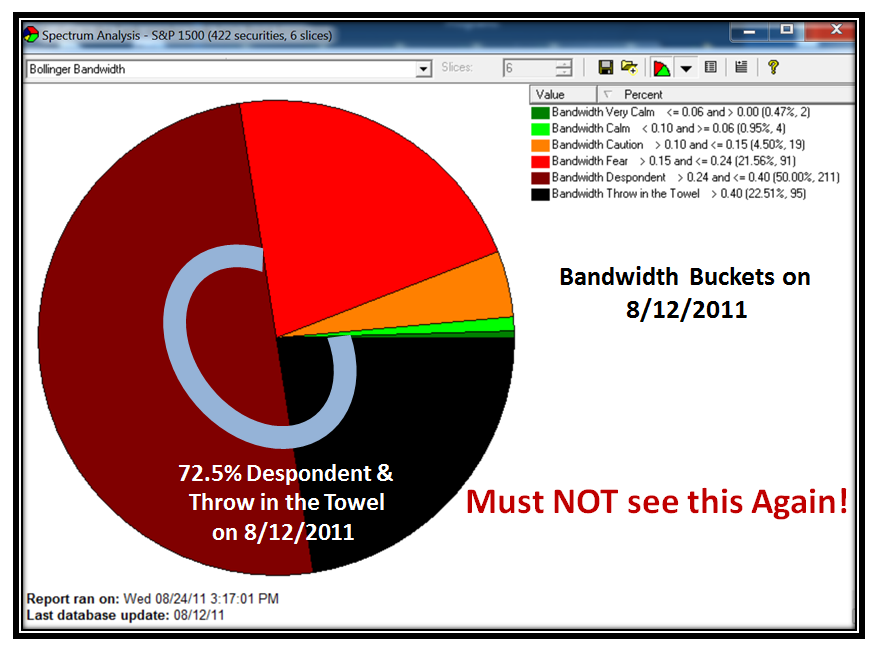
Just as a reminder, here is what the picture looked like for Bandwidth Buckets on 8/12/2011 when the Cave was falling in, and I remind us that we don’t want to see this same picture any time soon, or else it is curtains for any Bounce Play, Tepid Rally or Market in Confirmed Uptrend or whatever name you choose to call it:

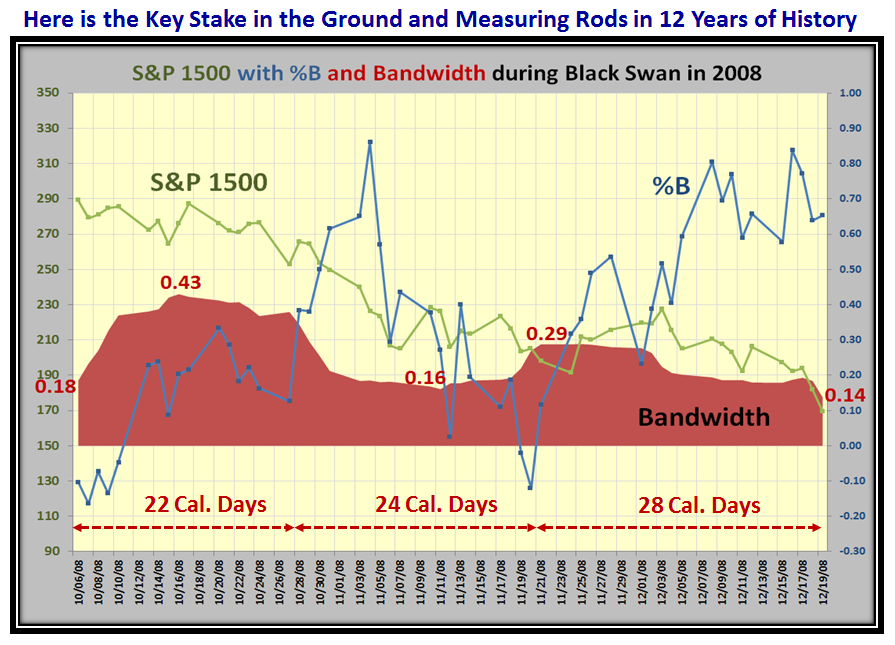
Now here is the picture of what we endured during those dark days of 2008 when the Market fell like a rock to become known as Black Swan.  It gives us the Key Picture for any Benchmarking on Bandwidth for the future…let’s hope we don’t dwindle to this picture:

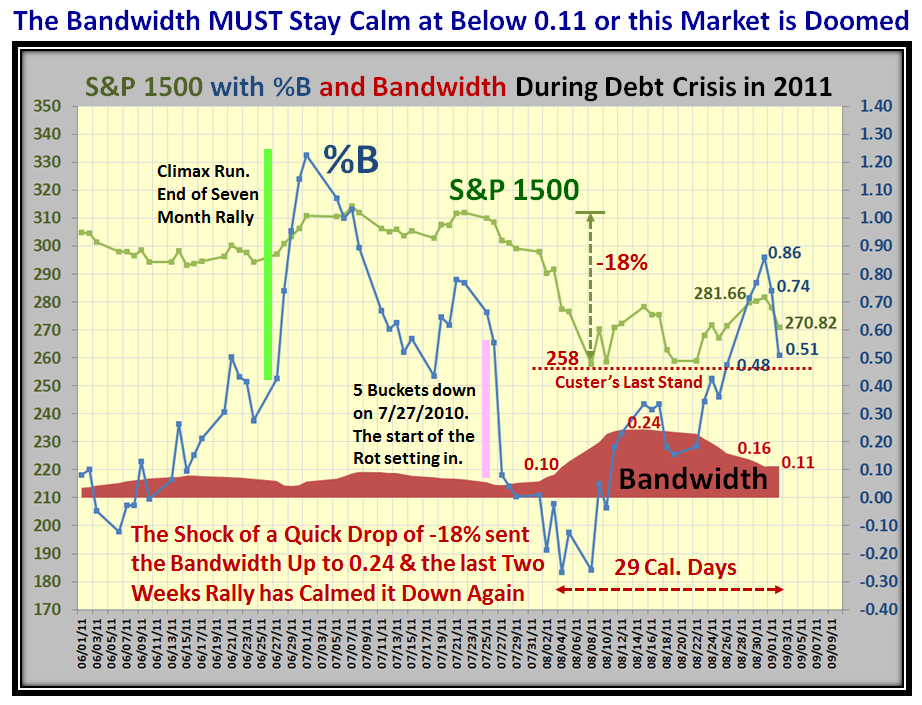
…And, here is the picture as we sit today.  Notice that I show the early warning clues for the Climax Run we experienced at the end of a seven month rally, and then the notorious and unprecidented five bucket fall that came on 7/27/2011 to wash out the entire Market with a -18% drop in a matter of a few days:

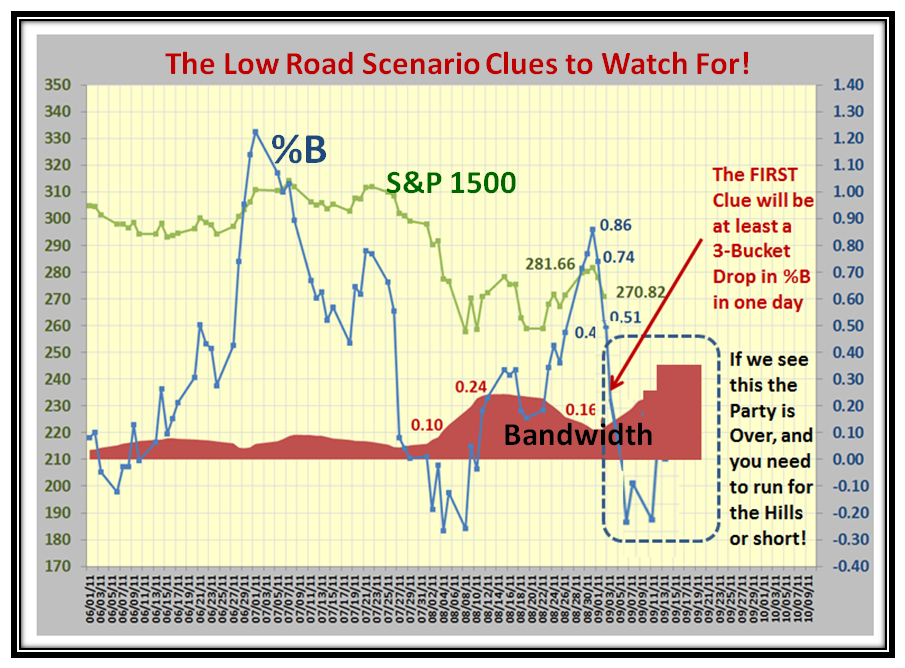
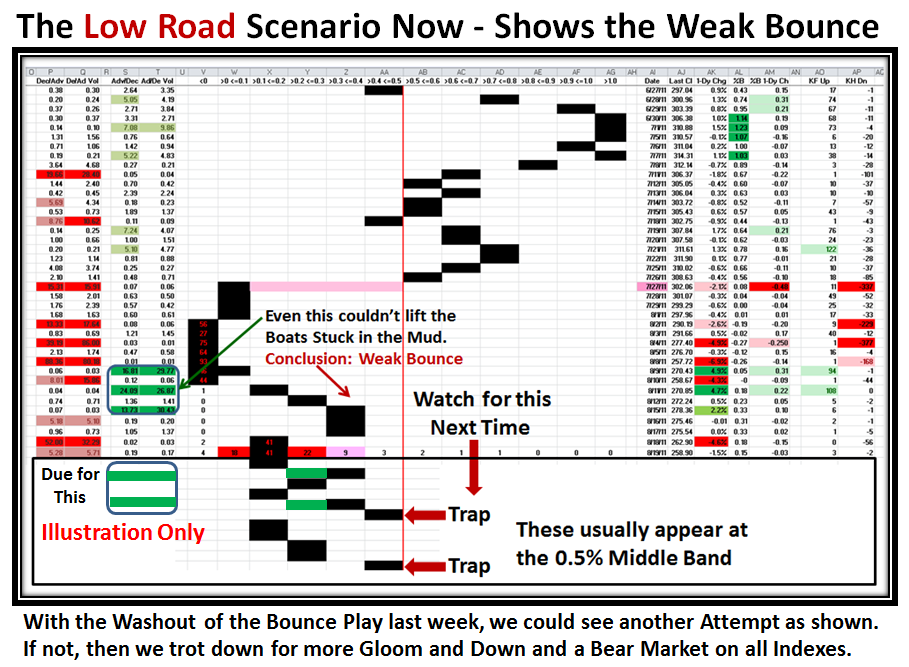
So  I am sure you are asking “What are the Low and High Road Scenarios for next week?”  Here is the Low Road:

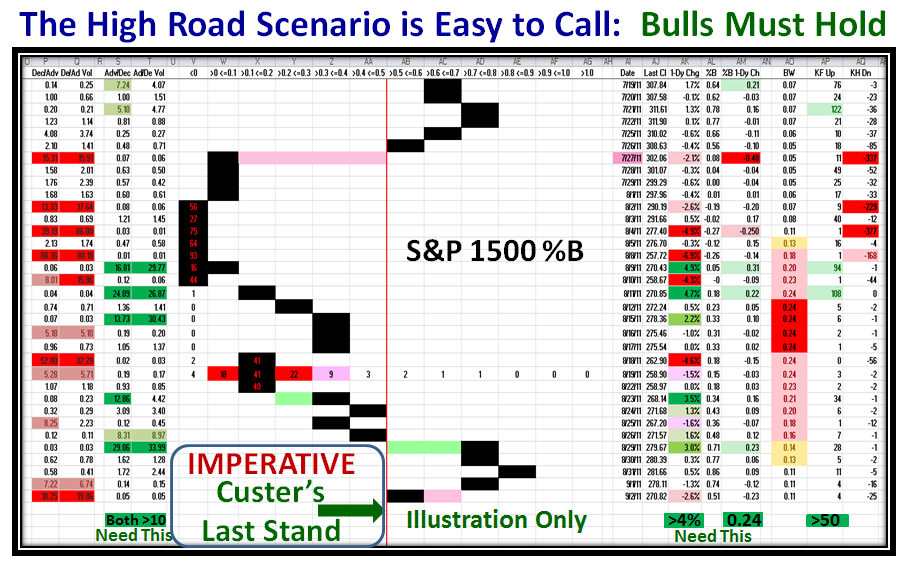
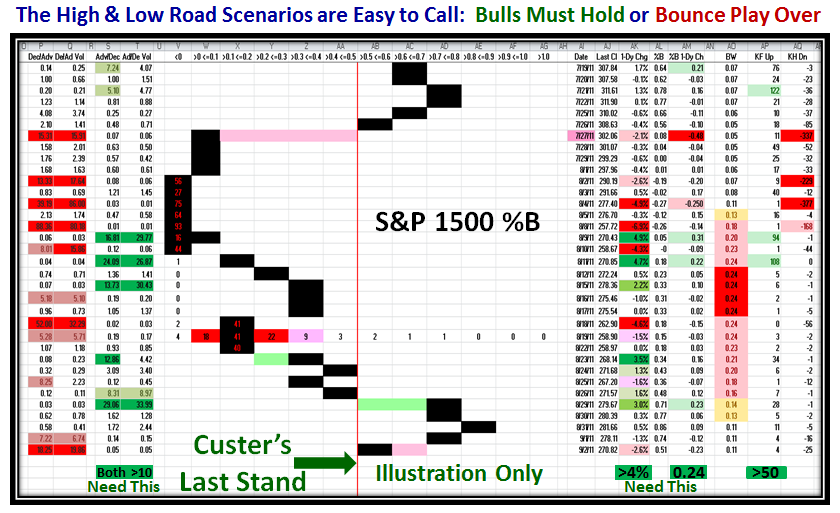
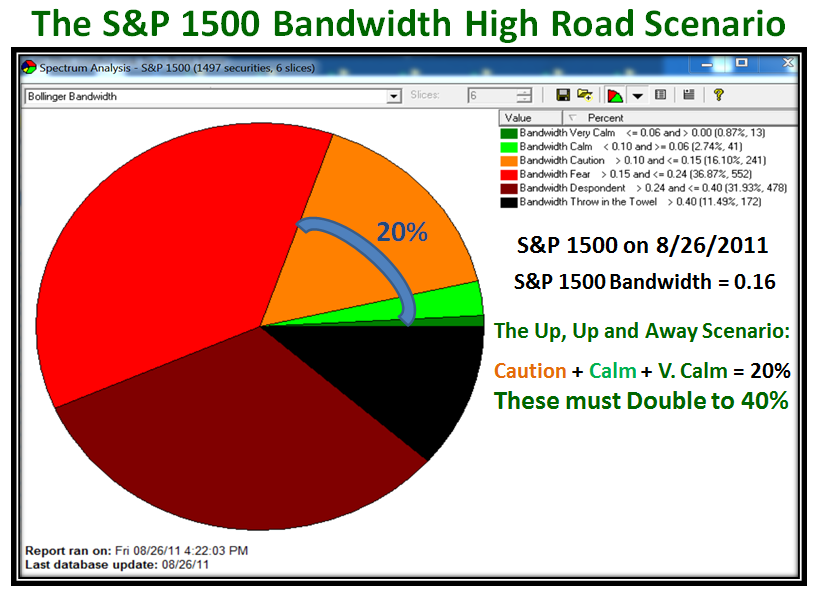
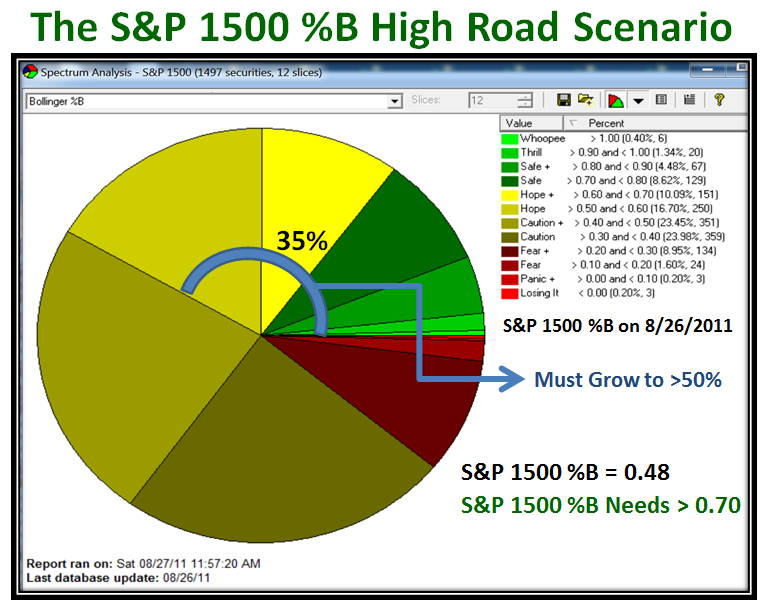
…And here is the High Road which I gave you just yesterday to make sure you keep this one in mind…Custer’s Last Stand for the Bulls for this round:

My sincere thanks to all of you who wished and wish me for hitting a milestone of an octogenarian tomorrow…I hope it is a good day on the Market!

Best Regards, Ian.


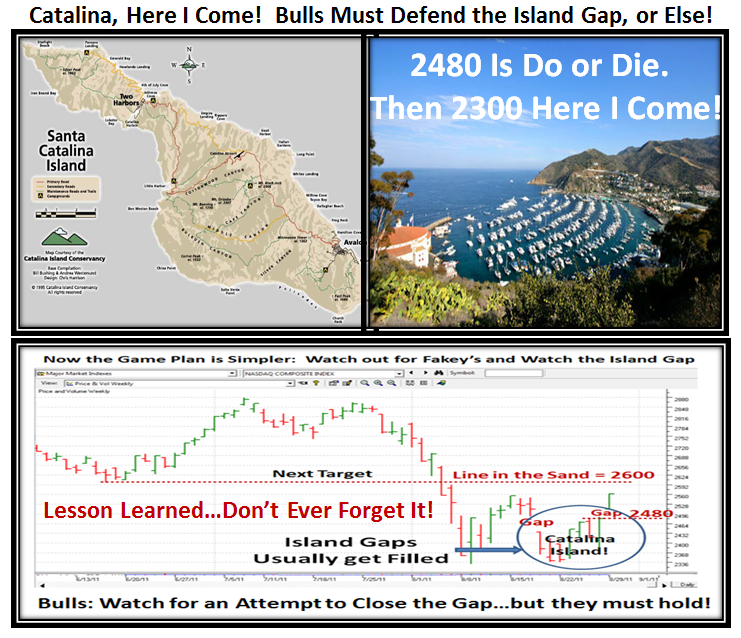
Bulls Must Defend the Island Gap, or Else!

Saturday, September 3rd, 2011

The Bounce Play lasted a few days and then the Island Gap I discussed last week was too enticing for the Bears to fill, and fill it they did with a vengeance on Friday.

So now the Real Fight begins at Custer’s Last Stand.  Ideally the Bulls must show strength and MOMENTUM to continue the Bounce Play above 2600 and on to 2700, or fizzle out and then watch out below 2300 as shown on the next chart:

…As we can see from the next chart we are at the Stalemate Line after a decent move to 0.86 and only to fall back to 0.51 for %B on the S&P 1500.  I identify  what is needed from the Bulls next week in order to maintain the Rally at Custer’s Last Stand as shown in the Illustration:

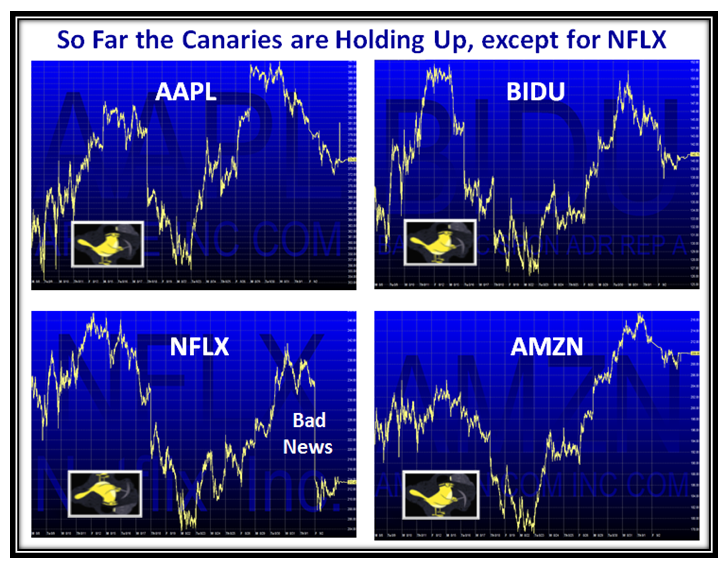
The one encouraging note in all of this is that three of the four Canaries are holding up, but NFLX had bad news last week and has given up the ghost for now:

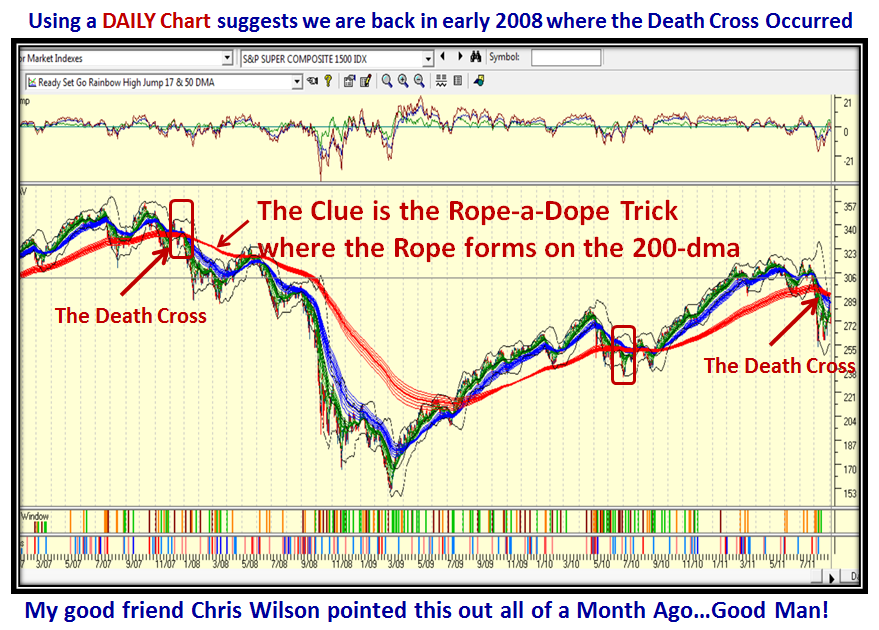
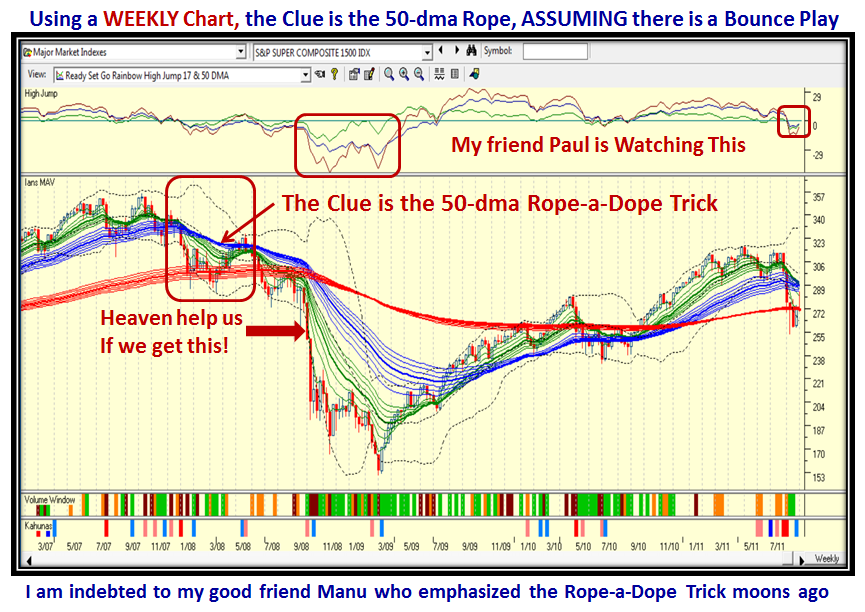
The bigger concern is that if Custer’s Last Stand fizzles out next week, then we are setting up for another big fall.  I don’t mean to be a fear monger, but the Death Cross that we have just experienced with that big 18% drop in all of the Indexes with some even hitting a Bear Market of over 20% before rebounding looks ominous as shown on the next two charts.  I am delighted that many of you know where to go to keep an eye out for early clues, and there is nothing better than the “Rainbow Chart”.  You need to try both a Daily and a Weekly Chart as I show you and the Clues are spelled out on the chart.

If you are new to this concept you can immediately see that the Moving Averages for the the 200-dma envelope on a Daily Chart and for the 50-dma envelope on a Weekly Chart must tighten into a Rope, i.e., come together.  That is the clue for momentum in the direction of either up or down, and in this case the direction is down.  If you look at the extreme Right hand Side we already have the 17-dma cluster and the 50-dma cluster fanning out due to that sudden drop.  It is imperative that the Bulls drive hard to turn this situation around or the  “Market in Confirmed Uptrend” turns to dust one more time in less than two weeks:

We can immediately see the Versatility and Power of the HGSI Software Product in making all of this a snap…try it, you’ll like it or else take two alka-selsa!

It seems we need two alka-selsa anyway given the calendar of events for this month.  We are in for another dose of the same old twaddle, but we shall see:

Enjoy the long Weekend and keep your chin up is the Sincere Wish of your friend, Ian.


Late Breaking News: Valid Bounce Play!

Tuesday, August 30th, 2011

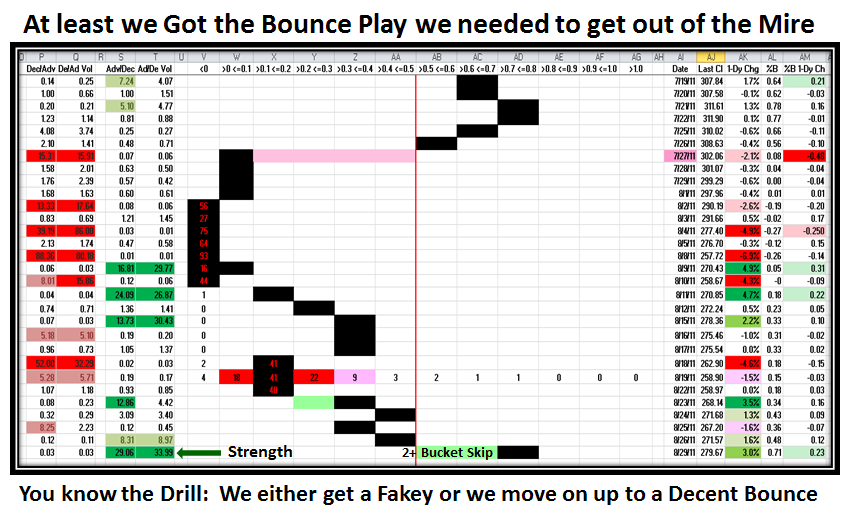
Wonder of all wonders, we finally got a decent Bounce Play, a little short of a Kahuna Up, but we will take a 2-Bucket Skip any day when the previous few days had us still stuck in the mud.  The Tide is in and the Boats are rising fast and did what I set as targets for the Market to do.

We got what we asked for right on the nose, and the lesson learned is that it is important to have “What If” Plans for both Up and Downside Scenarios to guide you:

Although we all know that the Volume was under par yesterday, it has to be excused given the unusual circumstances of the Hurricane Irene debacle.  However, we had the 2+ Bucket Skip, two Eurekas in a row, and humongous Adv/Dec and Adv/Dec Vol as shown on the next chart.  Note also that %B is now at 0.71…the Safe Zone:

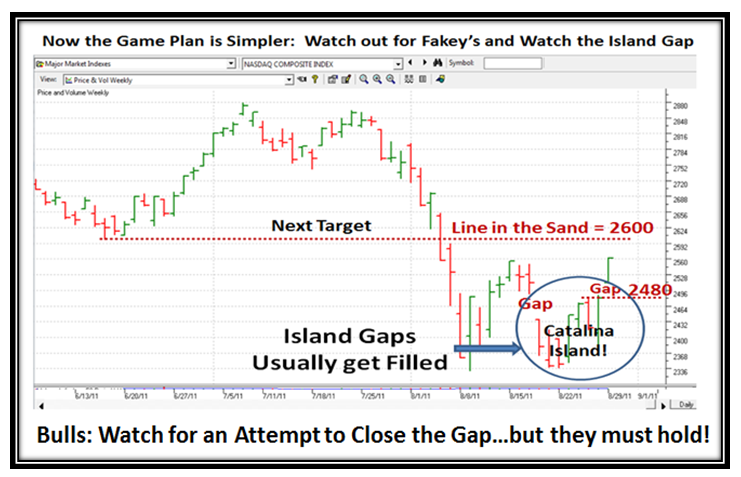
So, the Game Plan gets easier…I didn’t say “Easy”, but at least we have proper Stakes in the Ground and Measuring Rods.  On the Upside the next resistance is the old faithful Line in the Sand at 2600.  How many times have we been up and down that yardstick?…too many for most.  On the Down Side, I spy with my beady eye an Island Gap, like the one between L.A. and Catalina Island.  Beware of Island Gaps…they usually get filled and the Bulls must hold at 2480 or the Party is over.  If it holds then the next move up should be a continuation of the Market in Uptrend and hopefully we avoid the ever present “Fakey” which we now know only too well.  Just look back on past blogs for that predicament that plagued us a year ago until after four months we started a Fresh Rally on 9/1/2010…we are but a couple of days from that anniversary, so we then turn from Despondency and Throw in the Towel to Hope and Relief:

The Bottom Line I hope you will agree is that this good stuff is working for us and keeping you on the right side of this Yo-Yo Market.

Best Regards, Ian


Decisions, Decisions: Doom & Gloom or Up, Up and Away!

Sunday, August 28th, 2011

As I start this Blog Note New York City has been spared the Wrath of Hurricane Irene, and I assume the Stock Market will be open tomorrow morning, despite flooding in Lower Manhattan.  The news from Jackson Hole was underwhelming, but it seems that no startling news was good news, and reading between the lines the market felt assured, for one day on Friday, that Helicopter Ben still had a few tricks up his sleeve.  He implies that he is not out of ammo with “The Federal Reserve has a range of tools that could be used to provide additional monetary stimulus”.  In addition, the FOMC is now meeting for two days instead of one to discuss how best to use them.
I trust they are not as befuddled as our friendly Financial Gurus who can’t seem to make up their minds if we are in a Market in a Confirmed Uptrend or Under Pressure with their yo-yo statements within four days last week.  As my good friends Jerry Samet and both Mike Scott’s will tell us it is essential to watch Eurekas, Kahunas, and %A-%E Accumulation/Distribution along with the Coppock and McClellan Oscillator to assure oneself that we are on the right side of the Market.  You know the drill, and we are by no means out of “Jackson Hole” on the Market as I will give you fodder, targets and reasoning to make up your own minds as to what to look for.  Be prepared to play Yo-Yo or sit tight.  You be your own Guru…it’s your Money!

The Message in one sentence is “This Market is so oversold that all boats are still stuck in the mud and we will need a Substantial Move with a 3-Bucket Skip Upwards to at least show that the Bulls are back in earnest”.

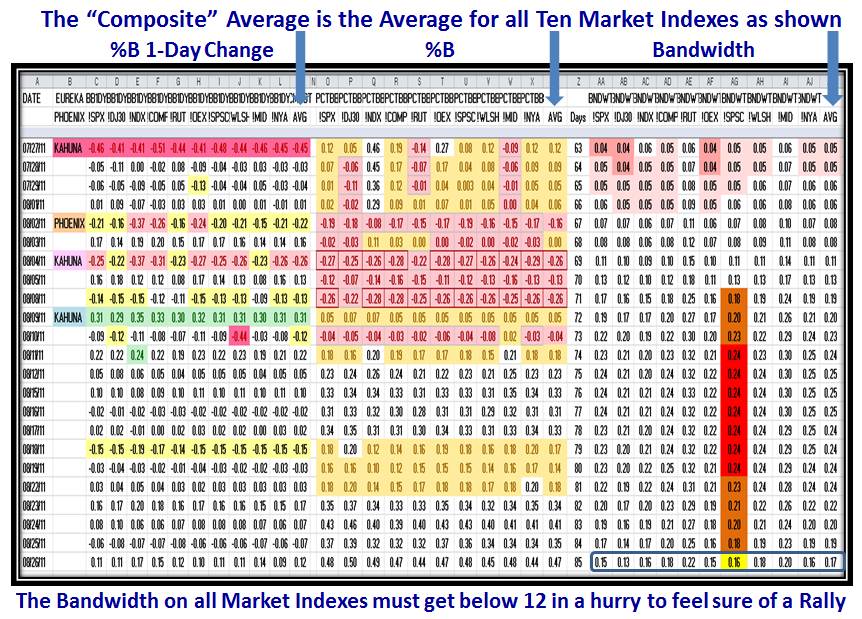
Let’s start with our favorite chart which now focuses on Bandwidth.  Don’t get excited if you can’t read the numbers, I lead you by the hand with the colors and words at the top and bottom of the chart.  The first thing to note is the definition of “Composite”, which I will be using in the two charts below this one.  As you can see by the arrows, Composite applies to the Average of all ten Market Indexes shown and although the numbers are very even regardless of which Index you choose to follow, the beauty of this approach is “Consistency”.  More importantly, the Highs and Lows of past Major Moves give us a Stake in the Ground and Measuring Rods that set the Reasonable Targets for good and bad.

I will re-emphasize that based on past history and particularly for the Black Swan of 2008, the Bandwidth MUST get below 12 for us to consider that the worst is over FOR NOW.  It doesn’t mean that we can’t get back into hot water, but what we need to identify is what transpires in the next few weeks, not months from now.

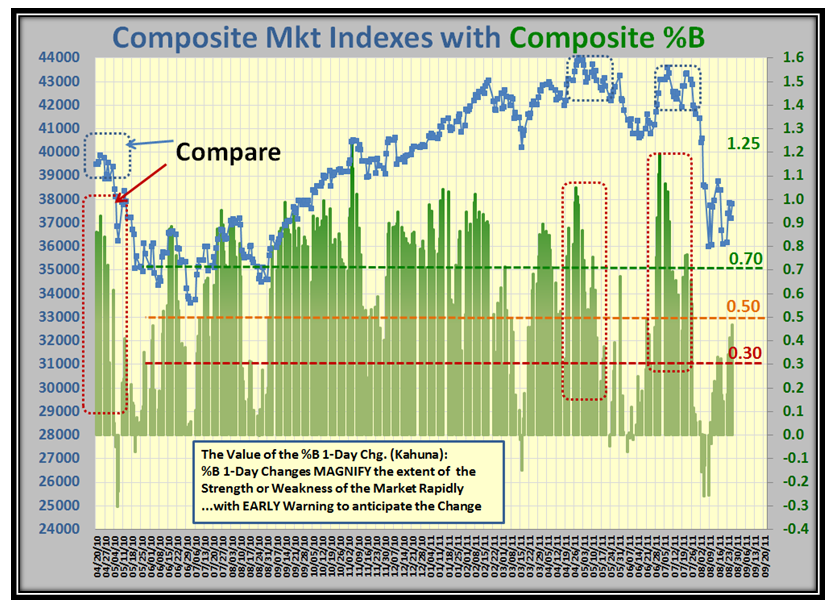
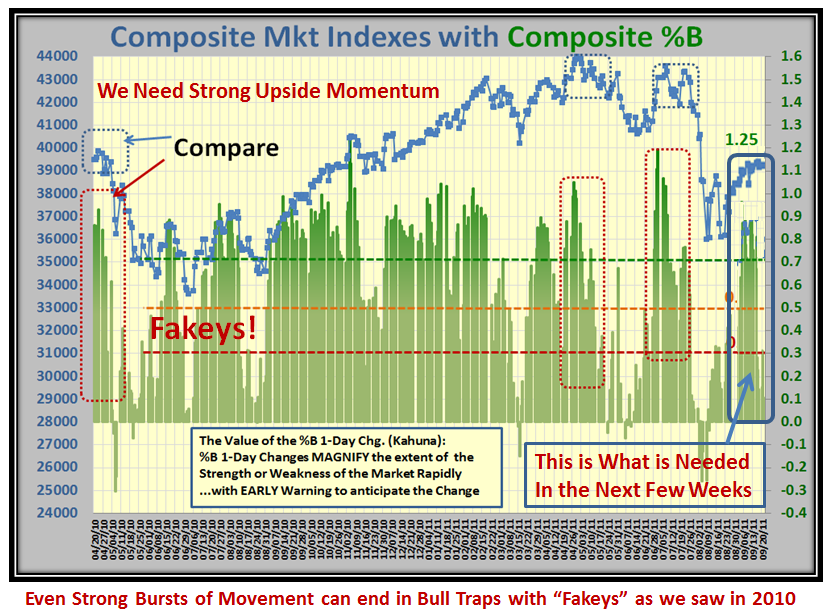
The next two charts are for the Composite of the Ten Market Indexes for %B.  The first shows the dramatic effect of the swoon we experienced that took us rattling down close to Bear Market territory of -20% from the high.  It shows where we are now and the second chart shows what must happen for us to be re-assured that the worst has temporarily passed, and we have a cushion of some sorts for the next buffeting should it occur:

Note that the Composite Reading for %B is still below 0.5 and the beating we have taken compared to the Flash Crash period on the left hand side of the chart.  Then observe the struggle it took for four months to recover to a new Market Rally starting in September, 2010.  In this next chart I show what MUST happen the next few weeks before one can be assured we have at least a Rally, and even then we are at the mercy of fakeys:

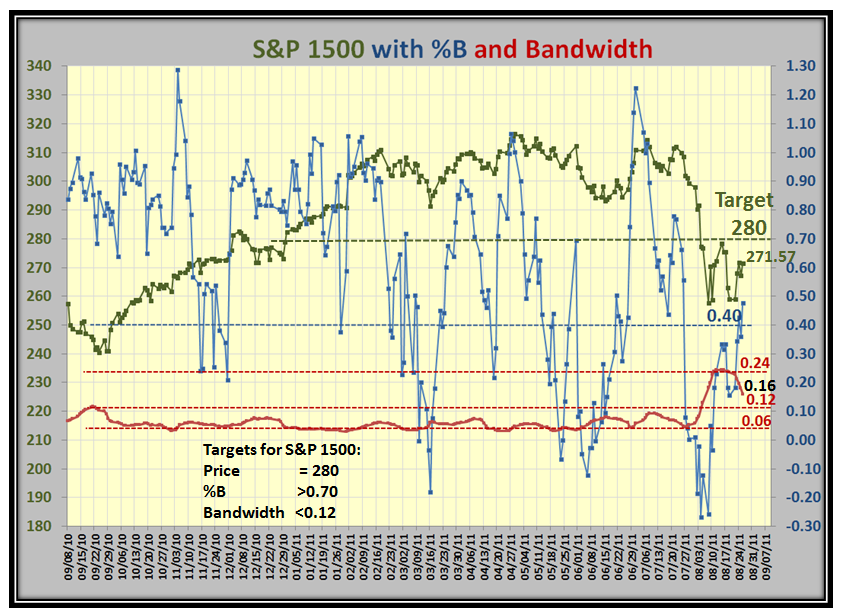
In this next chart, I am back to the S&P 1500 with %B and Bandwidth shown.  It doesn’t take two seconds to see that the KEY TARGET is to get the Bandwidth down to being CALM with readings below 0.12.  We are currently at 0.16, so there is hope, but it requires the push I showed above:

The “Score” has improved from -9 to -2 but again we need to see the bias turn upwards  before the score is positive to at least show Stalemate:

Now the question you are asking I am sure is “How can I track this good stuff, EASILY?”  The next three charts show you how in HGSI.  Now please don’t all shout out at once that you don’t have the Bandwidth slices I show.  You either put them in yourself or you wait patiently for the next upgrade when it will be in the Slices Folder of the Spectrum Analysis Pie Chart.  Here are the targets for the High Road Scenario:

…And here is the picture for %B which is in your Slices Folder, so you can easily track this inside five minutes on HGSI:

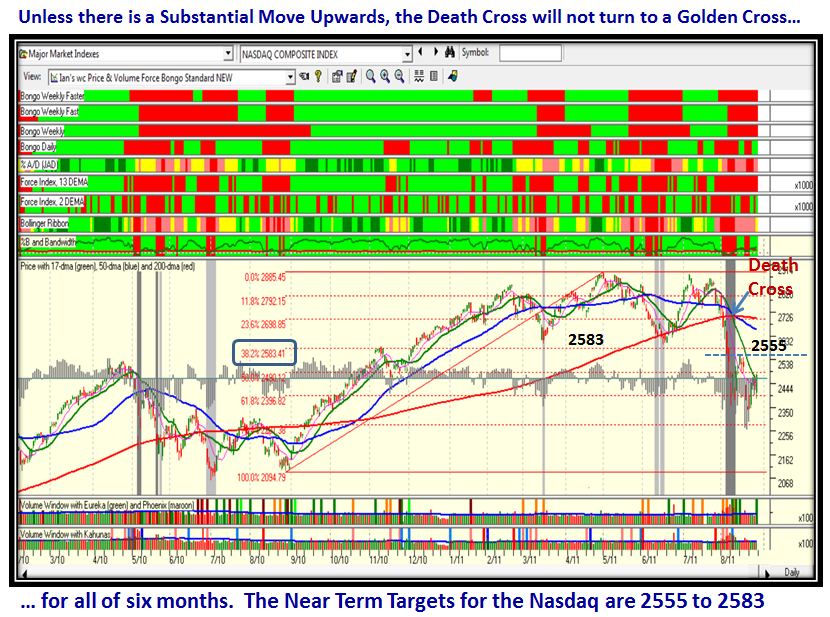
Now let’s look at the Nasdaq with its Price Targets for the immediate future.  Please note the Death Cross predicament shown on the chart:

…And Finally, we have one picture for the Low Road Scenario, besides all the other warnings I have given you above:

My Thanks to those of you who chose to drop me a line of appreciation for my work which is a labor of love.  Please drop me a line and let me know if you are coming to the Seminar from October 22 to 24 which is now only seven weeks away.  It is on, but we need to hear from you NOW.  There will be plenty of new “Good Stuff” that Ron and I will cover, to say nothing about all the goodies in the Substantial Upgrade to come in a few weeks time.

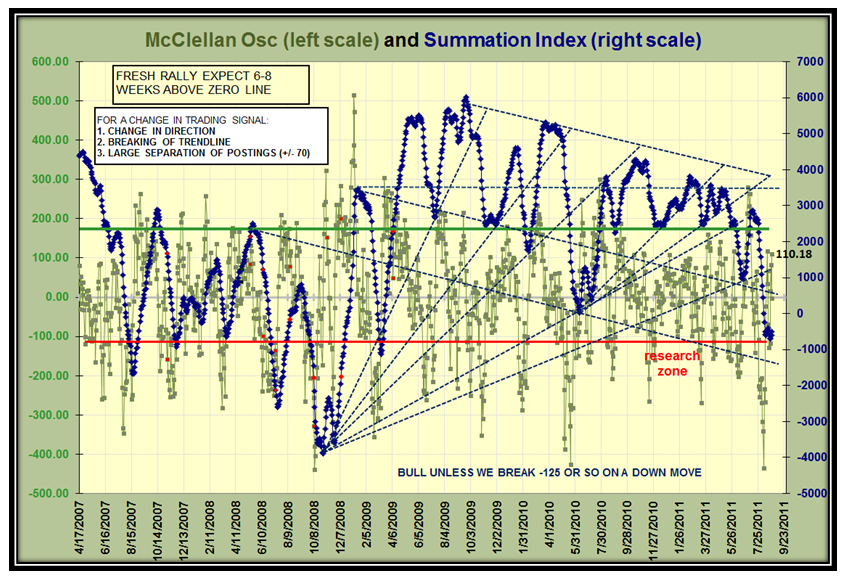
Late Breaking News:  Paul asks:   What are your suggestions to look for with the McClellan Oscillator?

Your wish is my command.  The Oscillator is at 110.18 so that is good…it needs to move up to above 200 for the rally to continue.  The Summation Index has bottomed for now, but needs to start moving up with wide separation of postings and break up through the down-trend-line with gusto.  We would like to see it get above 1200, but that is wishful thinking for now:

Best Regards, Ian.

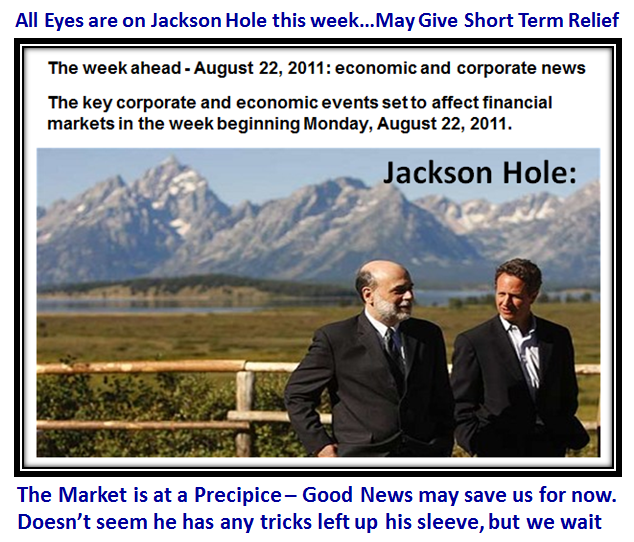
Stock Market: Relief from the Fed at Jackson Hole?

Sunday, August 21st, 2011

Don’t count on it, but it seems all eyes are turned to the Fed Meeting in Jackson Hole this week, so we shall see if Uncle Ben has any last tricks up his sleeve.  The hot news as I write is the fall of Libya to the Rebels and we hope and pray that the unrest settles in that area.

I couldn’t resist a second picture to be careful if the Market suddenly turns euphoric and drives up in an unprecedented manner…we are not out of the “Hole”!

I bring back a key slide from yesterday’s blog note, so that you can maintain continuity with what I have researched with regard to new ground on the subject of John Bollinger’s Bandwidth.

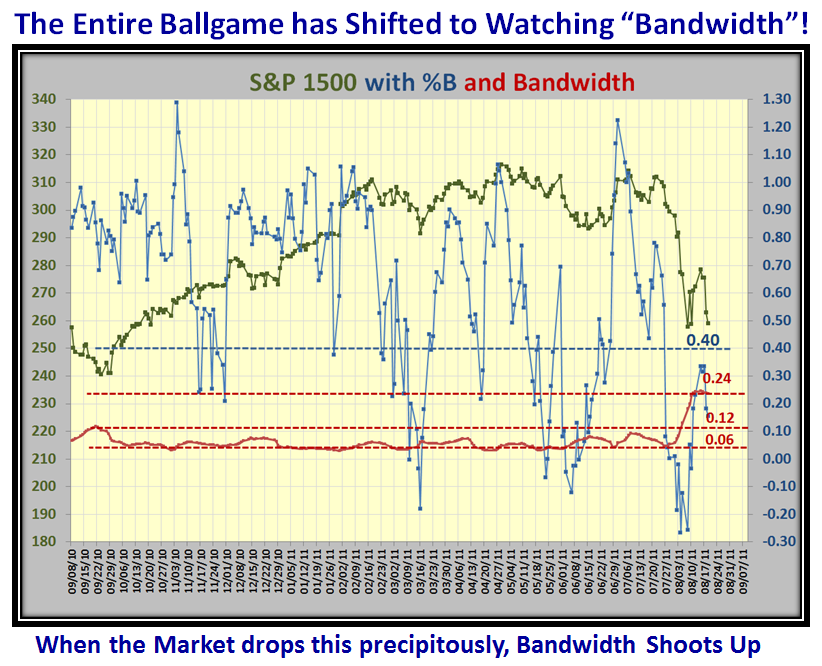
I must admit that Bandwidth is not my primary focus, but in view of the recent precipitous drop in the Indexes, I felt it important to understand what recent changes I can glean in this Indicator as I compare the current recent alarming rise in Bandwidth with the Black Swan drop in 2008.

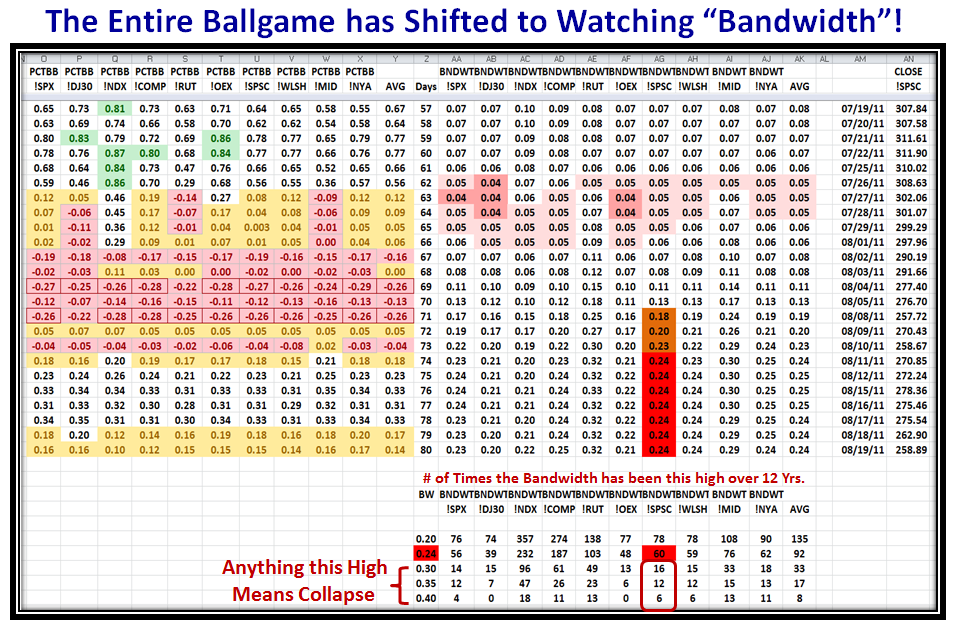
Here is a Chart I have not shown before, but is what got me excited to keep an eye on this to see if the Bandwidth shown on the Right Hand Side either rises sharply from here or trots back to its normal calm state below 0.10 as shown below.  Anything higher than 0.24 suggests from past history that we are in for a precipitous fall, as I will evolve for you with charts to back it up based on the Black Swan Stake in the Ground and Measuring Rod we learned back then:

This next chart is what caught my eye to evaluate Bandwidth at this critical juncture.  When the Market drops precipitously, Bandwidth shoots up:

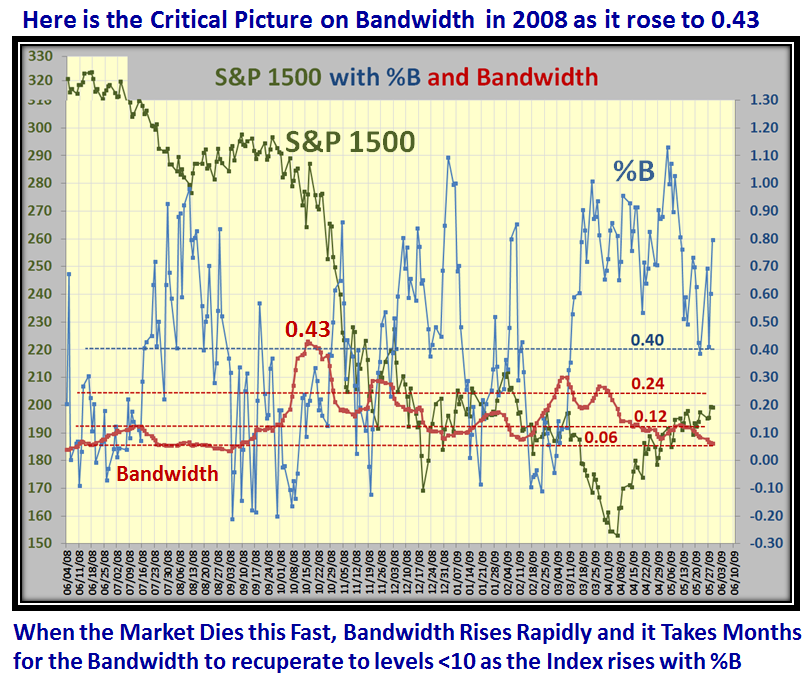
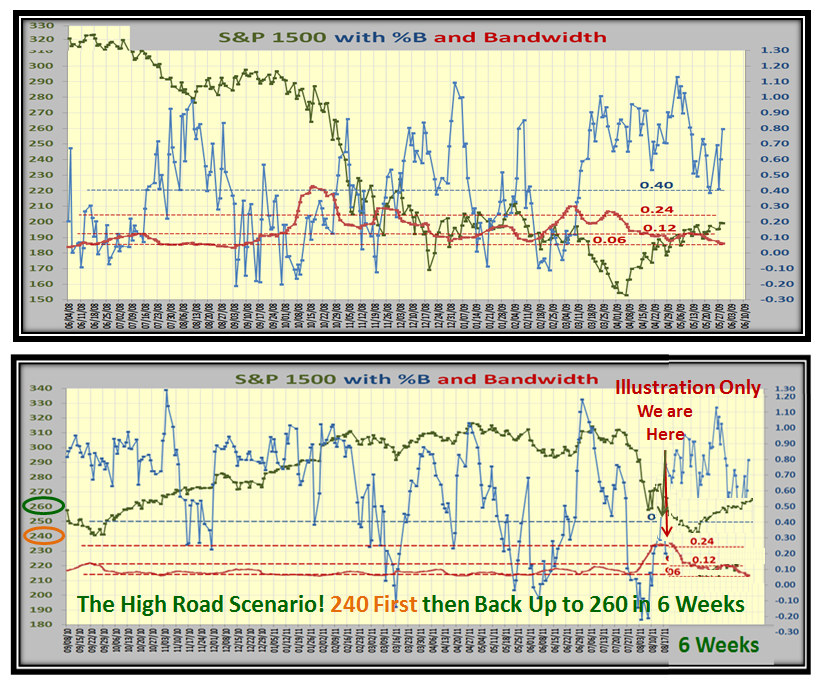
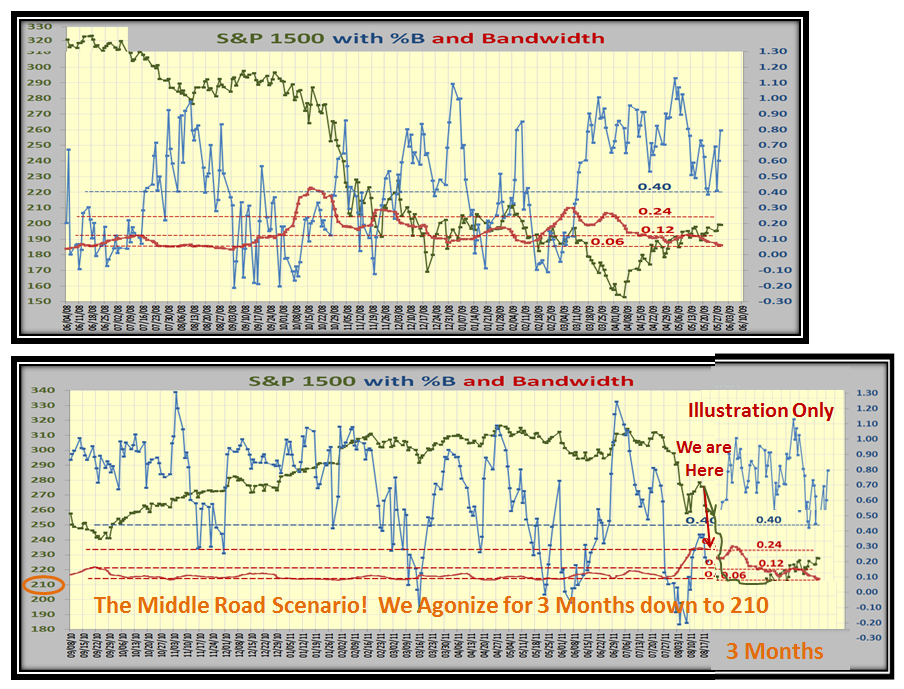
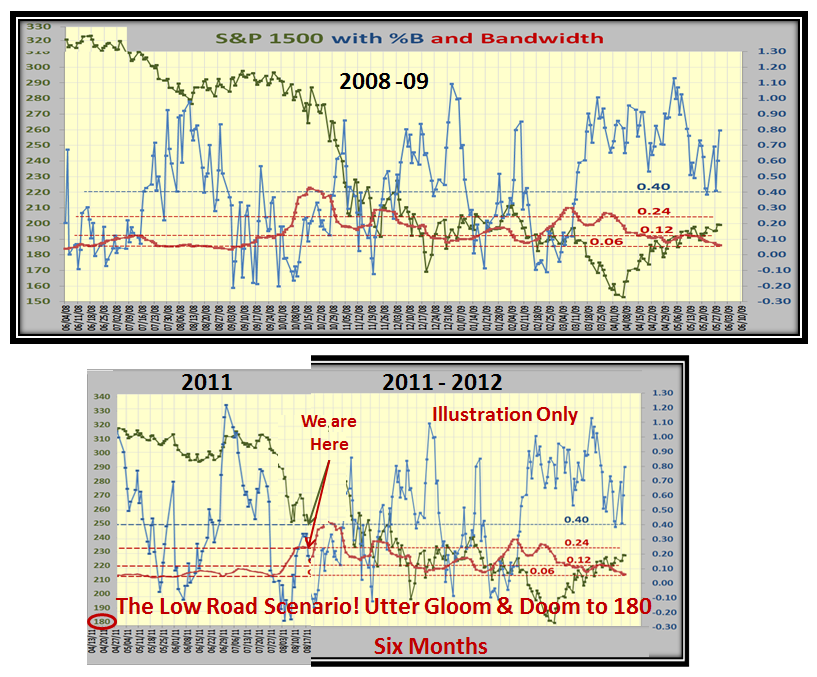
Now for our Stake in the Ground, let’s look at the 2008 timeframe when the Bandwidth on the S&P 1500 shot up to 0.43 and then note how long it took to subside.  Markets do not come back quickly when they are badly trashed and my objective is to carve up this chart to show us possible High, Middle and Low Road Scenarios:

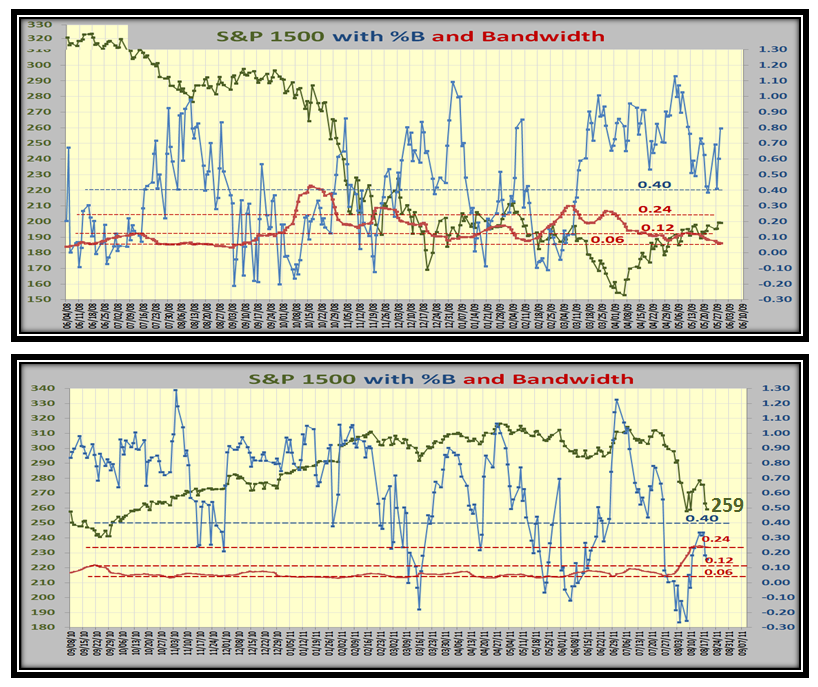
Before assessing the alternative scenarios, the following chart shows the comparison of 2008-09 with 2011-12 for a period of a year.  You can immediately see that the rise from the Last Rally starting in September, 2010 until recently recorded Bandwidth numbers that were less than 0.10.  However, over on the right you immediately see how this has popped up to the 0.24 level I showed you a few slides above, as we had that five Bucket drop in %B on 7/27/11:

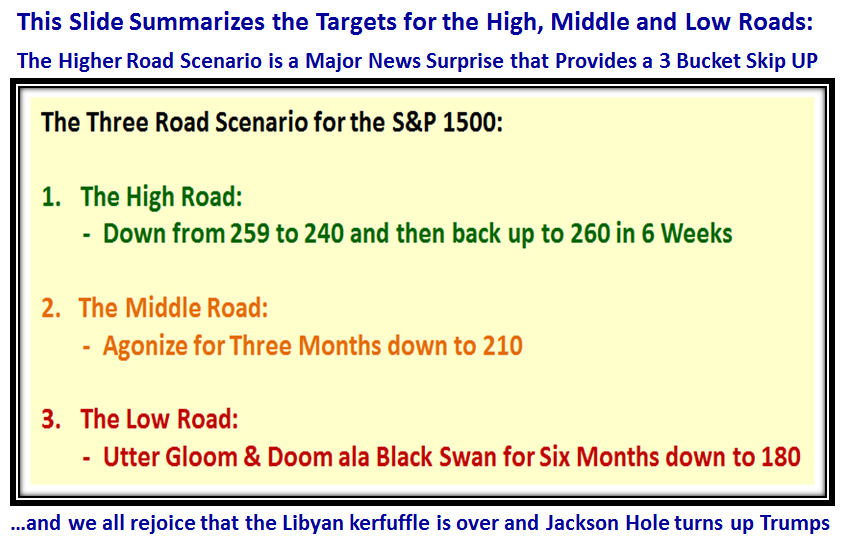
The following chart says in words what follows in pictures summarizing the three Road Scenarios.  Note there is a Higher Road Scenario not shown, but it is not difficult to visualize what must happen if there is superlative news to the upside which causes the Market Indexes to Bounce at least three Buckets up.  We will embrace that news and breathe a sigh of relief when we see it:

As promised, I have done my usual trick of slicing and attaching the picture from the past and sticking it on the end…Here is the High Road Scenario:

…And here is the Middle Road Scenario:

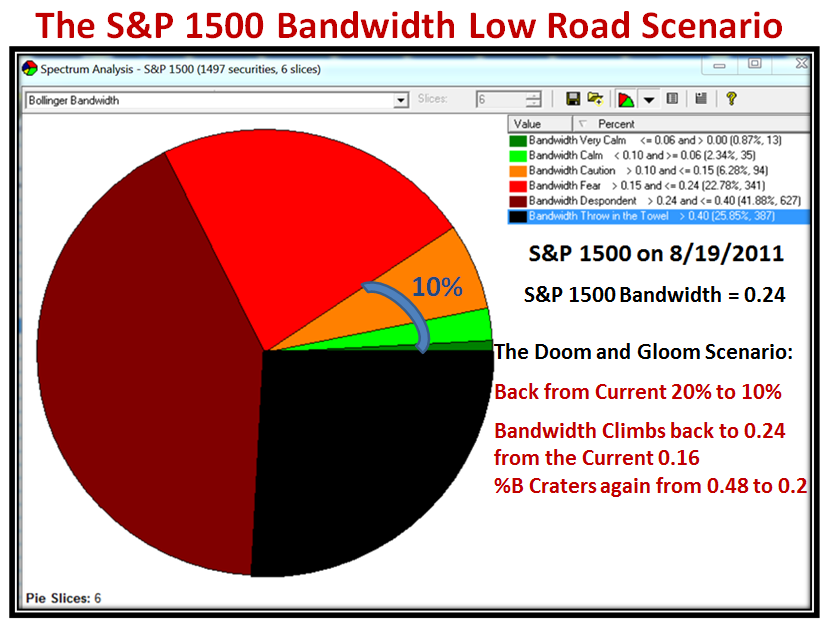
…And Finally, to round things off, here is the Low Road Scenario…Heaven help us if we trot down to these levels:

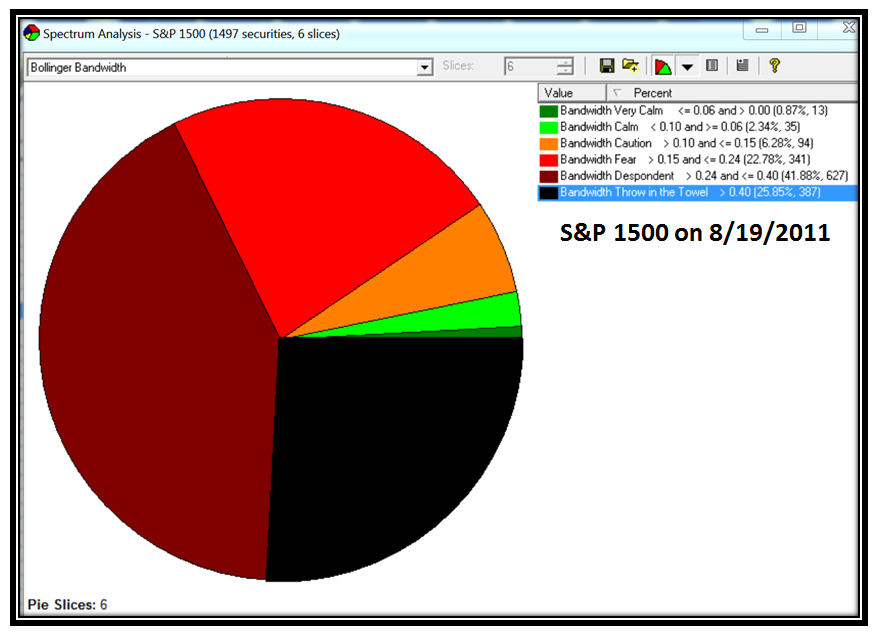
Here is an Update with a bonus for HGSI Users.  I put this together after I posted this note.  Unless you are a whiz at making your own Pie Charts you won’t find it in the current software.  Ron and I will work on an update:

Give me some feedback as to whether this appeals to you, makes sense and moves the ball forward or not.  All you have to watch next week is whether the Bandwidth rises or drops sharply from 0.24 as you view it in the HGSI Software for Major Market Indexes.

Best Regards, Ian.


Copyright © 2007-2010 Ian Woodward
Disclaimer: Commentaries on this Blog are not to be construed as recommendations to buy or sell the market and/or specific securites. The consumer of the information is responsible for their own investment decisions.