Ian Woodward's Investing Blog

Archive for the ‘Market Analysis’ Category

Red Alert: Stock Market Pause to Refresh or Correction

Wednesday, February 23rd, 2011

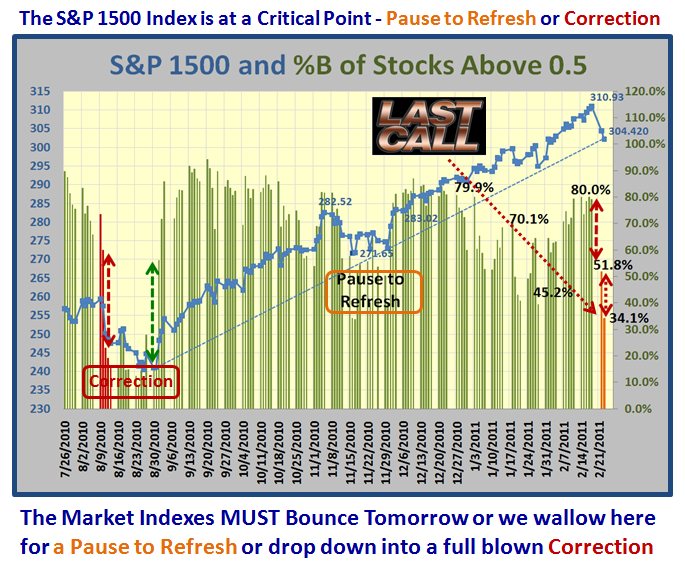
After today’s action in the stock market, the Three Road Scenario in the short term is simple:

  1. High Road:      Bounce Play Tomorrow
  2. Middle Road:   Pause to Refresh
  3. Low Road:       Full Blown Correction

This next chart needs no explanation and is the evidence that we are at the critical point.  In my last blog note I said the critical level is 30:70 and we are currently at 34:66…close enough for Gov’t Work:

Ron and I look forward to seeing you at the Webinar tomorrow evening.

All the Best, Ian.

The Real Test for QE2 vs Oil Spike Fears

Tuesday, February 22nd, 2011

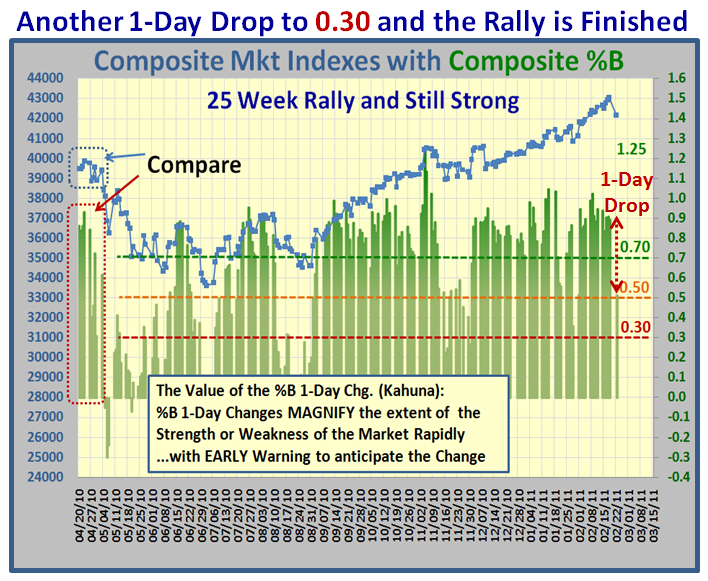
At long last the Bears are licking their chops and wondering if it is their turn  after 26 weeks of patience.  The Bull and Bear action of the next few days and the outcome in Libya will tell the story:

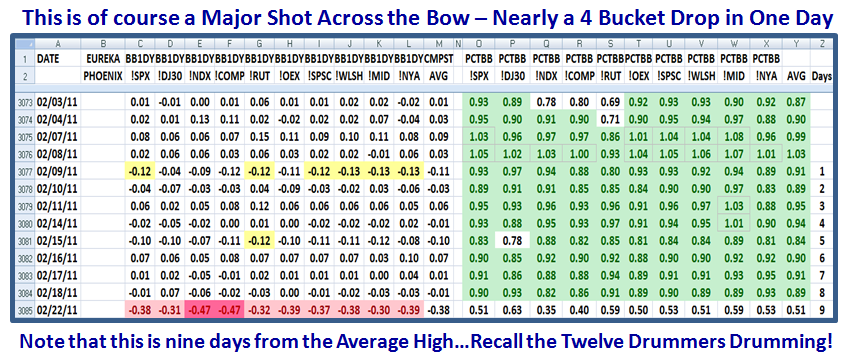
It goes without saying we had a Major Shot across the Bow today, with nearly a 4 bucket drop:

The drop is severe enough that there may be a reaction bounce, and it is the extent of that bounce together with whether the Bulls can hold the line which will determine if this was again a one day wonder or at long last the time to pause to refresh if not have a decent correction.  The oil spike needs to be watched tomorrow, though the Futures Market shows a small positive bounce as I write for the DJIA, the Nasdaq and S&P 500.

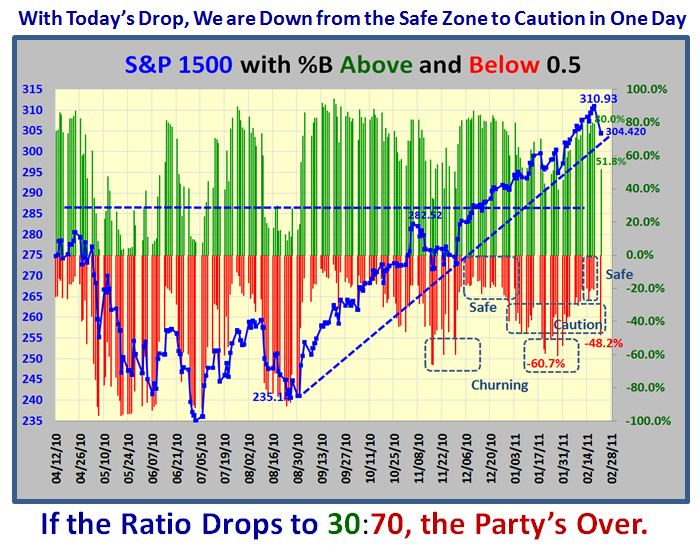
On Friday we were back up in the “Safe Zone” with %B above 0.5 for the S&P 1500 up at 0.80, a very healthy reading.   Today it is sitting at 51.8 which implies that we are at the “Caution” Flag.  If it drops to 30, the Party is over for now as shown by the following chart which you have enjoyed from the past:

I hope to see many of you at the Webinar that Ron and I are doing on the third session on Impulse Indicators on Thursday.

Best Regards, Ian.

QE2 is Afloat & Buoying Up This Stock Market

Sunday, February 13th, 2011

My good friend and partner, Ron Brown, is under the weather so you will miss his Weekly Review Movie.  I am giving you a quick blog note which adds little that you did not know already…The QE2 is Still Afloat and Buoying up this Market:


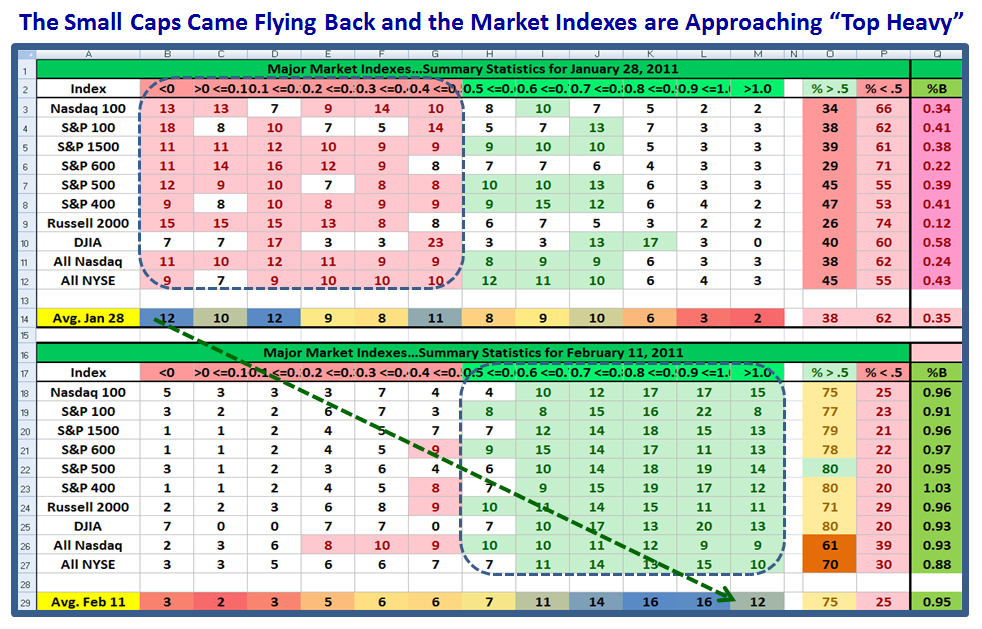
Just look at the difference two weeks make from the end of January to now and you will see that we went from the brink of a correction to full speed ahead and darn the torpedoes. They came rattling back into the Small Caps, but now all Markets are once again in Overbought territory.  This Bucket Sloshing keeps us abreast of which way the wind is blowing and to what degree.  So enjoy the fruits of my labors which will stiffen up your backbones to realize this is an unusual market in unusual times. 

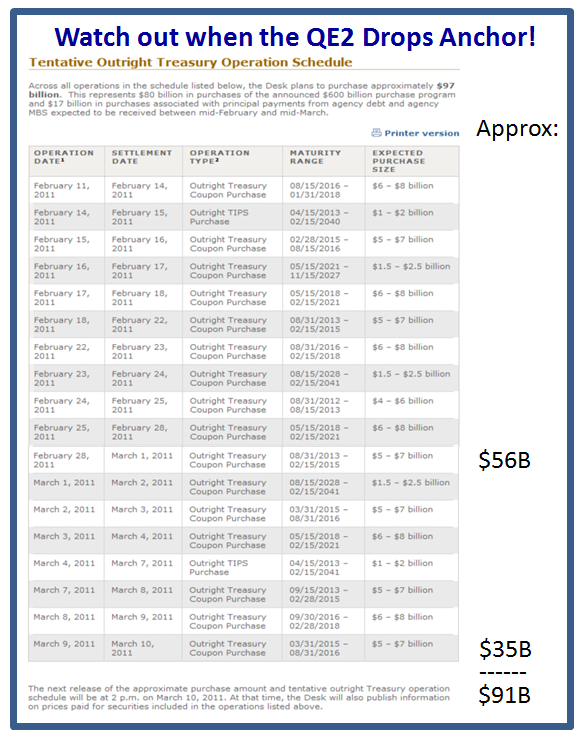
We are now over 700 days since the start of the Rally back in March 2009, and this is the 12th time since 1935 that such a feat has been achieved in the S&P 500.  The stimulus for this event this time is undoubtedly the QE2 mumbo jumbo; enjoy it while it lasts, but watch out when this Ship drops anchor as we should expect the tidal wave to flip the other way:


We are just six weeks away from our next HGS Investors Seminar and if you intend to come, please drop me a line at Ian@Highgrowthstock.com and let me know…it helps us with the logistics at this end.  Enjoy your weekend.

Best Regards, Ian.

Stock Market: Don’t Count Your Chickens Before Hatched

Wednesday, February 9th, 2011

I’ve been fooled before and I’ll be fooled again, but this Market is a wonder to behold.  Inching up day-by-day on light volume and all we can point to is Uncle Ben and his wonder elixir called POMO or QE2!  That is the beauty of always having three scenarios and letting the market tell you which one it is on.  So, one more time the lesson learned is “Never Count Your Chickens Before they are Hatched”:

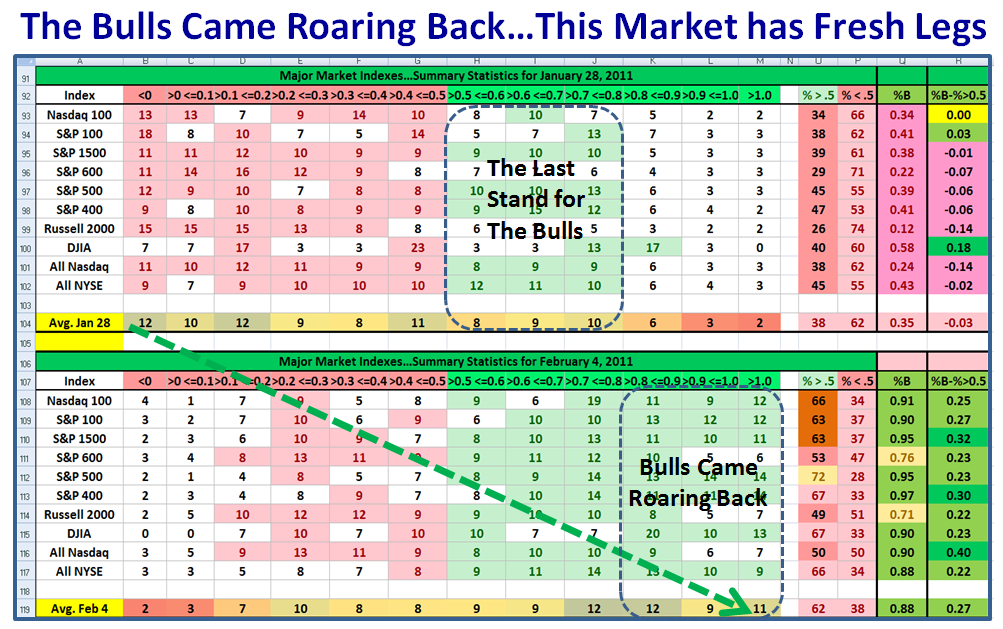
On January 28th, the Market Internals were signaling that we were on the brink of a correction, and here we are barely ten days later and it could hardly look stronger.  The Bears were denied and the Bulls came roaring back:

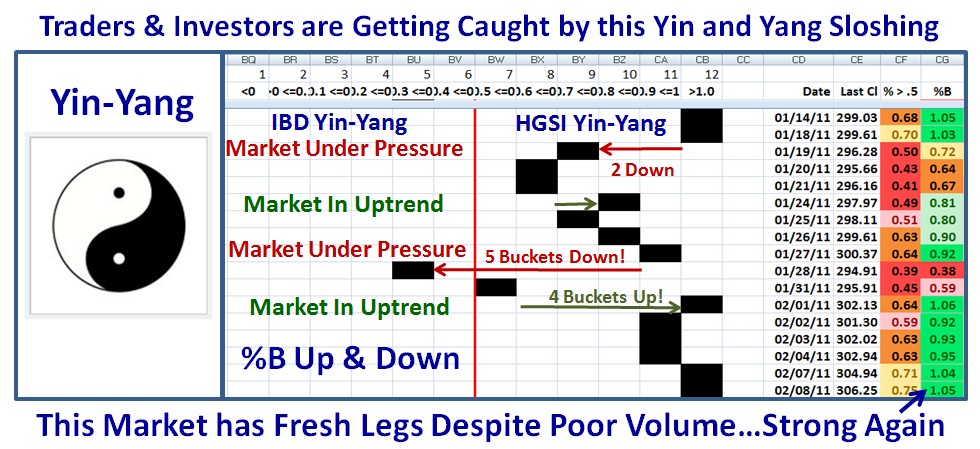
Here is the updated picture of the Yin-Yang with 5 buckets down followed by 4 Buckets up and now an overbought S&P 1500 along with all the other Market Indexes:

Helicopter Ben is still whirling around town with his QE2 and you may as well enjoy the complacency while it lasts:

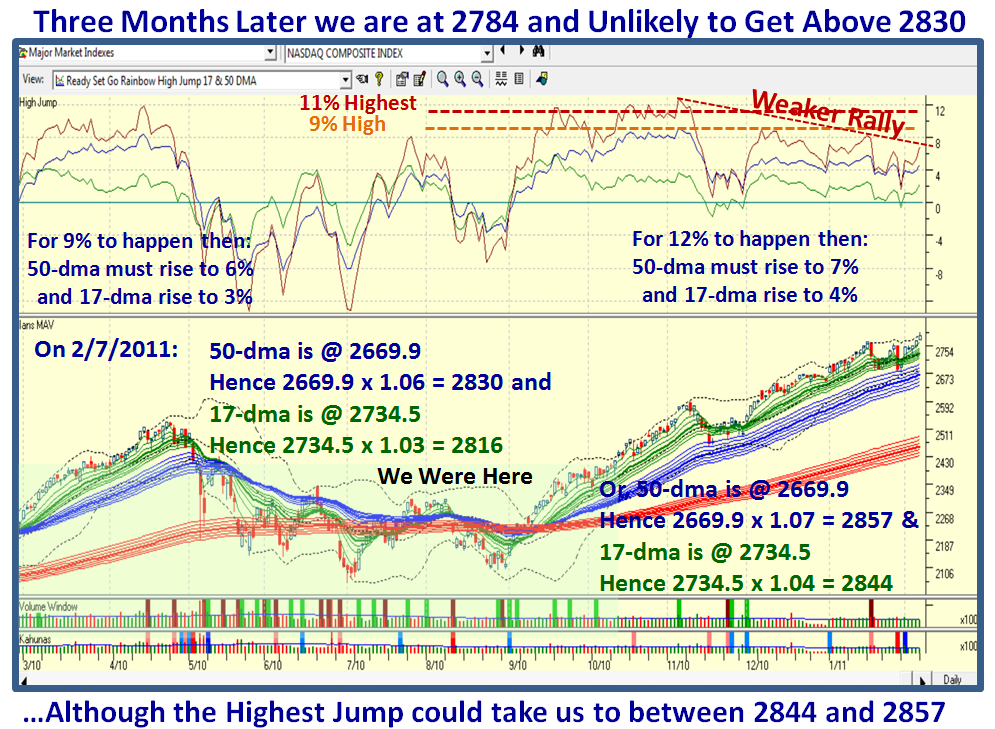
At times like these, curb your euphoria to what are reasonable upside targets.  Once achieved, either set higher targets or watch out below.  There is seldom any better way of gauging what might be a reasonable target than the High Jump tool.  The next chart is a busy one, but if you haven’t learnt it by now, then it is high time you did.  When rallies get long in the tooth, they invariably show a tendency to be struggling on making recent previous High Jump targets.  In this case I am using only the 50-dma and 17-dma as my guide as we are already a trifle extended from the 200-dma to say the least.  Note how much weaker this rally is compared to the burst of enthusiasm from the 9/1/2011 timeframe to that small pause to refresh in November for two weeks just before the Santa Claus Rally.  The bottom line is that if this rally continues to show strength then around 40 points higher is as much as one might expect.  I show the targets for both the High and Highest Scenarios.  Don’t quarrel with me for not showing the Highest at 12% at this stage of events.  Let’s get past 11% first:

That should give you plenty to chew on till the next time. 

Best Regards, Ian.

Stock Market…Don’t Fight the Fed!

Tuesday, February 1st, 2011

Are we headed one more time for a Climax Run.  My good friend Mike Scott reminded me that this is the same “kerfuffle” that occurred at the Peak in October 2007.  Imagine IBD caught in the same dilemma with Market under Pressure, then Market in Uptrend and back to Market under Pressure within a week, and what do you think they will say right now?  The word is out, you guessed it…Market in Uptrend!  I warned of both Bull and Bear Traps, but there is only one golden rule which is to let the Market tell you what it is doing, but I strongly advise us to play with one foot in the exit.

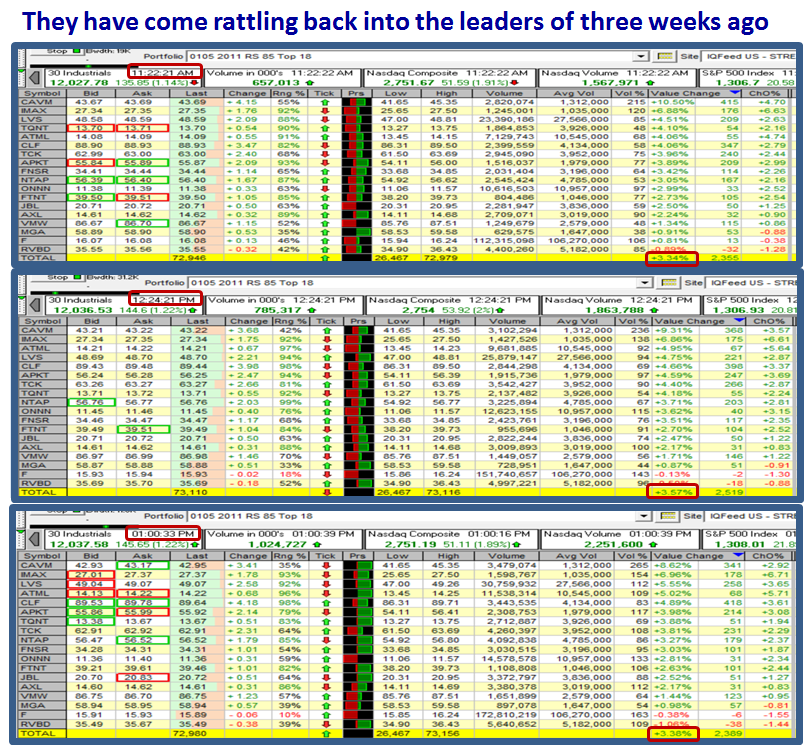
The Bucket Sloshing naturally continued today with a strong move to the right, but with a 64:36 Ratio, though the S&P 1500 %B has jumped back to Overbought Territory with a reading of 1.06!  Net-net we are back to Disparity and the stocks above 0.5 have to be pulled up by the bootstraps as I show in the following slides. 
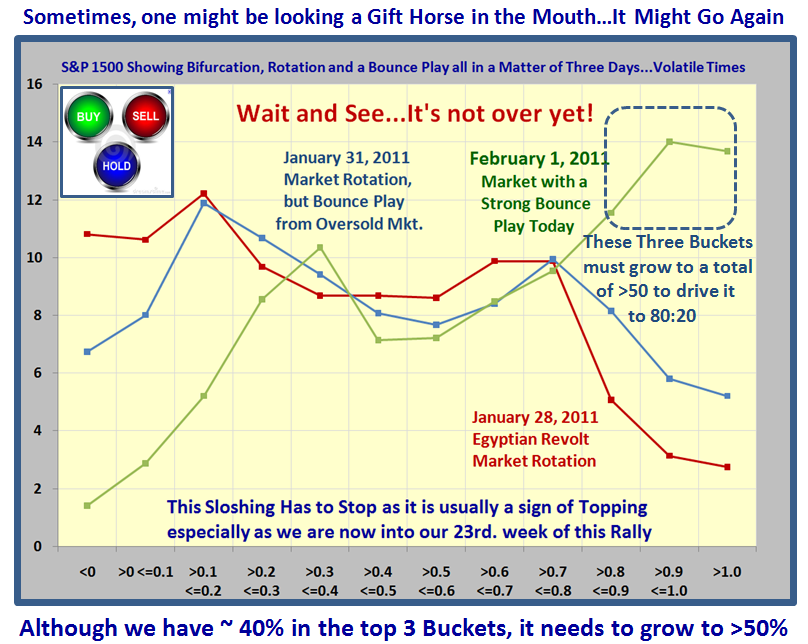
I guess we are all confused by the extent of this Volatility and here is the reason why…the Yin and Yang:
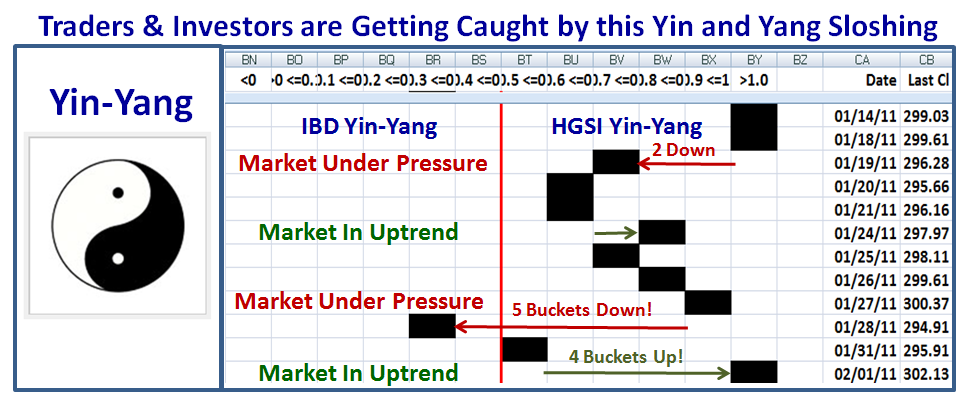
However, I am satisfied that our process is working and we now have a method not only that a Market is Under Pressure or that it is in an Uptrend, but the extent of the damage and the recovery with the sloshing buckets.
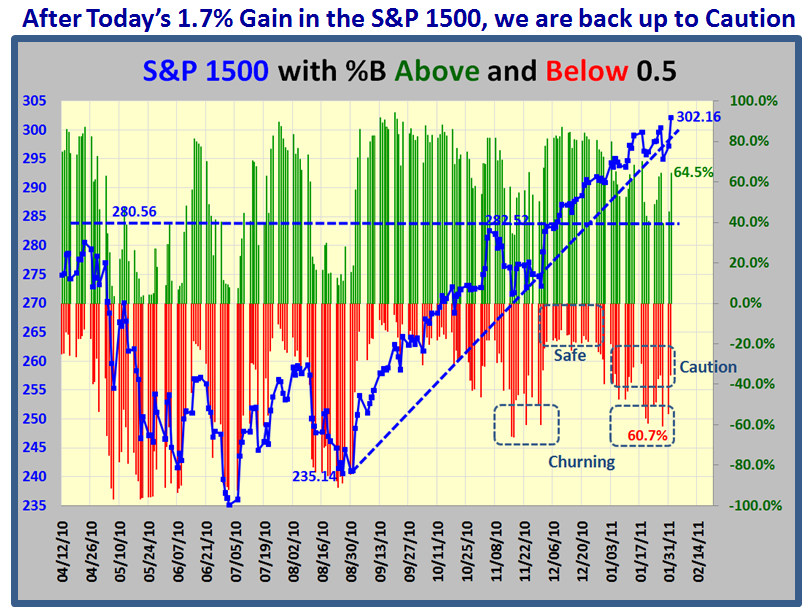
…And now let’s look at Grandma’s Pies and the Buckets which show how Jittery it has been these last four days:
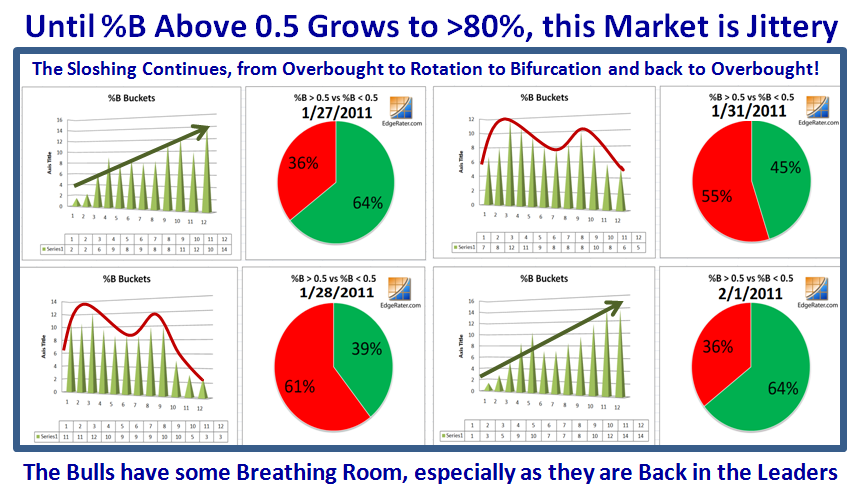
Today was a very good day for the Leaders that were trashed as they came right back into them.  Here is a list of 18 stocks which I captured three weeks ago with an RS 85 rating which I keep tabs on at times like this.  For those of you who have HGSI and QuoteTracker, this is a worthwhile tip to see which way the wind is blowing on key days:
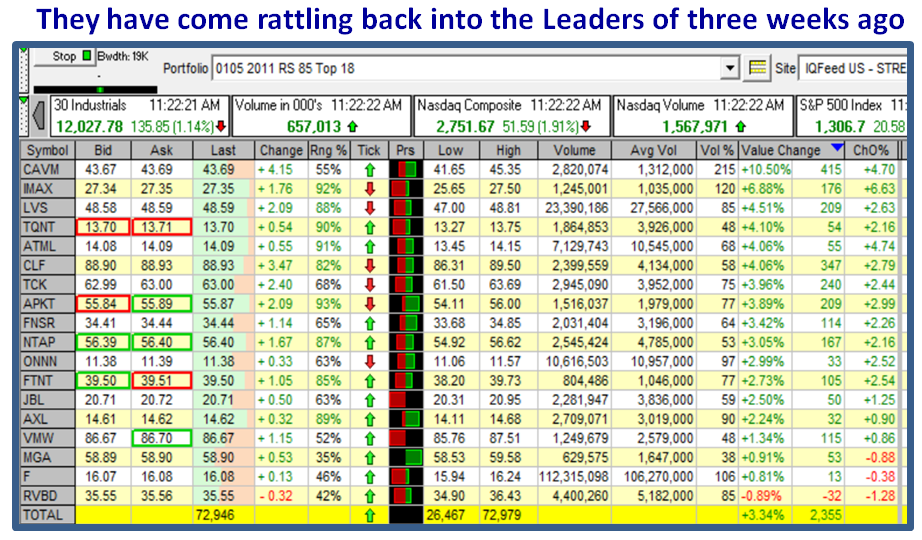
To see which way the wind is blowing on a strong day up, keep an eye on snapshots at 11.30, 12.30, and 1.00pm Pacific Time to see how these Leaders behave, and you will immediately see that they held up well, so this was not a one day wonder for the moment.  I know the numbers are hard to read, but just click on the chart to see a bigger view and you will see that they held up respectably with some stocks having strong volume…of course, the big boys could be selling into the rally!  One more clue, they were buying the top two in after hours and drove the Average up to 3.58% once again:
Last but not least, my good friend Paul got permission from Barr of his website to post this picture which says it all:
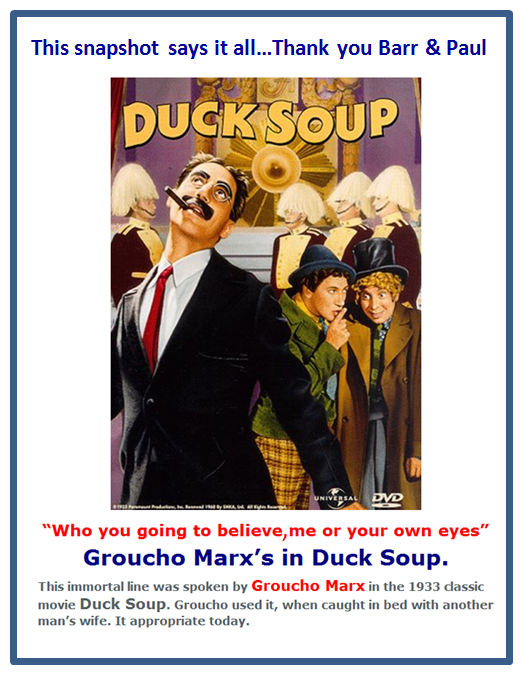
               

Keep your powder dry and good luck in these tricky times.  Best Regards, Ian.

Copyright © 2007-2010 Ian Woodward
Disclaimer: Commentaries on this Blog are not to be construed as recommendations to buy or sell the market and/or specific securites. The consumer of the information is responsible for their own investment decisions.