Ian Woodward's Investing Blog

Archive for the ‘Market Analysis’ Category

The Bears are Riled & Nipping at the Bull’s Heels!

Tuesday, November 16th, 2010

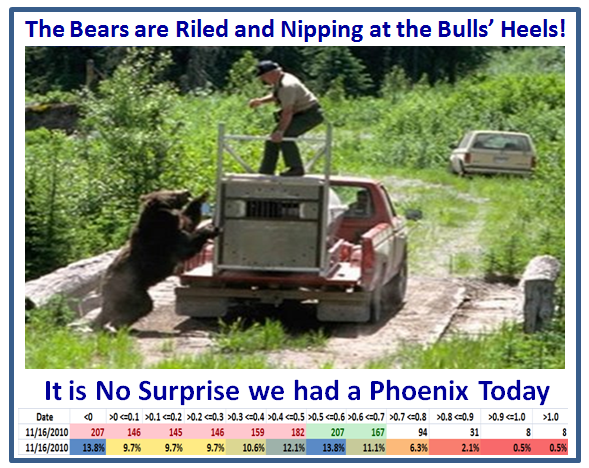
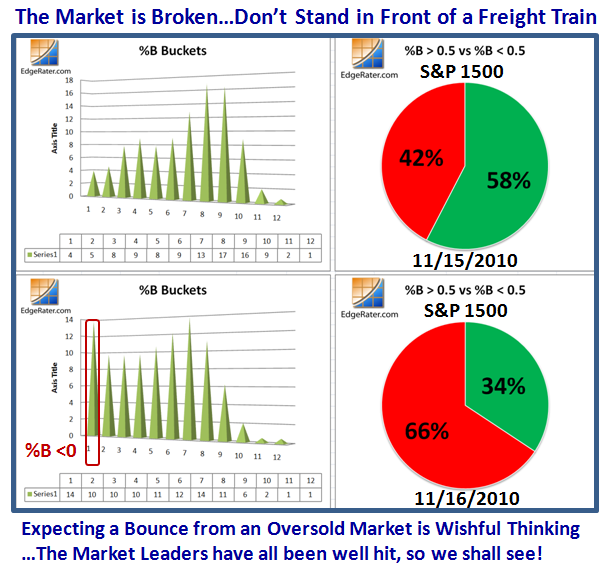
It has been a long time coming, but the Bears lowered the boom today. I’m glad I gave you plenty of warning, and now we shall see how quickly the Bulls can recover.  Those who follow the “Bucket Brigade” will understand the numbers in the Cartoon below, especially the 13.8% of stocks in the S&P 1500 sitting below the Lower Bollinger Band %B <0.  It also goes without saying that we had a Phoenix today, so the Bears have control after a long dry spell:


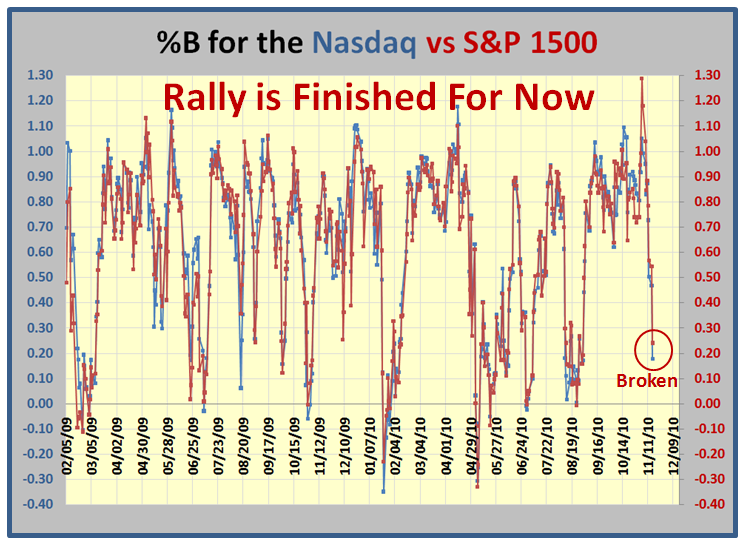
We have had a twelve week Rally, but the Market was broken today:


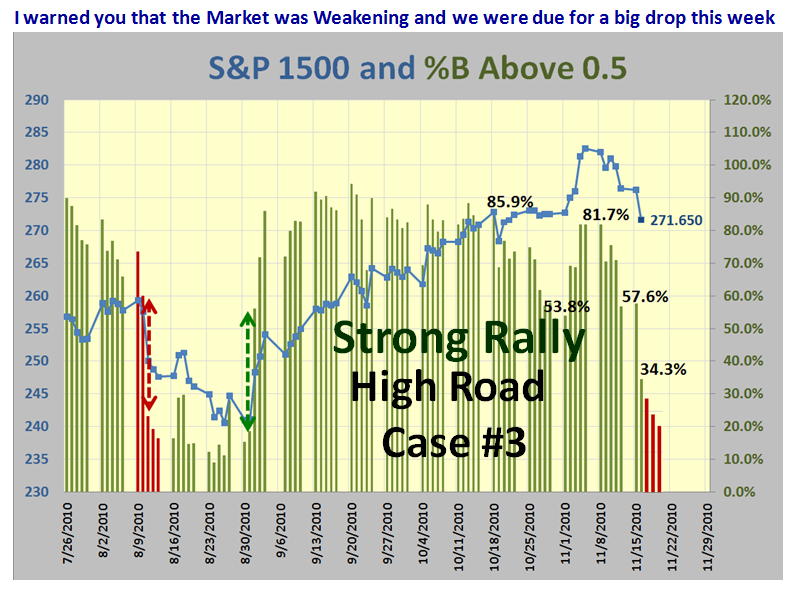
Now the question is how much further does it go down before the Bulls come roaring back:


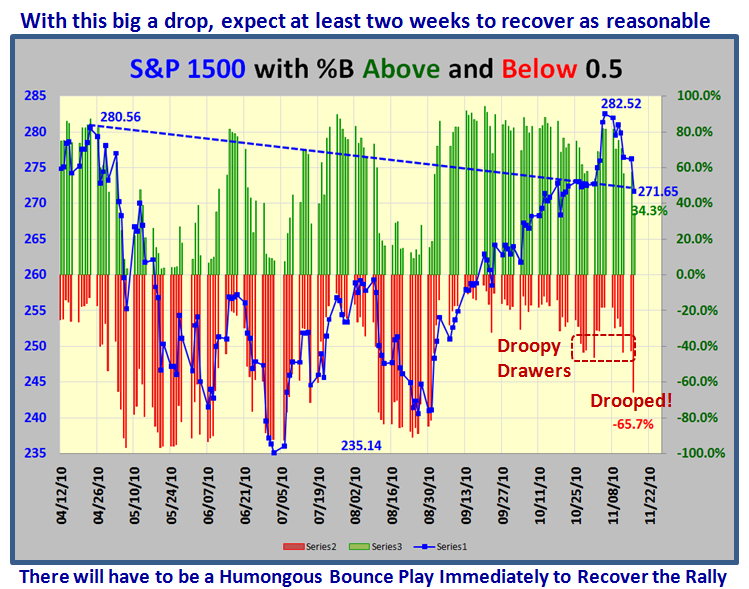
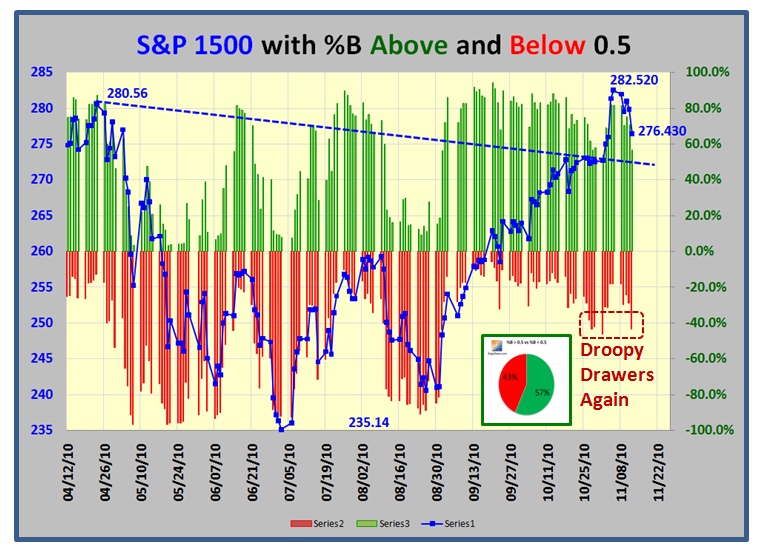
…And here is its twin chart which shows how drooped the %B is below 0.5:


This last one should seal the picture for you as it shows the deterioration in one day!  


   Don’t forget that this is Options Expiration Week, so keep your Powder Dry.

Best Regards, Ian.

Bulls are at High Noon Next Week!

Saturday, November 13th, 2010

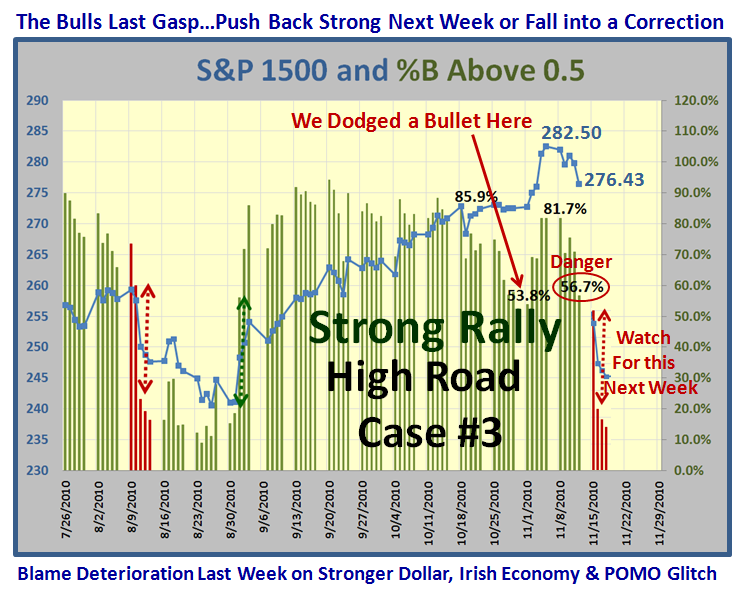
We have eked out an Eleven Week Rally and the Market is looking a trifle tired at this stage.  Last week was a rotten week for the Bulls, giving up all its cushion from the stellar bounce back to Uncharted Waters as I wrote in a previous blog note.  The time has arrived for the Bulls to fight back or collapse into a long awaited correction by the Bears.  Blame this week on a Stronger Dollar, the Irish kerfuffle over its Economic outlook and the hiccup on POMO delivery on Friday:


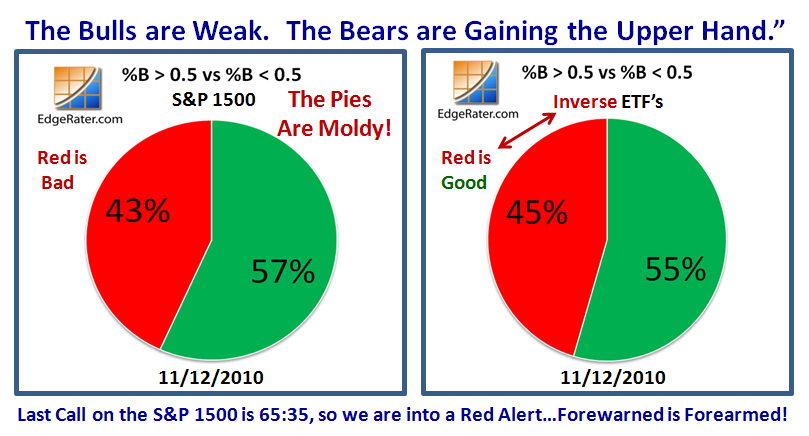
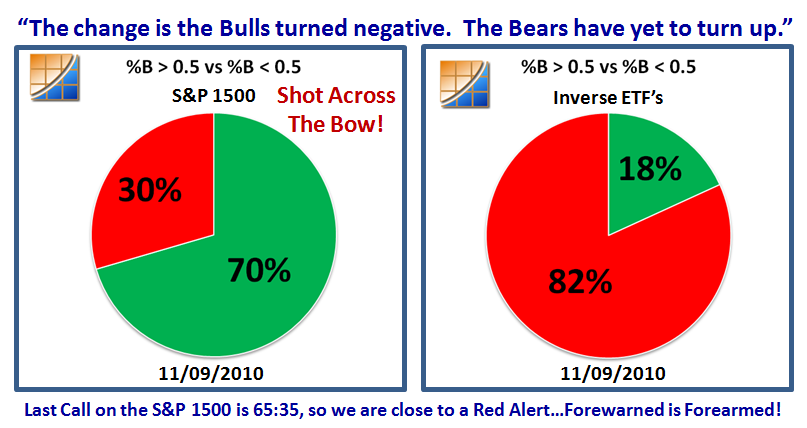
The Bottom Line is that the Bulls are Weak and the Bears are gaining the upper hand, while Grandma’s Pies have got more than a trifle moldy.  65:35 is the last call before we see danger and we are already at 57:43, so next week will be interesting.  The Inverse ETFs Portfolio I featured a few notes back is showing signs that they are stirring, but next week is do or die for them as well:

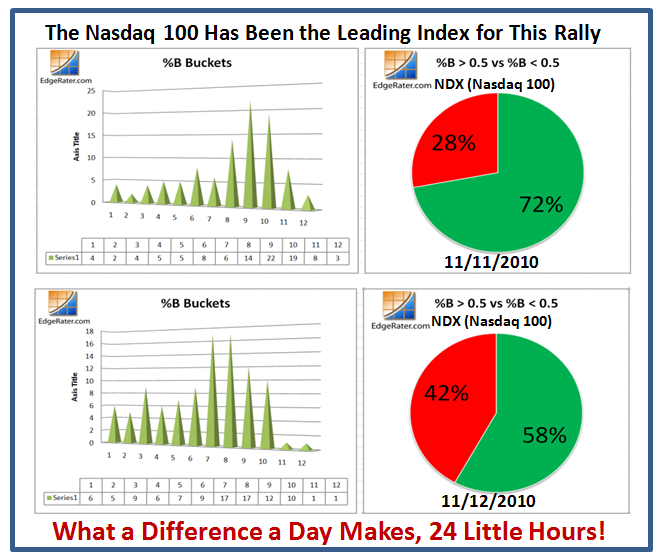
Although all Market Indexes have risen in unison, the true leaders for the rally have come from the Nasdaq 100 (NDX)…the Technology Big Caps.  Here is a snapshot of what has transpired with that Index inside one day, thanks to my good friend Chris White and his EdgeRater tool, which gives the picture in a wink!

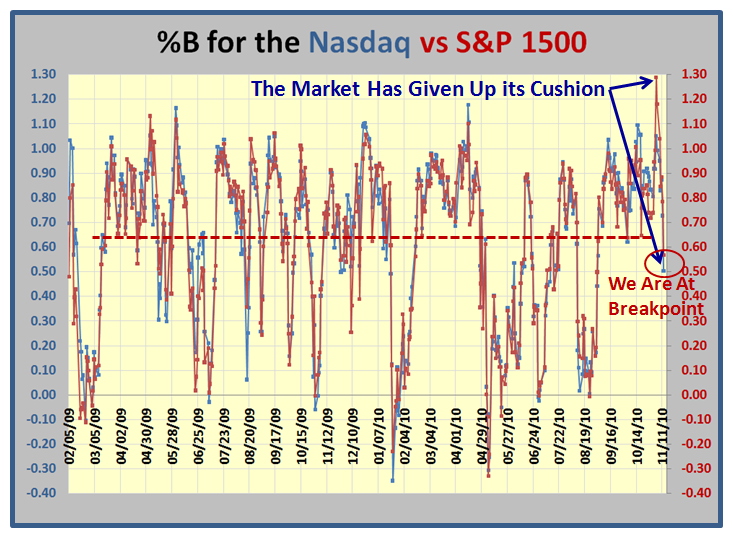
The Market has given up its cushion, and we are at the Breakpoint:

We have had an Eleven Week run for this rally, and we are again suffering from Droopy Drawers…it would seem that three strikes and you are out from the picture below.  So we shall see if the Bears can gain the upper hand after patiently waiting all this time.  Frankly a little correction would be good before we trot into the Santa Claus Rally which usually starts around Thanksgiving:

So what caused the sudden deterioration this past week?  Blame it on a Stronger Dollar, the problems with the Irish Economy and a momentary glitch in POMO land:

So what are the High Road, Low Road and Middle Road Scenarios:

High Road:  An immediate strong bounce that sweetens the Pies again to >70:30.  This will be the true test as to whether the Bulls can regain control and win the fight at the High Chaparral at High Noon on Monday!

Low Road:  The Bears follow through on the gains of this past week and we head down for a minor correction of <8% from the high.  We will worry about anything more until after we reach that crucial point.  Remember that there is a 75% chance of a recovery on the S&P 500 for <8% corrections.  After that watch out below.

Middle Road:  We trot down a couple of points more and then the Bulls rally back enough to hold the fort until the following week when they should start to gain steam once more for Thanksgiving and the anticipated Santa Claus Rally.

Best Regards, Ian.

Stock Market: Forewarned is Forearmed!

Tuesday, November 9th, 2010

My good friend, Robert Minkowsky summed up today’s action as shown below.  I used it as the headline to Grandma’s Pies, and you should all know tomorrow is crunch time.  We had a Shot across the Bow with a Distribution Day today, so keep your powder dry, your finger on the trigger and see what tomorrow brings. 

So far it is a natural and orderly pullback from an oversold Market, but tomorrow needs to perk up.  The Bears are still relatively dormant as seen by the Inverse ETFs, but with the heavy hit on Silver and Gold today and the dollar turning up, we can be in for more trouble on the Stocks.  Longer term it still feels like the Market Makers want to keep it bouyant!

Best Regards, Ian.

Stock Market: Uncharted Waters for %B

Sunday, November 7th, 2010

What a turn up for the books when the Stock Market took off on Thursday, November 4th, 2010, a day before Guy Fawkes Day when the Brits celebrate with fireworks catching the crafty fellow just before he attempted to blow up the Houses of Parliament back in 1605!  Uncle Ben flew in true to form with his POMO pumping of $600B, which drove the dollar down on that day, and shot the Market into new high ground for the moment.

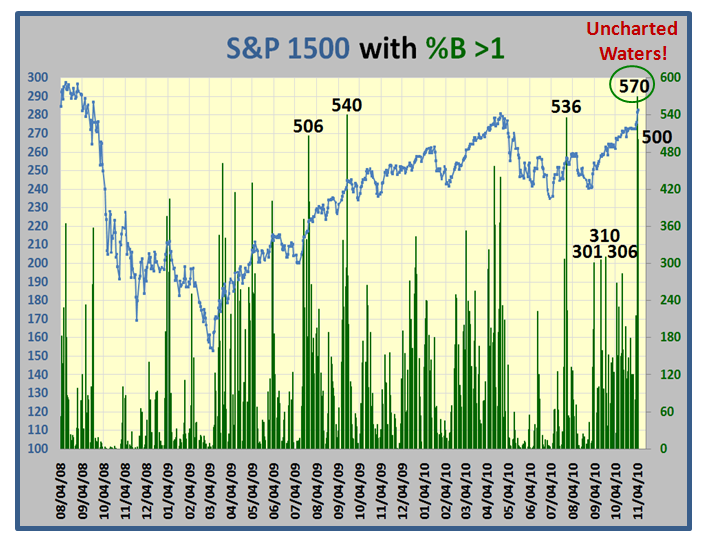
As my good friend Ron Brown says “Watch the Dollar” so keep a beady eye on its direction and if it continues down so goes the Market UP!  The Uncharted Waters came in the number of stocks of the S&P 1500 landing in the %B >1.0 Bucket, with a resounding 570 stocks as I discussed in earlier blog notes the last few days.  Eventually we will pay the Pied Piper, but enjoy it while it lasts.

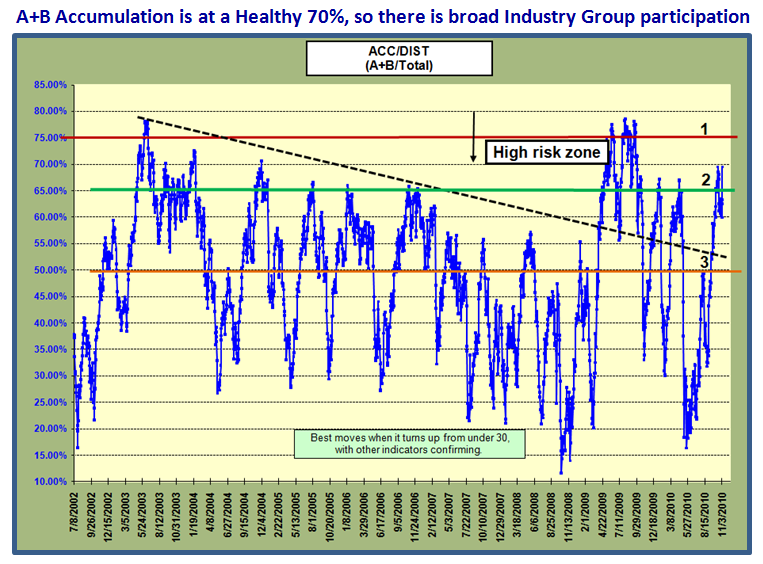
As we would expect, the Accumulation into A and B Industry Groups has risen to a healthy 70%, and there is still room to grow before we reach the danger zone of 75%: 

We are now into the 11th week of this Rally, and although we suffered from droopy drawers a week ago, the Market has new life which should live for another five to ten days before we see some form of correction.  Play this close to the vest but enjoy it while this rally lasts.  The financials have a shot in the arm to help boost things along.

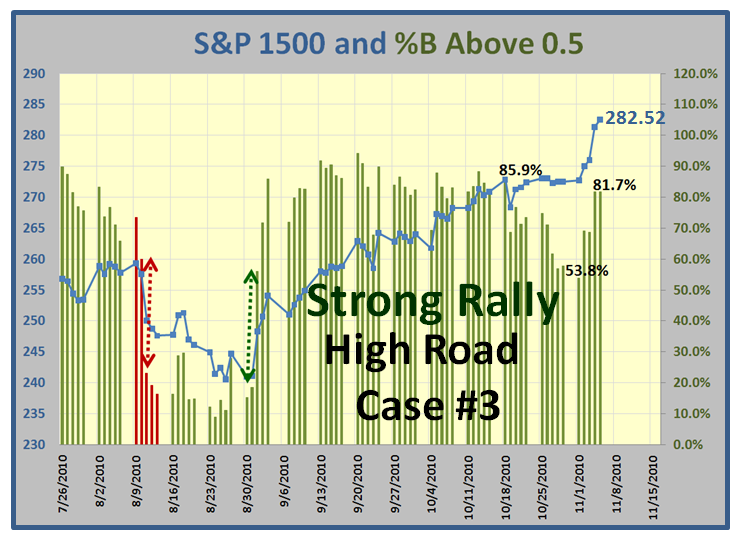
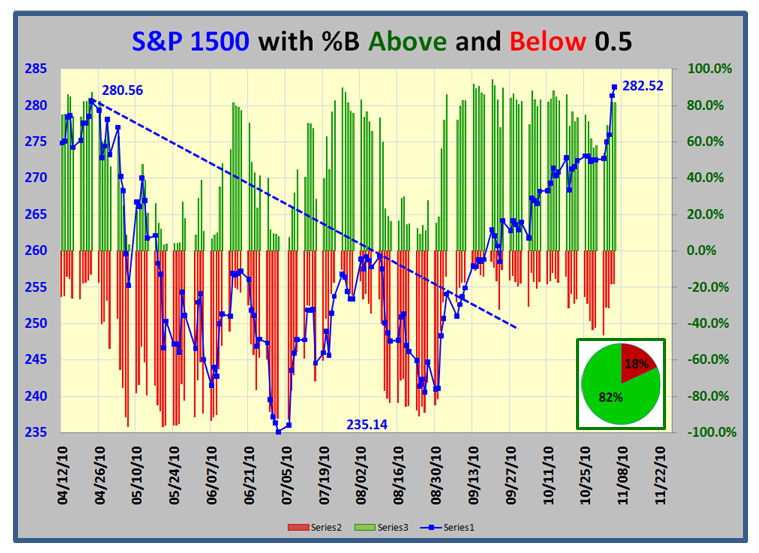
We are now into New High Territory since the Peak of the last rally and are sitting at 282.52 on the S&P 1500, with 82% of stocks above %B of 0.5:

Note that the S&P 1500 %B is ABOVE the % Stocks Above 0.5, which is a rare occurrence:

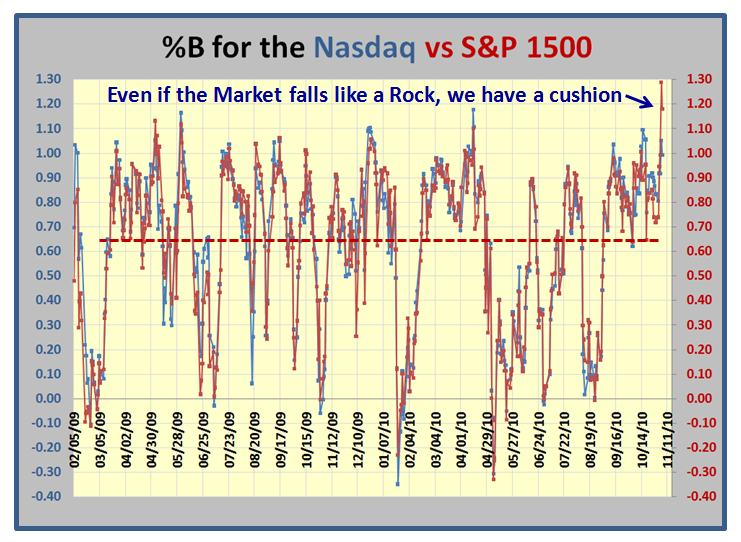
The Low Road Scenario is a Shot Across the Bow…even if there is a big knee jerk down we have a decent cushion.  A one day drop of >1.5% in the Indexes should produce a Phoenix and a Little Kahuna to the downside, but one should only get nervous if the ratio of 1500 Stocks is <65:35 for %B above and below 0.5, respectively.  If it drops below that level, as shown by the dashed red line, the party is over.

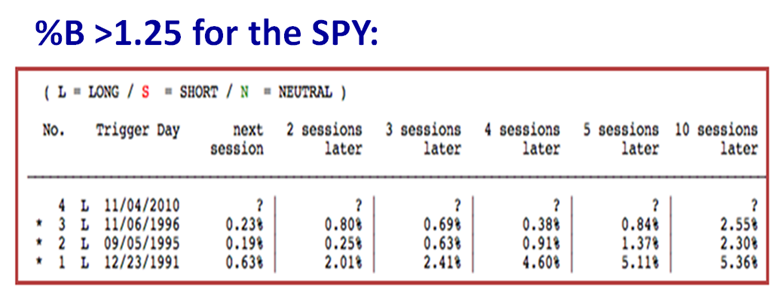
So let’s turn our attention to the Higher and Highest Road Scenarios, and there is no better way to estimate this than to use the High Jump Indicator.  In addition, we can also use the recent statistics for when %B for the SPY reached these heights as I explained in a couple of Blog Notes ago.  Here are the key numbers from that Note:

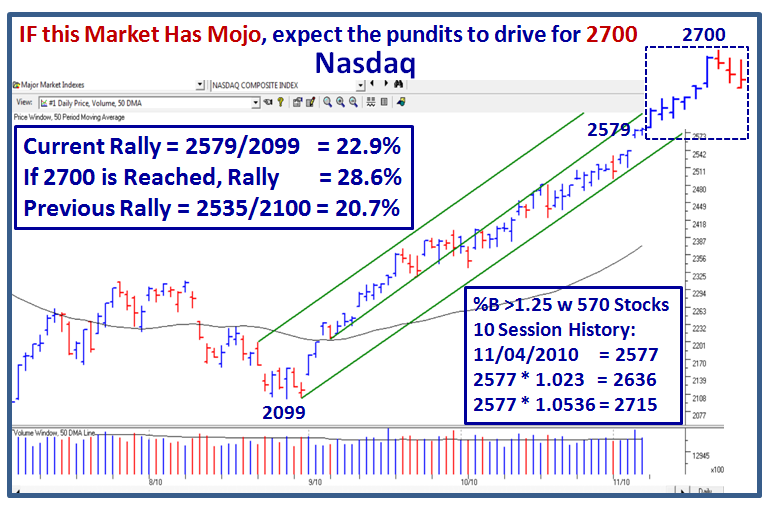
Provided the pundits try to prop this Market up, it would not surprise me if they aim for 2700 on the Nasdaq and ~1300 on the S&P 500.  These are enticing round numbers which are certainly in reach for a climax run, and are not out of the equation for target setting:

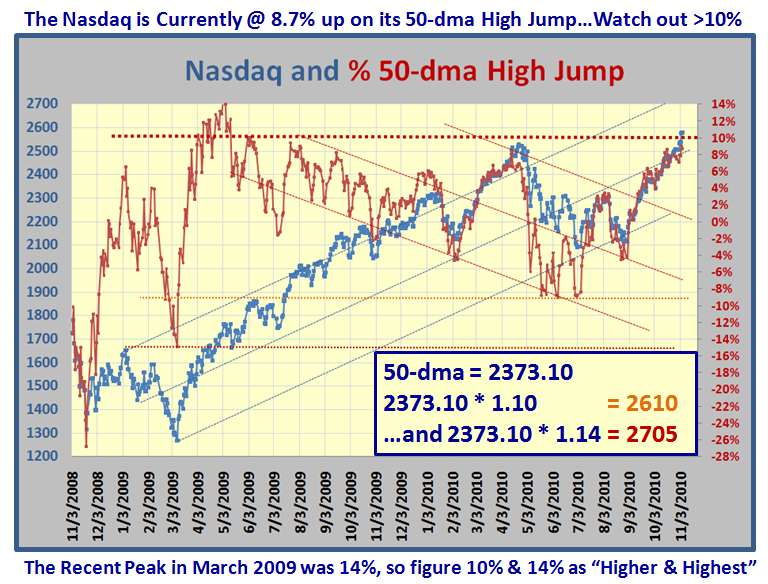
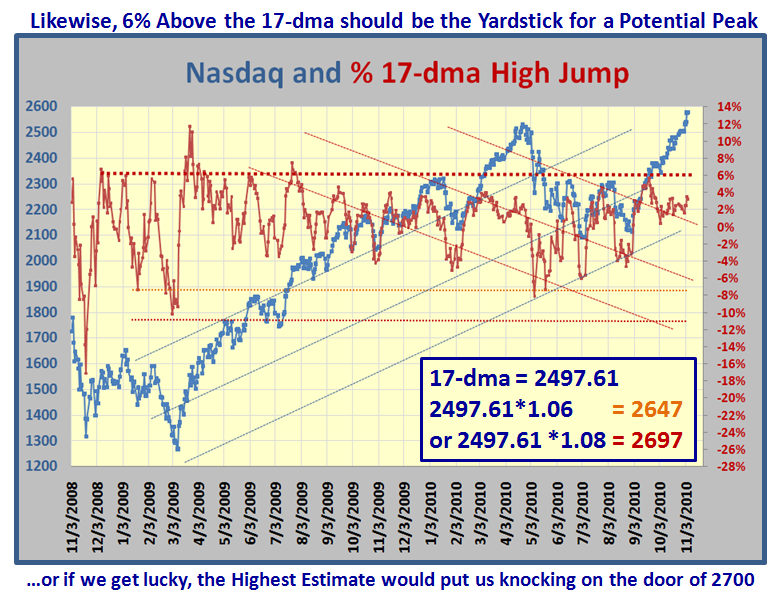
Now let’s try my trusty High Jump for the Nasdaq using both the 50-dma and 17-dma:

Summarizing all of the above numbers leads us to watch 2610, 2650 and 2700 as High, Higher, and Highest on the Nasdaq.  You know my sign off lines by heart now…Never fall in love with YOUR Scenario.  By all means establish targets for the high and low road scenarios, since that is part of doing your homework.  However, let the market tell you which one it is on.

I hope you are enjoying this new stuff on blending %B into the equation to give us a good feel for which way the wind is blowing. 

Best Regards, Ian.  

A Special Hello to Theresa!

Saturday, November 6th, 2010

Theresa Wrote:

We really appreciate your prompt response to Robert via your blog so we all can benefit from your insight. We especially appreciate all the time & effort you put into digging up the old data to further substantiate your analysis.  You definitely have outdone yourself on this one!

Now may I ask 2 stupid questions?

1. What clues do we look for to see how long/severe the potential correction may be before we head for the Christmas rally?
2. Do you see a rotation out of tech sector into financial based on Friday’s action?

Theresa…Thank you for your note of appreciation.  You are one of the faithful ones who always gives encouragement, and you never ask “stupid” questions.

Here are the clues to look for:

1.  It’s back to basics…I taught Peter 15 years ago and you 10 years ago to watch the High Jump.  With a Strong Eureka coupled with a Breakout Gap up on most indexes (probably an Exhaustion Gap), we should expect strong momentum as evidenced by the 570 and 500 S&P 1500 stocks recorded above the Upper Bollinger Band, i.e. >1.0.  That implies that the High Jump will reach for its normal “Higher” record of about 23% for the Total of the 17, 50, and 200-dma as shown in “High Jump Individual Lines” in your Charting Module using the S&P Super Composite 1500 IDX in Major Market Indexes.  If the Momentum is relentless, expect this to rise to 30% as it did back in 7/09.  Although the Total Index itself may start down from its peak, expect the Market Index to continue up for a few days more.

2.  I also taught you that the Greatest Leaders rise above the 9-dma.  However, I emphasized that when they rise above the 4-dma to watch out for a climax run as Indexes, Industry Groups and Stocks cannot sustain that steep a rise for very long.   When the 4-dma turns down, and then plunges through the 9-dma (these days most use the 8-ema), the party is over, ESPECIALLY if there has been a 1-day correction of >1.7% in most of the Major Market Indexes.  Eventually the 9-dma (or 8-ema) will have crossed over down through the 17-dma, and if it is to be a severe correction, the 17-dma will break the 50-dma.  By then you snoozed too long so you will lose…big time.

3.  If we have a big correction, then for sure it will be accompanied by a Phoenix and at least a Little Kahuna to the downside. That implies that “Buckets” will be skipped to the downside. A little Kahuna means 2 buckets skipped and a Big Kahuna implies at least 3 or maybe 4 buckets skipped to the downside.  You have a lot to catch up with when you next attend the seminar.  I know, I know, happy family affairs are far more important.

4.  By then Elder’s Force Index 2-ema followed by his 13-ema (Ron’s favorite indicators) will have turned from Green to Red.

5.  More recently, you have learned about 12 Drummer’s drumming.  That suggests that we have UPTO 12 days before the current Rally corrects.  I covered all of that in my last note, so you are on guard for what to look for.  Please understand that the last long rally that ended after 65 Trading Days, took only two days to break from its high when it recorded over 500 stocks >1.0.

6.  Ron has pinpointed the action of the Dollar as a critical item to watch these days.  The market is currently working inversely to the fortunes of the Dollar.

7.  Again, as I have taught you for ages, no strong rally can have wings without both the Technology and Financial Sectors on fire.  As you well know, Technology has been strong throughout this rally, but the Financials have been in the dog house, and it is no surprize that the XLF ETF has taken off these last two days since the POMO action reported by Helicopter Ben of $600B.  I would be very surprised if Technology stocks gave up the ghost.

And there you have it!  Best Regards, Ian.

Copyright © 2007-2010 Ian Woodward
Disclaimer: Commentaries on this Blog are not to be construed as recommendations to buy or sell the market and/or specific securites. The consumer of the information is responsible for their own investment decisions.