Ian Woodward's Investing Blog

Archive for the ‘Market Analysis’ Category

The Stock Market High and Low Road Targets

Sunday, July 19th, 2009

two

Every now and then, we come to the junction of Robert Frost’s “The Road Not Taken”.  This is one of those critical moments in time.  All the odds and most of the sentiments point to the Low Road, since this Bear Market Rally is long in the tooth, produced records for moving higher faster than most in the past, and showing signs of drooping.  Just last week, it chalked up seven straight days up on the Nasdaq, and the SOX Index is moving up in leaps and bounds.  Likewise for every point that can be made in favor of the Market continuing to rise, there is a counter-point that seems equally plausible.

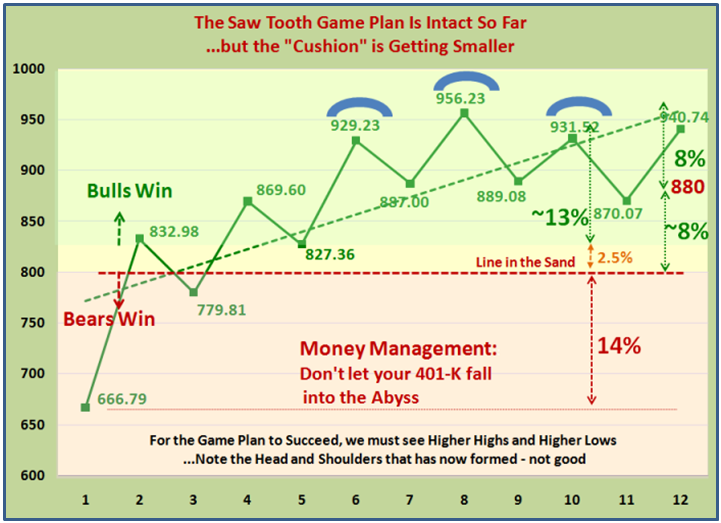
In the July Newsletter I covered the gory details of the Golden Cross Debate, and one piece out of that study needs repeating on the blog.  The next two charts bound the immediate High and Low Road Scenarios based on past statistics and we do not have long to wait to see which way this round of events is pointing.  Note that by Thursday, the 23rd of July, we should see our first stake in the ground going forward.

gc 1

gc 3 

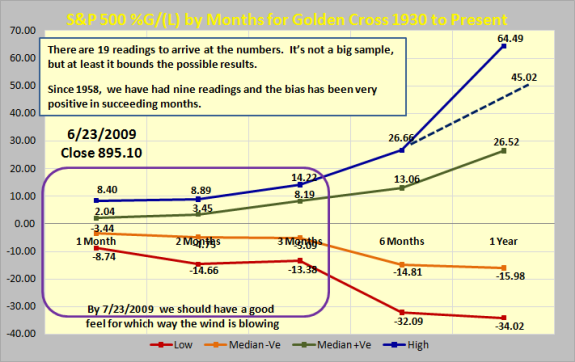
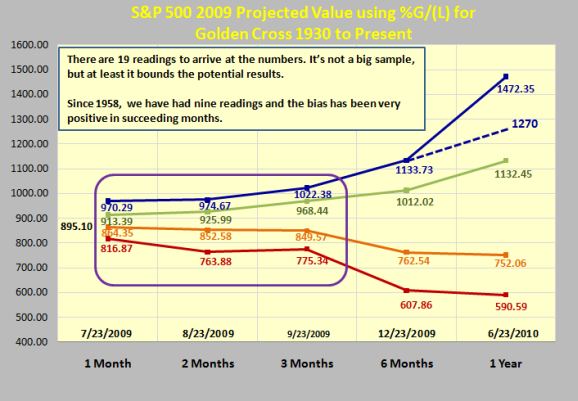
Note that the boundaries are either -8.74 % down or +8.40 % up for the worst and best cases, respectively.  I will note in passing that we have already had a 9% drop in the S&P 500, albeit not according to the current pictures relating to where we go from here.  Going into tomorrow, we are on the positive side of things with the current reading as of Friday on the S&P 500 at 940.38, which is just 35 points from the highest target.  We are in the thick of the Earnings Reports season, and there can be many a slip twixt cup and lip, but so far so good with the technology big stocks coming through with beating estimates.  It is no wonder the Semiconductor Index is on fire.

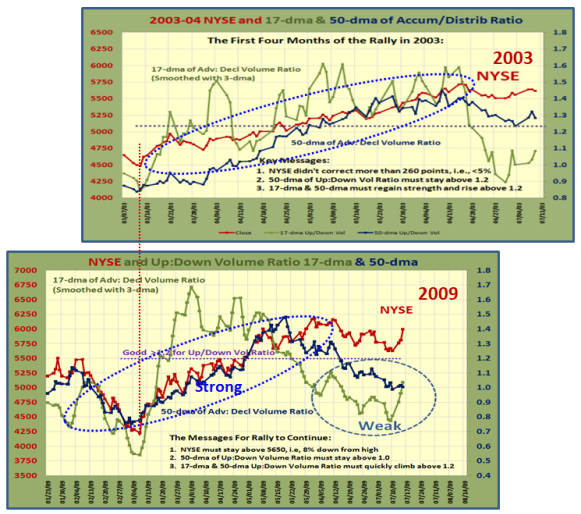
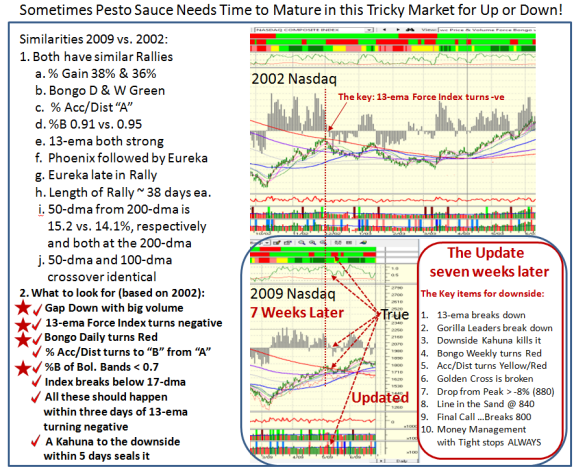
It is not surprising that the 2003 Bull Market Rally is viewed as the recent benchmark for a successful move coming out of a long recession.  Most pundits point to the fact that this recession is still young in time compared to that 2000-03 timeframe, being only half the time.  All Technicians will point to Price and Volume as the yardsticks to measure.  We are now 4&1/2 months into the Rally, and we know that after the first 2&1/2 months of major thrust in both Price and Volume, the Rally has lost its steam by in essence going sideways for the past two months.  But sometimes that is exactly the “Pause to Refresh” needed for all mountain climbers, before they conquer the next peak.  You be the judge:

acc 2003

acc 2009

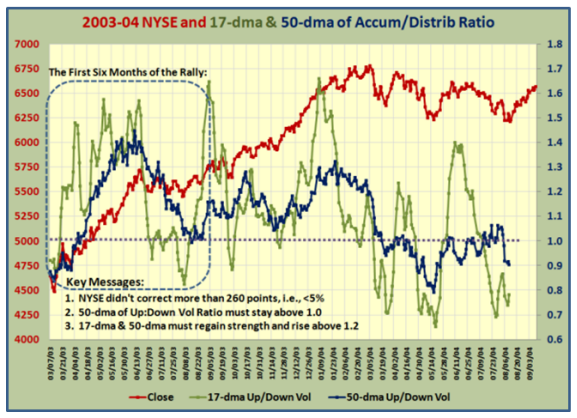
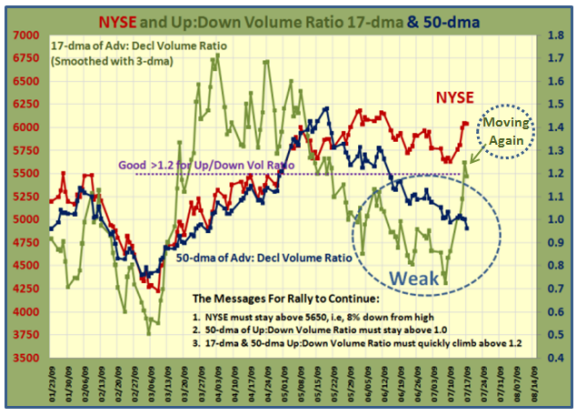
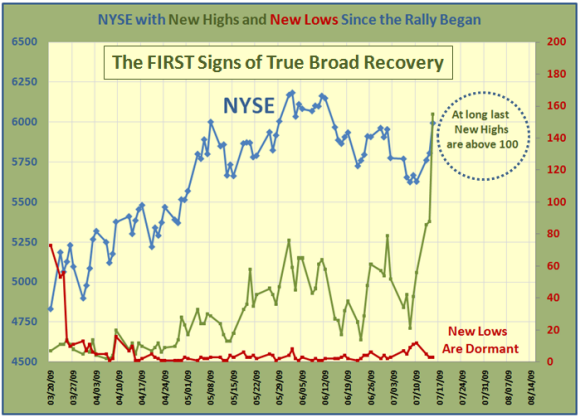
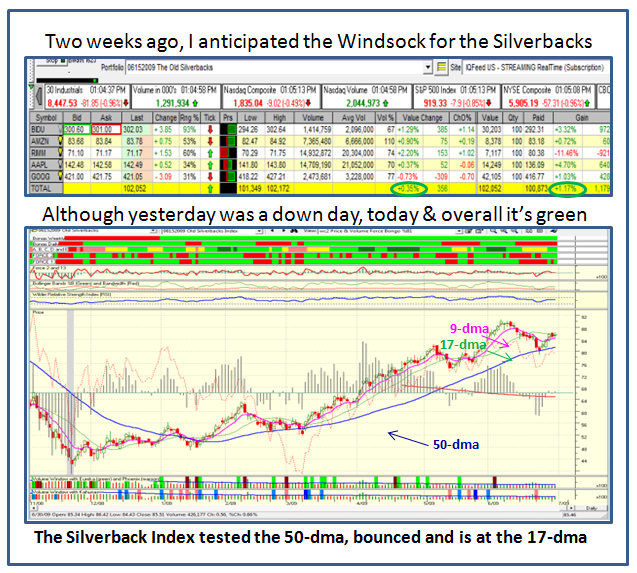
It doesn’t take long to see that the initial move on both Price and Volume was superior than the 2003 timeframe for the first 2&1/2 months.  Granted it has fallen below the 1.2 ratio we expect for continued momentum over the longer haul, surprise, surprise, the 17-dma has perked up considerably this past week….moving again.  The next week will tell us whether this was a flash in the pan or we continue to see the ratio rise to the required 1.5 to 1.7 level.  the 50-dma Ratio must climb back above 1.2 and stay there.  Be assured that the move must be very strong with the Nasdaq driving hard to 2000 in the next week, and the S&P 500 to 970 for this move to be on and believable.  Now let’s look at the Total NYSE volume picture for the two occasions, 2003 to 2009:

vol 2003

vol 2009

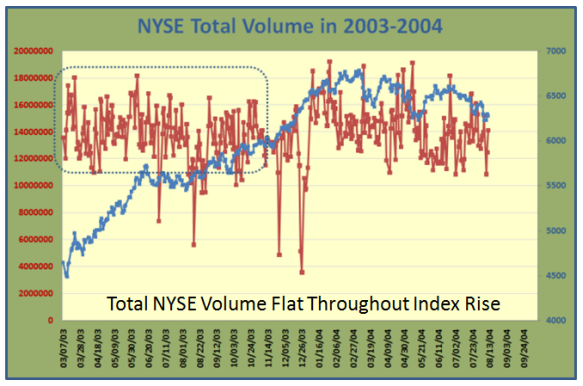
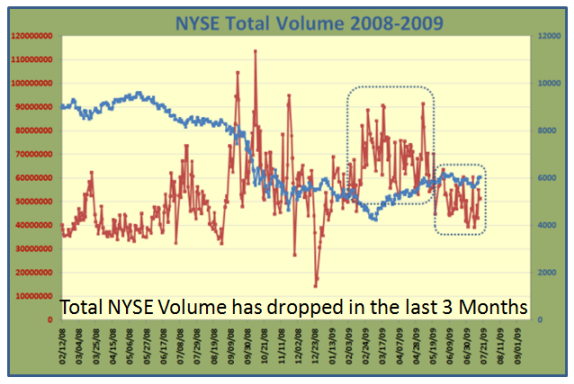
Of course the recent hue and cry is “Where is the Volume”, and certainly that is understandable, since there has been a recent dip by a factor of two.  However, if you look at the 2003 timeframe it was relatively flat for not just one year but two during the entire price climb.   Certainly we would want to see the number get to the higher end of the current range at 70,000,000 (say), but I do not believe we need to see it much higher for the rally to succeed.  Remember this is the period of the summer doldrums.

I wind this up with the two sides of the coin, the ten targets for the Bulls and the Bears:

upside

downside

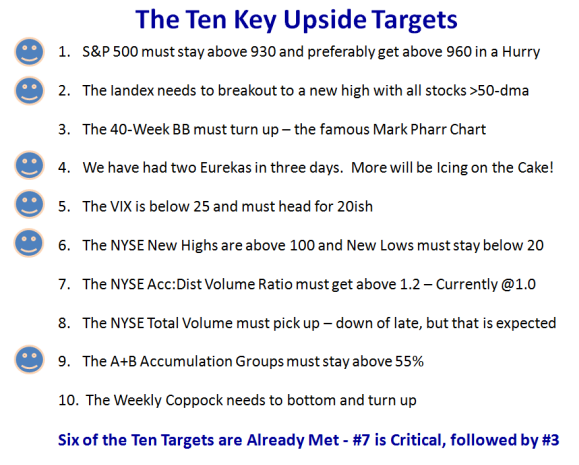
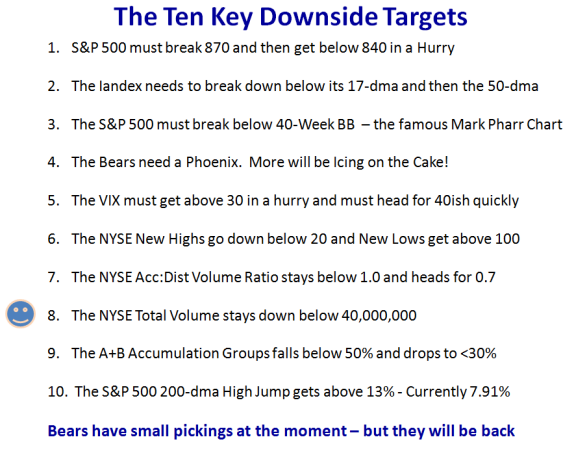
If you believe these are the right targets at this time, then the Bulls have the upper hand.

Best Regards, Ian.

Buy and Hold Type 4’s…Get Ready to Rumble!

Thursday, July 16th, 2009

Let’s not get too excited as the Jury is still out waiting for the bulk of the Earnings
Reports.  However, provided we do not have a meltdown, the slow signs of progress
in the Internals of the Market suggest that the Buy and Hold Type 4’s should get ready to rumble.  The key number on the S&P 500 is 960 and above!

Both Goog and IBM beat estimates so that bodes well for EPS Reports.  Tomorrow is Options Expiration.

          chic

Lets dispense with the Downside Scenario:

1.  If we break 870 to the downside, it’s curtains for the Type 4’s.  Be patient

2.  If we break 840, Type 3’s are long since gone and sitting on the sidelines

3.  If we break 800, you are a fool not to protect your 401-K…period

saw

The Upside Scenario:

1.  We have arrested the Head and Shoulders Top…for now

2.  Type 3’s should be nibbling above 930, with tight stops

3.  Type 4’s still need clear signs that we are on our way again…get above 960

The Stakes in the Ground and the Measuring Rods:

a.  NYSE New Highs must stay above 100…it just reached 155 yesterday

b.  The Accumulation:Distribution ratio must get back above 1.2…it is at 1.0

c.  The 40 Week MA needs to turn up…it is currently flat, which is a good sign

highs

up down

s

nas

I hope it was worth waiting for.  Newsletter, Guests visiting, rotten cold, getting better.

Best Regards, Ian.

Finding Possible Gems in a Down Market

Sunday, July 5th, 2009

               baubles

The Market turned sour on Thursday and the HGS Investor Software can always be counted on to find stocks that are swimming against the tide…if you are so inclined.  The Bad day which brought out irrational exuberance by the Bears was registered with a Phoenix Signal.  Naturally, the airwaves are abuzz with Head and Shoulders Tops and the expectation that we are now headed down with the  long in the tooth Bear Market Rally petering out. 

To find stocks that are showing strength and going up when the market is going down, the HGSI software has another arrow in its quiver which is to ferret for stocks that have strength by filtering for “Up” Kahunas, i.e., a 1-Day Change in %B of the Bollinger Bands of > +0.24.  Of course you can also go the other way to find stocks that are weak by filtering for %B of > -0.24, but that is not the purpose of this note.

Here is a Filter that will do the trick and gives a small list of stocks that has positive momentum on a rotten day.  As one would expect, the list is not awe-inspiring, but beggars can’t be choosers.  The two with the highest ERG are in the Retail Restaurants Industry Group, i.e., PEET and BAGL.  Another thing  that pops up is an interesting Wolf Pack with poor numbers coming out of the ashes – Fin-Invest Mgmt.

0.24

Now here is a further trick to see if anything more can be gleaned regarding these two Groups.  Just toggle the Bollinger %B 1-Dy Ch by reducing it down to 0.18, i.e., 2/3rds of a Kahuna.  True enough, we add one more stock to the Restaurants and two more to the Fin-Invest Mgmt groups.  I’m not for one moment suggesting you plunge headlong in the tide, but at least it would pay to see if these were just one day wonders or there is a Bauble, Bangle and Beads in the mix by putting them in a watch list and see what happens first thing tomorrow.

0.18

Not to belabor the tricks, but you might as well zero in on the Restaurants as a Group and it won’t take long to add TAST to the list, which was dormant on Thursday.  Note that the Group Rank is 98 and the stocks have strong 13-ema Force Index for the past five days with Kahunas coming out of their ears on some of the days, with PEET the last two.  Understand I don’t tout, but I am showing you how to ferret for candidates.  It is always “Your Call”.

Best Regards, Ian.

Which Way is the Stock Market Windsock Blowing?

Tuesday, June 30th, 2009

  Werner from Amsterdam made an astute observation on the bulletin board which
suggested that the “Old” Silverback Gorillas we depend on to show the way and
that yesterday they were acting weak despite the SPX being up.  “Sczaplam” who
is a “newbie” to the Group and is eager to learn asked a follow up question for an
explanation.  So it is time to bring out the Stock Market Windsock to see which
way the wind is blowing:   

   windsock

Werner writes:
Some of the horsemen such as BIDU, AMZN, RIMM, AAPL & GOOG are acting
weak today, even though the SPX is green. Maybe another warning?

“sczaplam” queries:
In view of today’s action, could you expand on exactly what you saw to declare
the stocks were weak? Any chart views you use?  Thanks so much.

So let me show you how we do it using both HGSI software and also QuoteTracker
which dovetails with it.  As I have shown several times, the best way for an early
warning sign is to follow the Leaders and you need only go back a few Blog Notes
to see the 25 I have been using, so we will dub these the “New Gorillas, but I will
cover both.

Let’s start with the Old Silverbacks:

old

Always remember that leading stocks rise and fall above the 17-dma.  If their
Index breaks that moving average then watch out below, especially if they break
the 50-dma.  By that point your profits will have vanished.  At this stage the Old
Silverbacks are still intact as an Index, but they must get back up above the 17-dma
and then their recent collective high registered about 15 days ago.

Now let’s look at how the New Gorillas are fairing:

qt

gor

Although the last two days have seen a sell off, the Index is actually stronger as I
show at the bottom of the chart.

The bottom line is that the Leaders are still intact and at this stage the Windsock is
blowing East to West, i.e., in a trading range going sideways.  The true warning sign
is when they break the 17-dma to the downside.  The Bulls can take comfort if the
two Indexes break through the old high three weeks ago.  The Bears are Hungry
and waiting for their after July 4th meal.

Best Regards, Ian.

No Smoking Gun and the Bears are Hungry!

Saturday, June 27th, 2009

As you have gathered by now the lead off picture invariably tells the theme of the story line, but this time you will forgive me for using two pictures. 

The first one is a continuation of the last blog where I left you with the thought that the Fed Chairman, Ben Bernanke was due to speak to Congress the next day and to expect him to vigorously deny any cover up, and true to form, they gruelled him for 3 hours and 15 minutes and he outfoxed them all.  The Market remained strong all day on Thursday, but in fairness it was not only due to his solid testimony but also the Bond Market had a roaring $104 Billion auction on that day.  In my opinion and I don’t often take sides on this mumbo jumbo…if they replace him at the end of his term, heaven help us all.  He has been the most trustworthy of the whole bunch.

            gun

The second picture shows the tricky state of affairs on this market and we are literally again at the crossroads of the decisions we all have to make.   I gave you the early warning signs all of seven weeks ago, but I am getting ahead of myself, so let me introduce the latest theme:

bear

Now let me come back to the Pesto Sauce Picture I put up seven weeks ago on the blog note of May 13th, in which I showed you the signposts to watch for and then occurred, using the HGSI software to guide you.   I am sure those who follow my blog will recall the following chart and we had a good laugh on the Pesto Sauce cooking theme which “mk” introduced and I chewed on at the time. Unfortunately in this day and age people skim so here it is again to remind you:

pesto 1

The moral of that story at that time is that indeed the market did correct, but NOBODY, nobody knows when and for how long.  I try to be fair and give you both sides of the coin, but it is “Always Your Call”.  The market will invariably fool you and I, and do the opposite.  However, the rest of the story is to always have an up, down or sideways plan and let the market tell you which way it is headed.  Never fall in love with one scenario.

Given all of that, I offer you a new line on the Maturing of the Pesto Sauce Theme, in which I have UPDATED that chart of May 13 in the Bottom RIGHT HAND SIDE of the Chart, with the ten items that need to happen SHOULD this Market start to crater around Independence Day.   I don’t have a crystal ball and I am not suggesting there is something magical about after July 4th.  However,  with all the Russell 2000 re-balancing that took place on Friday that shot the Volume up and the fact that we are now nearing the end of the month, the quarter and the half-year mark, window dressing will be the focus next week.  It seems to me the serious business will come after they have had their fill of Hot Dogs, Hamburgers and Pesto Sauce!

pesto 2

Note how the Chart shows that after declining for about 7% for a couple of weeks, it finally got enough oomph to break through the 200-dma with gusto and then dragged the 50-dma up to achieve the much-looked-for Golden Cross.   If you look above and below at the ribbons and “stakes” you can see that they were all positive.  Then the first signs of  once again starting to droop was the Bongo Daily going red and we saw the 13-ema breakdown, as shown.  If you look at the very last day we see the 13-ema is up again with a Light Blue Kahuna at the bottom, suggesting some momentum to the upside, but remember it was re-balancing day.

To the right of the bottom chart, I show the steps in the process for the Market to give up the ghost.  Don’t read anything into that, as I show below the items to watch for the upside:

1.   13-ema stays up and shows continued momentum by the growing size of the black bars
2.   The %B moves up again above 0.7 and heads for >1.0 along the way and stays up
3.   The Bongo Daily turns Green and stays that way along with the Accum/Distrib
4.   The S&P 500 rises above 920 as shown in the last blog where Type 3’s nibble
5.   The market surprises the Bears,heads up through 960 or stumbles there
6.   It won’t hurt to see an Eureka or two to show some irrational exuberance by the institutions
7.   It would be even better if they are accompanied by a Kahuna along the way
8.   Wonders never cease when the S&P 500 hits 1000, and the pundits will say “I told you so”
9.   All Golden Crosses would chalk up by then, be they measured in dma or ema
10. Type 4’s who didn’t enter will say “Shoulda, coulda, woulda”

And…so the cycle will continue and the HGSI signposts will continue to guide us as to which way the wind is blowing.  The one constant in all of this is that Money Management is key and keep tight stops until you have a big cushion.  Then decide how much profit you are prepared to give up to play for the long haul.  Just when you start to rub your hands and think you can do no wrong is when you should take some profits.

Now let me bring you down to earth – this market has only been playable by Type 1’s, the intra-day players.  Type 2’s have been frustrated, Type 3’s the swing traders know better not to gamble, and Type 4’s are on vacation.

Technical Analysis is a windsock, not a crystal ball [Carl Swenlin].

However, I offer you some Pesto Sauce to go with the July 4th celebrations.

pesto 3

Best Regards, Ian.

Copyright © 2007-2010 Ian Woodward
Disclaimer: Commentaries on this Blog are not to be construed as recommendations to buy or sell the market and/or specific securites. The consumer of the information is responsible for their own investment decisions.