Ian Woodward's Investing Blog

Archive for the ‘Market Analysis’ Category

The “What-If” for a Magic Silver Bullet

Saturday, May 9th, 2009

My last blog has produced a series of discussions which are looking for a Magic Bullet.
Please read the Comments at the bottom of the blog titled “Early Warning Signs for a
Correction”.

bullet

As I have always said…there is no such thing as a “Magic Silver Bullet”, but if you press me to the wall  I will give you one that should do the trick to cause the cascade of events I
provided last week in my last blog where I gave you the four lead bullets: 

1.  Bongo Daily turns Red
2.  13-ema Force Index turns negative
3.  %Acc/Dist turns to “B” from “A” – this has already happened
4.  The Nasdaq breaks below the 17-dma

One more negative day of -50 points or more on the Nasdaq should cause the correction
we have been looking for, but it must happen early this coming week with no big moves to the upside in between.  Otherwise, it goes higher to reach the Target of 934 to 940.  Then we review the bidding at that stage.

Let the Market show you what it is doing rather than wishing for a scenario to happen.  By all means develop reasonable “What-if” conditions for what must happen, either up or down…that way you are not surprised when you see it unfold.  Let’s see if this one comes about.

There is one cardinal rule which you should never forget…”All Great Leaders rise above the 17-dma; the greatest rise above the 9-dma”.  After a long rally, once an Index or a Stock breaks down through the 17-dma the rally is usually over for a while.

Best Regards, Ian. 

Early Warning Signs for a Correction

Sunday, May 3rd, 2009

Michael Kahn of Barrons asks:

If I am not mistaken, there was a pheonix last week followed by a eureka. Since we are  25% to 30% into a rally, a eureka is supposed to be exhaustive even w/o the phoenix.

sell?

Michael:  I wish it were that easy, but you have it “half-right”.  An Eureka Signal will indicate the Bulls have irrational exuberance.  Where it happens is the clue.

1. Several Eurekas in a row after a Base Low is a strong signal that a new Bear or Bull Rally is starting.
2. However, a Eureka late in the Rally also signals an Early Warning Sign that the Rally is probably over for now and a correction is due.  However, that alone does NOT constitute a SELL signal.  I have attached a PowerPoint slide below as to the entire rationale.  You heard it here first! 

early

Best Regards, Ian.

The Rally is Climbing a Wall of Worry

Sunday, May 3rd, 2009

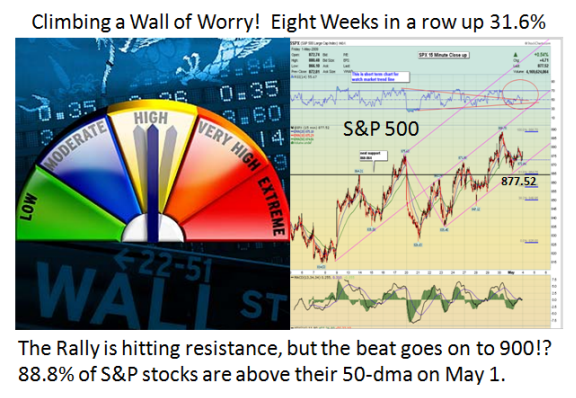
This Rally has confounded most “Quant’s” and for sure all the statistics seem to show
that the majority of the action over the last 38 trading days which has yielded a 38.3% gain is due to Program Trading.  Intra-Day Traders are being creamed unless they play in moments.  The Rally is long in the tooth as nearly 90% of the S&P 500 Stocks are above their 50-dma on May 1.  The question is does the beat go on to reach the next Target of 900 or do we take the expected correction which most Bears are itching to get their hands on.

worry

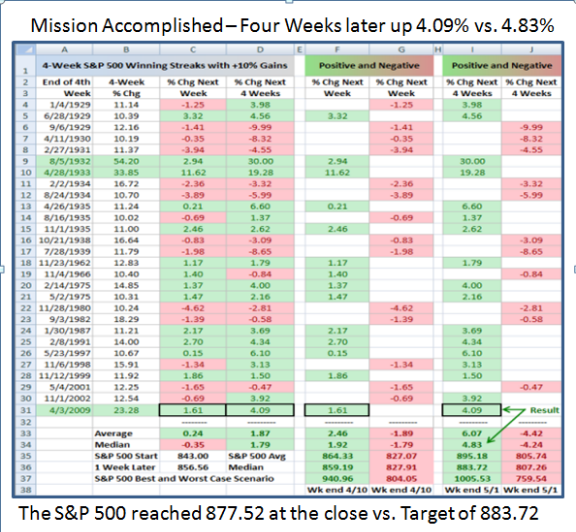
Before I discuss the Low, Middle and High Road Scenarios, let’s look at the happy
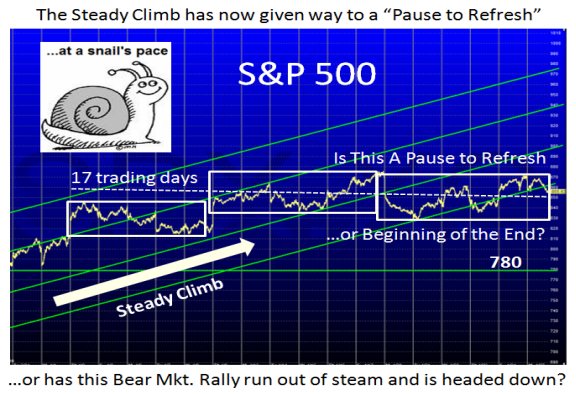
results of the past eight weeks.  You will recall that four weeks ago, and then again three weeks ago, I displayed the following chart wondering if History repeats itself.  It did!

history

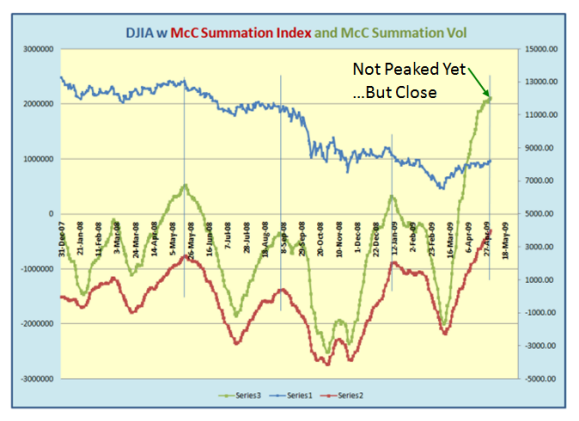
There are several factors we watch that tell us we are in relative “nose bleed” territory, and one of them is the McClellan Summation Index.  In the Chart below I show the Summation Index (red line and right scale) to be at 4000, but worse yet is the Summation Index Volume (green line and left scale) which is at a startling 2,000,000…not seen before.  We have traipsed from Oversold to Overbought in a short 38 trading days.

index

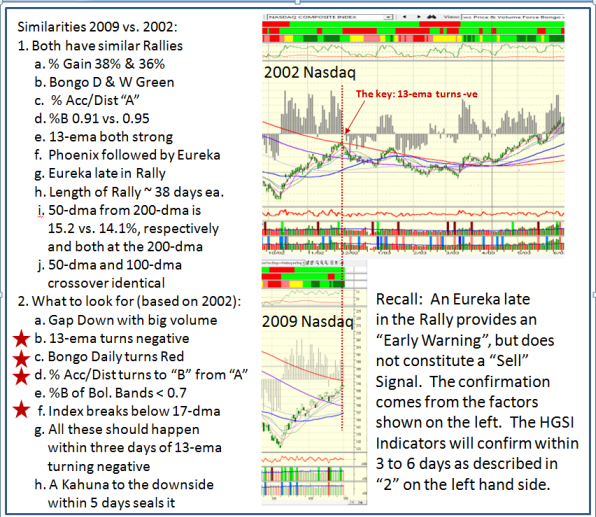
This is a very sharp advance in such a short period of time, and that has occurred three times before, all from the 1930’s!  The chart below lines up the bottoms of 2002 and 2009.  Note that the current rally has exceeded that of 2002 as shown after 38 trading days.  What then are the three obvious Scenarios?

three

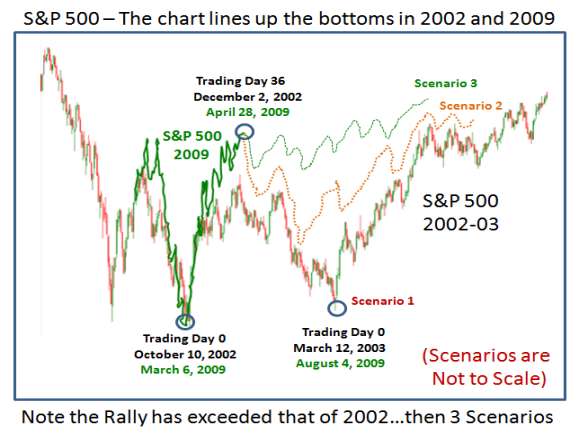
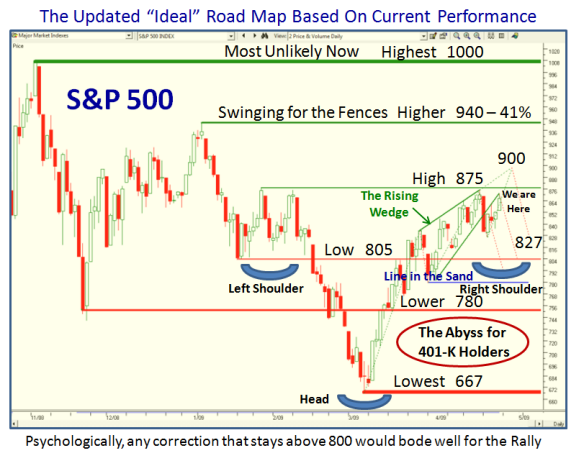
1. The expectation from the majority is that we should see a correction leading to a
double bottom.  This is favored by most fundamentalists who immediately point to the fact that the S&P Earnings cannot support anything higher than 900 at present given the overall poor earnings reports especially from the Financial Sector.  I show this as retracing to the current low of 667 with the implication that there is heavy bad news to come through the summer months, when the Market traditionally sells off anyway.

2. The second scenario shown in Orange suggests we could see a 50% Fibonacci retracement which would be an Intermediate Correction of about 12% and would take us down to 777.

3. The third Scenario suggests that the worst is behind us with regard to the Economy and that we should not expect more than an 8% correction from where we are now.  That would take us down to 807 or just above the psychologically critical 800 mark. 

This last Optimistic Scenario would suggest that we could be in the 1932 to 38 Model and, so let’s see what those three occasions could bring us:

a.  The Market advances another 63% for another five weeks as it did in 1932

b.  The Market advances another 70% for another 12 weeks as it did in 1933

c.  The market advances another 6.5% for another two weeks as it did in 1938

It goes without saying that the first two are wishful thinking, so the third would give us 934, which is close enough to the 940 target that I have suggested as a possibility from time to time.  Please understand that the Nasdaq 100 which has been the brightest of the main Indexes is right at its 200-dma so is up against resistance, with the Nasdaq close behind.

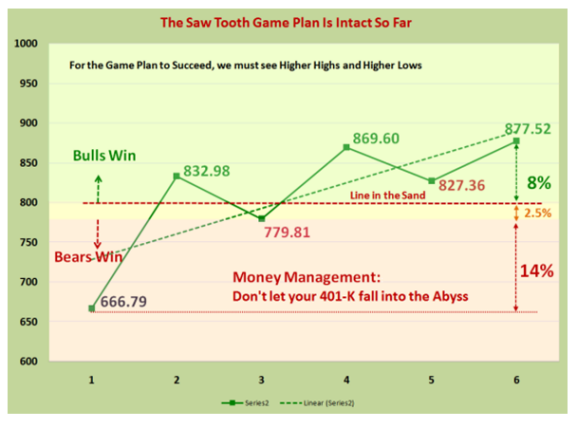
If we stare at these scenarios, anything above 800 on the S&P 500 for a retracement is gravy and would maintain a positive Psychological advantage for the market continuing on the rally.  Anything that leads to Scenario 2 and then 1 takes us back to gloom and doom.  Longer term holders should seriously watch the 800 mark and make some decisions if it trundles below.  Those who have missed this rally had better be on their toes if the correction is no worse than 8% or the market stays above 800.

Here’s the Latest Game Plan:

plan

Best Regards, Ian.

Stock Market Pause to Refresh or Stalling Out?

Monday, April 27th, 2009

We are at the crossroads on this Bear Market Rally.  We may be pausing to refresh but there are underlying signs of instability on the general “feel” right now.  A good friend of ours, Dave Steckler, gave the HighGrowthStock Investors (HGSI) a picture which sums up the roller coaster action that Day Traders are experiencing:

roller

To confirm that things are in the balance at this point are three other factors that give Early Warning Signs to be on the look out for problems which I keep a beady eye on.  They are summed up by the S&P 500 stalling for this past week at the Double Top I mentioned yesterday at 875.  In addition the VIX has gradually been creeping up from a low below 34 to close to 39 these past few days, and the overall QID/QLD Bull and Bear Momentum Indicator is drooping.

early

Here they are for you to digest in quick succession as the explanations are on the charts:

sandp

vix

qid

We have the potential for a very volatile week with both good and bad news.  Wednesday has two big ticket items…the 100 day Presidential reign which should be a positive event, and the release of the GDP.  Numbers are as drastic as a 7% drop while a few see a drop of only 3%.  If it is a big number that would give cause for concern to the downside, but if it is less than expected, the “green shoot” optimists may try to push the rally into overdrive which can help regain the momentum to the upside.  It goes without saying that the swine flu potential epidemic is also troubling, but seems to be contained for now.  Be aware we are still on a rally until further notice.  This note is to alert you to be on your toes.

Best Regards, Ian.

This S&P 500 Wedge is a Meat Grinder!

Sunday, April 26th, 2009

Sometimes the Stock Market can do funny things to the best of Technicians, especially when it is so skittish and entirely event driven.   There seems to be a temporary air of good feeling which is taking earnings in its stride, as corporate America so far has cleared the low bar set by Wall Street.  Also, after falling at a 6.3% annualized pace in the fourth quarter, a 5.1% decline for first-quarter GDP was the median forecast of economists surveyed.  “Despite the massive contraction in the economy, the expected composition of first-quarter GDP should show encouraging signs,” wrote economists for Credit Suisse.

It would seem we need a new definition of a Wedge, and should take a leaf out of the Surfer’s book.

          wedge

The Wedge is a combination of two waves that merge together, thrusting into a titanic slingshot that breaks with enough pounds per square inch to send an Iron Man to the mat.  The Bulls are hoping for such a sling shot that will swing for the fences with at least a 41% Bear Market Rally from the low to take it to the illusive target 940 level we have talked about – the “Higher” Target.  However, before the Bulls get too carried away, there is the little problem of a double top just above Friday’s close that the Market must get above at 875.  Otherwise the pundits will be saying all is not lost for the Bears and the Market is headed for a correction should it not get past that number with authority.

The intra-day Type 1 and 2 Traders are scratching their head as they have to contend with awful zigzags as the market heaves, bends and pulverizes even the intra-day players:

Intra Day

So given all of that, here is an Updated “Ideal” Road Map which shows the alternative Targets which have come into focus.

road

The three immediate Targets for the Bulls are:

1.  Get past the Double Top at 875
2.  Drive for the reasonable follow-up to 900
3.  Then Swing for the Fences at 940, 41% up from the Base Low of 667.

The downside looks better and better with every notch higher.  It goes without saying that the Bears lick their chops the higher the market goes, but meanwhile the early birds are having to cover their shorts. 

1.  The most important psychological Target is to stay above 800, almost an 8% cushion.  That would bode well for a continuation of the current rally as the pundits will jabber about an Inverse Head and Shoulders set up for the next leg.
2.  After that, anything between 780 and 800 would be disappointing but at least gives hope.
3.  If the market breaks 780 we head down into the Abyss one more time.

Best Regards, Ian.

Copyright © 2007-2010 Ian Woodward
Disclaimer: Commentaries on this Blog are not to be construed as recommendations to buy or sell the market and/or specific securites. The consumer of the information is responsible for their own investment decisions.