Ian Woodward's Investing Blog

Archive for the ‘Market Analysis’ Category

Shot Across the Bow Coming Back!
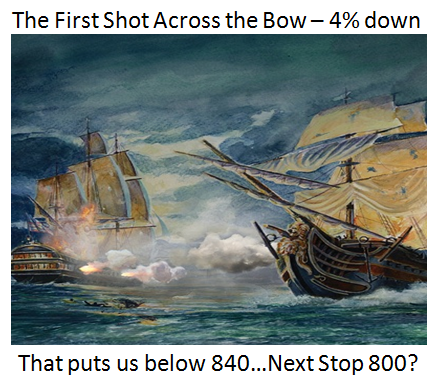
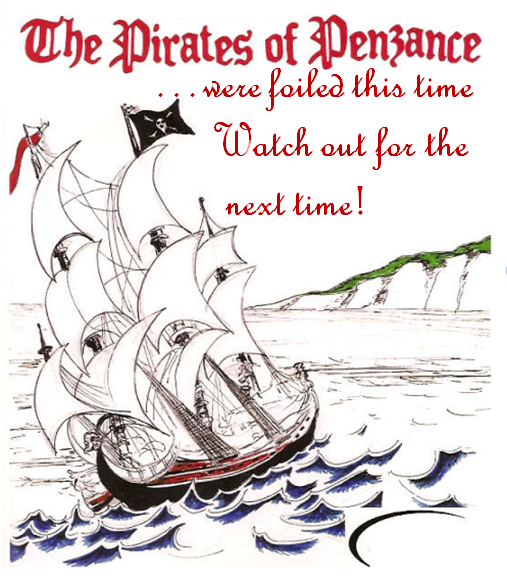
Tuesday, April 21st, 2009

The back and forth by the Bulls and Bears is certainly interesting.  Yesterday we had a 4% down day and today we bounced back over 2%.  So the Pirates of Penzance were foiled this time but they will be back soon.

saw

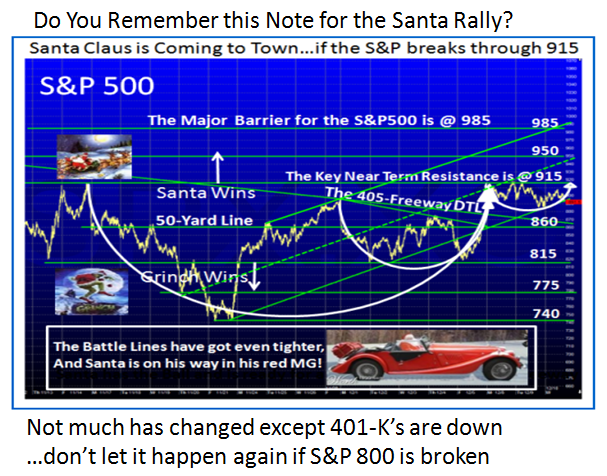
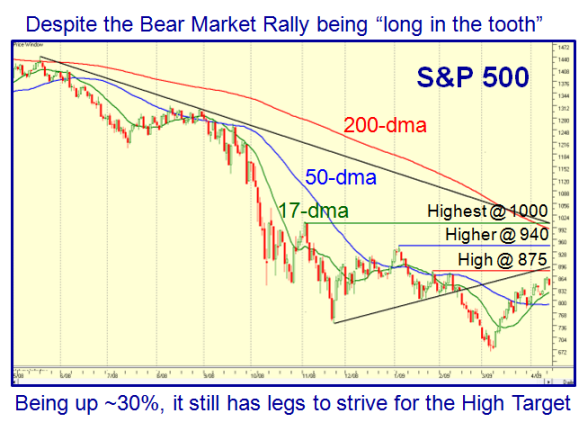
The reason I say that is that every technician has latched onto the rising wedge syndrome, a sure sign that the Market is overbought and over-reaching:

chart

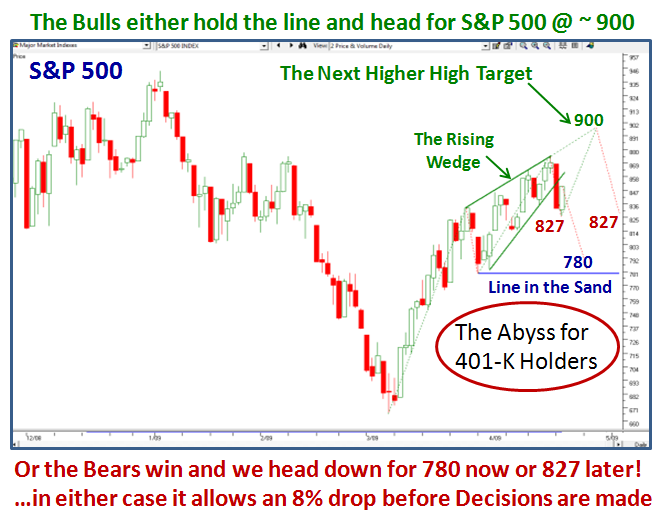
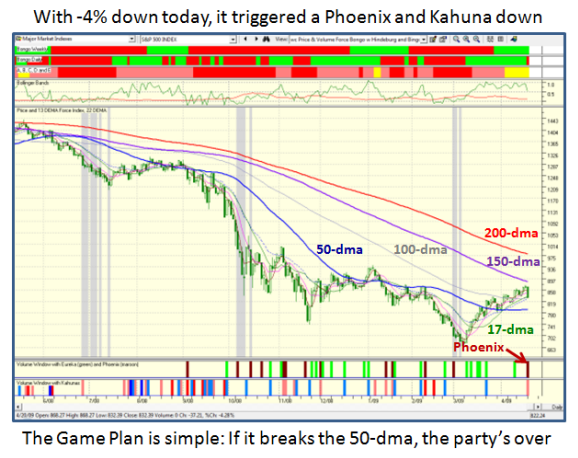
Now that we had an Eureka today to counter the Phoenix of yesterday, the Bulls are still in a tenuous control, and can resume their efforts to drive for the next logical step of 900. Alternatively, Bears come roaring back and break the trend by driving the S&P 500 to the last line in the sand at 780 before there is the likelihood of further capitulation and deterioration of the 401-K’s around the country.

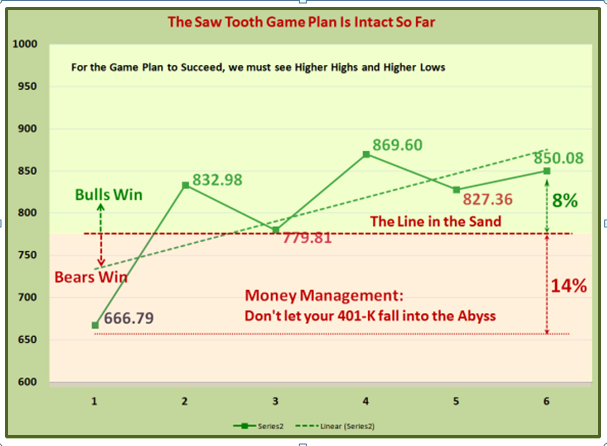
The cushion we now have on the downside is 8% and 14% to and from the Line in the Sand at 780 as shown below.  I cannot lay out the Game Plan any simpler:

Plan

What then is the Dark Cloud over the Market?  The Health of the S&P 500 Earnings Reports.
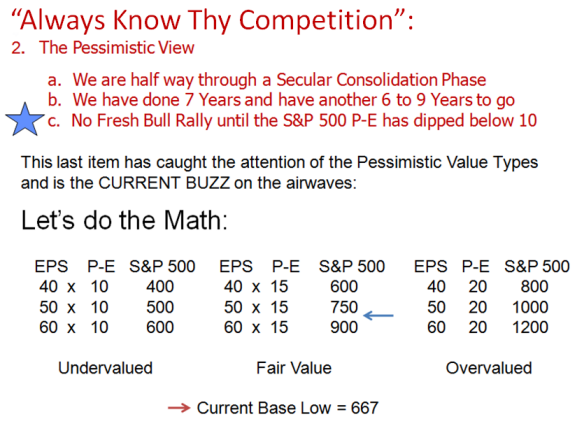
I laid the problem out at the Seminar and it doesn’t take any explanation.  The Pessimists
say we cannot support more than 400 to 600 on the S&P 500 – the gloom and doom scenario.
We may not get out of this problem for at least another two quarters.

competition

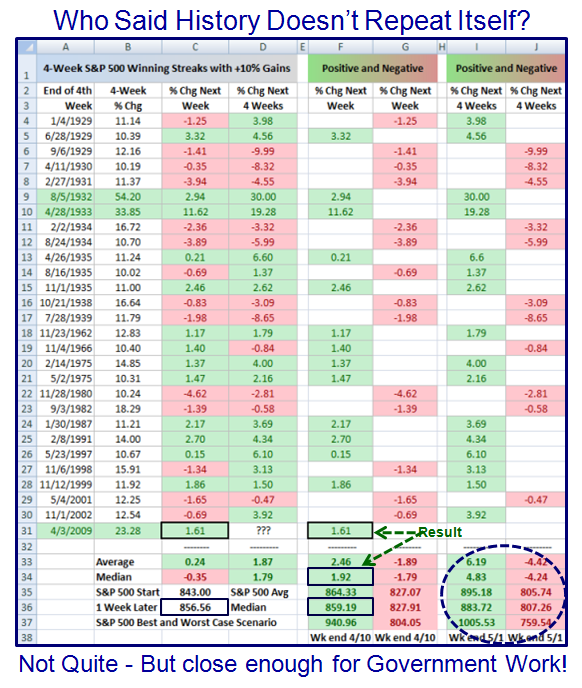
Meanwhile the 1937-38 Scenario is still intact for those who got the Woodward and Brown
Scenario, so keep your fingers crossed.

Best Regards, Ian.

The First Shot Across the Bow

Monday, April 20th, 2009

We have enjoyed a Bear Market Rally for 49 calendar days since the last big
down day when we had the last Phoenix signal, and we reached the High
Target of 875 as I suggested in my last couple of blog notes. As one would
expect with a -4% down day on the S&P 500, we had another Phoenix signal
today along with a small Kahuna.  This suggests that the Rally may be over
for now, but one down day does not establish a confirmed change in direction.

bow 

Unfortunately the S&P 500 broke 840 which was a critical line in the sand on
the way up, but as I have said in previous notes the cushion we have is 8%,
so we have used up half of the reserve we had to preserve the Game Plan
of Higher Highs and Higher Lows.  That will truly be broken when we reach
below 780, and those type 3 swing trader’s who nibbled should certainly have
taken some action to lighten up and preserve capital by then:

S&P

I’m sure most of you will recall a similar chart I provided four months ago
showing the critical lines in the sand.  The message is that we are back to
square one.  However, I am sure you will find that your 401-K is less now than
then, so this should be a lesson in Money Management that if we break 780
again, you are playing snakes and ladders with your hard earned money.

santa

All is not gloom and doom as yet…after all we have had only one bad day, and
the following chart gives you the perspective.  As you can see we show a
Phoenix and a Little Kahuna to the downside based on today’s action, and the
S&P 500 Index is sitting right at the 100-dma and 17-dma averages for support.

phoenix

If it breaks that support in follow through action, we head down for the 50-dma
blue line as shown on the chart.  The challenge for the Bulls is to stop the
bleeding and hopefully produce an Inverse head and shoulders pattern that
then gives a chance for another run up on the Bear Market Rally.  This week’s
action should unfold where we stand for the future health of this rally.

Best regards, Ian.

A Follow up to the Centipede Note

Thursday, April 16th, 2009

I know in this day and age, people are in a hurry and don’t remember to read the comments section at the bottom of each blog note.  Kevin (all the way from the Middle East) wrote a great reminder to me and although I have answered him there, I felt it important to put it here as well to ensure there is no misinterpretation or over optimism on my part in your minds.  In my hurry to not be redundant with the information in the Newsletter, I didn’t give full treatment to the downside scenario, so here it is:

Kevin Says:

Ian,

Thanks for the timely post. So you are not concerned about the volume falling off or the slope of the price line starting to flatten out? Of course, if I stare hard enough, I can see the 50 DMA has just turned up…, but we are a long way from penetrating the long-term DTL.

Hi Kevin:  Sure, we must always be concerned when a rally is a trifle long in the tooth, and it begins to curl over with volume drying up.  The Newsletter covered all the bases on three different scenarios, so I did not want to be redundant on the “if’s, and’s and but’s”.

But then again all great climbers must pause to refresh, so that a little droopiness is sometimes good before a rally gets a second wind.  Please also realize that last week was a short week with many taking a well deserved holiday in Hawaii or the Hamptons. 

Maybe I should have spent more time on the downside to give a balanced view on where my head is at.  I did that in the Newsletter.  So here it is:

The way to look at the situation is that any point higher than we are at now is gravy, and provides more assurance that we can withstand greater than an 8% correction the higher we go.  My sites are only on the “High Target” as I mentioned on the bottom of the chart, so that 875 only gets us to 31% up from the Base Low, which is hardly reaching for the fences as the other two targets suggest.  It is most unlikely that the DTL 405 Freeway Line which is the Highest Target of over 1000 will be reached on this round without a correction.  However, keep 940 and 1000 in mind for later challenges.

The more important point is what is the ultimate extent of the cushion on the way down, and can it portend to produce an INVERSE Head and Shoulders when all is said and done to set us up for the second true leg of the move back to recovery?  If this rally peters out today, the best we can hope for is to arrest the drop to 8% down to maintain an intact Saw Tooth Plan.

One last point in the scheme of things is the question of defining psychological barriers:

a. 800 on the S&P is #1. We need 875 to hold an 8% drop above that.
b. 8% down is #2, which is the 77% rule of all S&P 500 corrections.
c. 780 is #3 to hold the Saw Tooth alive and to give any hope of an Inverse Head and Shoulders set up for the future.  All the talking heads will be covering that point if and when it arrives.

After that, throw in the towel and run for the hills.

Best Regards, Ian.

This Bear Market Rally has Centipede Legs

Wednesday, April 15th, 2009

Despite the gloom and doom we experienced just 6 weeks ago, we have been able to crawl out of a hole slowly but surely to gain over 30% from the Base Low of 667 on the S&P 500.  This is indeed a comforting cushion should we go down in the ensuing correction which is expected to arrive soon if not sooner.   This Bear Market Rally has Centipede Legs as we hop along on our Pogo Sticks:

Centipede

1.  We are into 2nd qtr. Earnings Reporting, and that invariably dictates a sell off

2.  We are two weeks away from May, which suggests the adage “Go Away in May”

3.  We are in a six week rally and the best  is 8 weeks on the way down from the top

On the other hand all the palaver of the G20 summit is behind us and we experienced five straight weeks of S&P 500 gains, where I last showed you the statistics for  the first four weeks with over 23% up and 27 such occasions over the years since 1929.  Yes, of course it was somewhat with tongue in cheek, but we needed some positive news against all the gloom and doom around us, and as it happened it turned out to be favorable…who says that History doesn’t repeat itself?

Given that we then eked out a fifth week of gains, I might as well continue the theme and show you what Past History might suggest for the following three weeks.  Note that the chart below has its stake in the ground at four weeks and then showed the next week and four weeks later, so that we now have only three weeks more to go to meet the expected range of numbers I have circled in the chart below:

bear chart

Now to blend Theory with Practice, we should stare at the current Support and Resistance lines that most Technicians would lay on the current S&P 500 chart pattern.  I have long before now made the point that 840, 940 and 1000 were the important lines in the sand on the way up.  Since 840 is now behind us, I raised the bar to 875, 940 and 1000 as shown on the chart below:

S and P

As I am sure you will recall, all great rallies rise above the 17-dma, and  given that it has pierced up through the 50-dma, when they fail the fallback is to that level.  The Line where key decisions must be made is at 790 but certainly at 780 which was the bottom of the 1st leg of the Saw Tooth Plan.  Net-net, the Market  has played right into our hands and there are no excuses for type 3 swing traders who have been nibbling.   All these numbers are within the ballpark of the Past History Chart above!  Enjoy.

Best Regards, Ian.

Stock Market Up or Down Next Week?

Sunday, April 5th, 2009

After four weeks in a row with the stock market up, the question on our minds is what happens this coming week?

up

Fortunately I found some statistics that shed light on this question.  Sad to say that the odds based on past history is almost a toss of the coin, as seen by the chart below for those 27 previous occasions where the S&P 500 gained more than 10% in four weeks:

ss

However, we can dig deeper and get a flavor for the boundaries of the move based on
past History and it will be fun to see where we land on this next (fifth) week.

1.  Note that the only two occasions that the S&P gained more than the current 23.28%
over the 4-Week period was in 1932 and 1933 when they rose a humongous 54.20% and 33.85%, respectively.

2.  If you cast your beady eyes down column “C”, you will see there were 13 weeks up
and 14 weeks down…hence the odds of up to down based on history is almost a toss of
the coin or 48:52 to be precise.

3.  But what about the coming week is the big question?  I have separated the positive
and negative weeks into columns “F” and “I”.

4.  Here are the key statistics which I have ringed on the chart:

                                          S&P 500 Current    5th week +ve    5th week -ve
   �
Average S&P 500                     843                       864.33                  827.07

Average % up or down                                           2.53%                  -1.89%

Best & Worst Case S&P 500                                   940.96                  804.05

Best & Worst % up or down                                   11.62%                  -4.62%

The figures would suggest that we will do no worse than dropping to the 50-dma which
is at 790, and a fighting chance to reach the next rung on the ladder at 880 which I
mentioned as the high road scenario in my blog last night.   I have kept the numbers the same as the chart to make for easy reading rather than rounding up.

Best Regards, Ian.     �

Copyright © 2007-2010 Ian Woodward
Disclaimer: Commentaries on this Blog are not to be construed as recommendations to buy or sell the market and/or specific securites. The consumer of the information is responsible for their own investment decisions.