Ian Woodward's Investing Blog

Archive for the ‘Market Analysis’ Category

The Ultimate Stock Market Swan Dive – Four Colors!

Wednesday, October 15th, 2008

Ian, Now I know what a Swan Dive is. Black, White, Pink and Blue, they all went. Another big day, but no bottom. Is that the good news?  Can’t wait for the workshop.  Maynard

swans

Hi Maynard, the Newsletter which anticipated your question says it all, and also shows a beautiful chart of the last nine big corrections.  The bottom lines are:

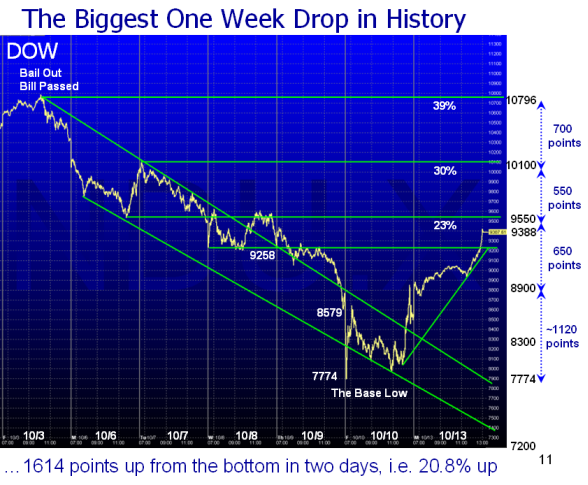
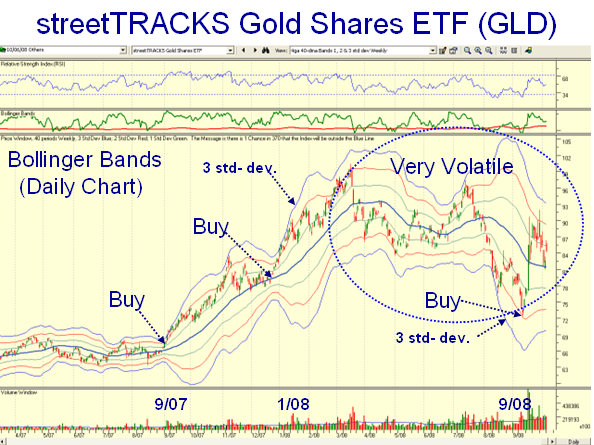
1.  The “mode’ has now changed to 500-700 points a day on the Dow, 50 to 100 on the S&P 500, and >80 on the Nasdaq as a normal event.  As you recall, we used to marvel at 150 point swings on the Dow just six months ago at the March Seminar.  There’s a measure of volatility for you!

2. The expected rise from the precipitous drop was >20% from bottom to top, and as we see it finished up at around 22% to 24% for each of the three indexes.  The expected re-test is likely to take us down to -17%, between friends, which suggests that should that occur we will not take out the current lows.  However, as I say in the newsletter, that is in the lap of the gods and all it takes is another Global financial negative surprise, hardening of the arteries on the credit scene and rotten EPS reports due out during these next three weeks to take us down below that level.  I am sure there are fifty-four other reasons, but you get the point.  In which case we will forget a double bottom formation of the usual nature and look to a head and shoulders (complex bottom) ala 2002 to 2003 timeframe.

3.  I am sad to say that the Limbo Bar (inverse high jump) has indeed reached the piths as I suggested might happen at the last Seminar and on the March 9 blog, and that is no surprise to us.

4.  Manu will be pleased with me as I have used his Rainbow Charts to show you the rope-a-dope trick which I hope you will enjoy to estimate the Golden Cross of the 50-dma up through the 200-dma, which I can tell you will not happen any time soon.

5. Those who are Type 4 Investors can bury themselves in their foxholes for several months as it is a trifle difficult to high jump Niagara Falls at this stage of the game.

6. Those who are Type 3 Investors need only draw 405-Freeway trend-lines to see that it is a long way to Tipperary.

7. Those who are Type 2 Day Traders must of necessity become Type 1’s

8. Type 1’s who are Moment Traders are having the most fun since they enjoy volatility, but even with tight stops it must be a trifle harrowing.

The Newsletter is up, and Ron and I are looking forward to seeing all of you and raring to go in ten days time. There will be a quiz on its contents so I hope the gang of five coming up from San Antonio will have it down pat from your tutelage by the time they get here.

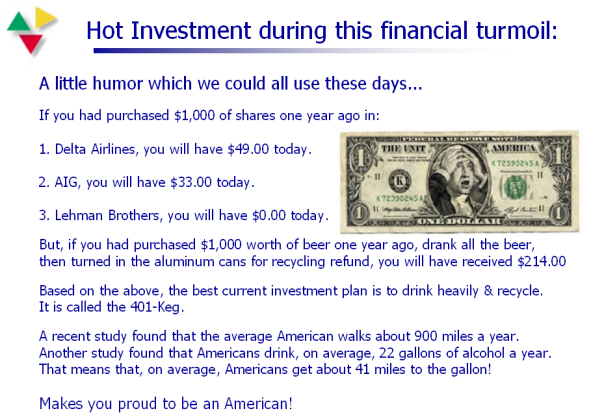
Would you believe I had over 22,000 hits on the 401-Keg Blog in one week, so that is a measure of the light-hearted relief in frustration in these bad times!

Best Regards, Ian.

The Stock Market Black and White Swans!

Monday, October 13th, 2008

The black swan theory refers to a large-impact, hard-to-predict, and rare event beyond the realm of normal expectations.  If that’s the case then we have also seen a similar rare event today…a white swan!

swans

I’m very busy getting ready for the seminar and also developing the Newsletter, but here are the historic events of the past week captured on one chart, below.  The Market action has emulated the 1987 movement so far:

chart

Best Regards, Ian.

Any Thoughts on Gold?

Tuesday, October 7th, 2008

Yesterday’s Blog was a winner with over 3000 hits for the Day!  One person who commented said he has started a Beer Collection, and another is asking me for any thoughts on Gold?

Here is a quick appraisal based on looking at the Gold ETF shown below.

gold

1. Gold had a great move a year ago for all of six months starting in September 0f 2007.  It was a controlled and tight move.

2. As one would expect, since the Market cratered it started to show erratic volatility, and unless you are a very short term trader, you can see it has become very risky.

3. Using 3 Standard Deviations on the Bollinger Bands as shown above (Blue Lines), you can see that it could have been a great buy a month ago, but note how it dropped about 10% in a matter of days, so it is very erratic. 

4. Since it just bounced off the middle Bollinger Band (heavier blue line), you should watch it for an entry around that area, but I warn you that you will need to watch it like a hawk.  From the gaps in the chart, it seems to me it is being used as a hedging instrument by those who are into short-term trading to protect their positions.  It would seem this is not the instrument you want if you are a long term buy-and-hold type who would prefer to see the ETF rise in the same fashion back in September 2007. 

I hope that helps.  Best Regards, Ian.

A Hot HGSI Investment Idea – the 401-Keg!

Monday, October 6th, 2008

I had planned to use this slide as my opening remarks for the Seminar in 2&1/2 week’s time, but after two days of utter chaos in the stock market, I felt a bit of levity would be in order rather than my writing a screed of where we stand.  Who knows…I may still use it?!

keg

To at least give you an idea of the market’s reaction to the European debacle today after their Markets followed suit since our decline after the Bailout Bill was passed, here is what transpired on the DOW:

In a sentence, it is called “Pick up the Pieces!”

dow

Enjoy!  Best regards, Ian.

Plop Plop, Fizz Fizz…Fizzle!

Friday, October 3rd, 2008

The much anticipated passing of the “Bailout Bill” came and went with what one would expect…buy the rumor and sell the news.

plop

Here is what transpired on the DOW prior to and after passing the Bill:

chart

If you are a History Buff, on the eight other occasions that the DOW dropped >7% in one day the overwhelming odds from seven of the eight readings is that the Market will be lower one week later.  That means that we should be below the 10365.45 of Last Monday the 29th of September come Monday’s close.

In a Bear Market, the rule at this stage of the game is to sell any rallies of 4 to 6%.  It is going to take a long while before confidence is restored and it goes without saying that the trend continues down.  Rumor has it that Helicopter Ben is considering a 50 basis point reduction in the rates, but the bigger questions now relate to whether the European Banks will join in a global joint reduction and if they are faced with similar bail out circumstances.  The proverbial Operatic Fat Lady is singing…now is not the time to be dredging leave alone bottom fishing.  Note how the “R” word is now freely bandied about, and who knows when they will turn to using the “D” for Depression word.  The Hindenburg Omen signals way back last November gave you plenty of warning.

There is little more to say than stay in your foxhole unless you are a Moment Trader…even Day Traders get taken to the cleaners in this highly volatile market.

Best Regards, Ian.

Copyright © 2007-2010 Ian Woodward
Disclaimer: Commentaries on this Blog are not to be construed as recommendations to buy or sell the market and/or specific securites. The consumer of the information is responsible for their own investment decisions.