Ian Woodward's Investing Blog

Archive for the ‘Market Analysis’ Category

The $64,000 Question – When will we find a Bottom?

Monday, November 19th, 2007

You can see that we still need three “Dotted Red Ovals to turn to Green”, before we have a chance of seeing a Bottom.  Note that I did not say “THE Bottom”.  However we are getting more and more into oversold territory and unless we have a major melt down due to some surprise news, we do not have far to go to find a bottom for a Bounce Play.  The one we had with a 300 point up day and a Eureka signal fizzled, so maybe once we get the stars to line up as shown by my friend Sherlock Holmes we will see a Bounce.

bottom

It requires three things to happen:

  1. We need the NYSE Index to break the 3 Std. Dev. Line convincingly as shown at the bottom.
  2. Simultaneously we must have RSI 14 Periods come down to 30 or lower.
  3. We need Capitulation where the New Lows for the day are around 1000 on the NYSE

At that point the Bongo drums should be beating out “Bingo”.  We shall see.  For those of you who have the HGSI Software and have downloaded the latest charts, make sure to go to Major Market Indexes, Select the NYSE Composite and the 4K 50-dma Bands 1, 2, 3 std. dev chart. Best Regards, Ian.  

P.S. Don’t all shout at once…I modified that view to include the %A/D.  The red oval at the top was an additional item to watch which is to see if the Limbo Bar comes down at least -5% from the 50-dma for good measure.


Is This the Year Without a Santa Claus?

Wednesday, November 14th, 2007

santa cartoon

Now we are cooking as I really appreciate inputs from my friends and supporters.  One good friend who lives in Dallas reminds me that these two characters sum up the Market really well right now…hot and cold!  Almost everyone who was a child in the US during the early-70s seems to remember that Christmas special on TV with Heat Miser and Snow Miser. Here’s a snapshot I showed you yesterday of three pictures I watch during the day among others, and it tells a sorry tale of a probable dead cat bounce.  With the CPI due tomorrow and Options Expiration on Friday who knows where we will end up for the week, but for sure they were rushing for the exits in the last half-hour and all the decent gains of the day turned to mush.

QT

The Nasdaq swooned for a loss of 1.1%, the volume was lower again today, and the FXP which is the Ultra Shorts on the Chinese stocks began to perk up towards the end of day, after starting with the bulls rubbing their hands at the open based on a strong Hang Seng performance last night.  The tasty morsels were where the action has been in the Silverback Gorillas, the Chinese Gorillas and the five horsemen we watch in AAPL, GOOG, GRMN, RIMM and BIDU.  However, by the end of the day, the first four were negative and only BIDU was up a paltry 0.75%. 

Another supporter which goes back quite a few years alerted me to get my beady eyes on the Up/Down Volume Ratio for the market indexes yesterday, which while decent, were not exactly convincing, and he is right.  But more importantly, he went on to say “We’ll have to monitor this along with price if the follow-thru day appears.”  If it is to happen then if and when we have that follow through day, remember to bring up the picture below and see if the Up/Down Volume is substantially better.  Although there is no question that the Adv Issues to Dec Issues were strong along with the accompanying volume, it helps to have many of you keeping watch on what might be significant clues and I appreciate the feedback.  Let’s take a look at that picture:Warehouse

 I made a snapshot of today’s Up/Down Volume and tacked it onto yesterday’s table at the end.  Today is lower than yesterday as we would expect from the volume picture above and the Large Cap Index is over 1.2 on both days…again confirming that the Gorillas is where the action is. What would we do without the slicing and dicing we can do with the HGSI Software? Thanks for the feedback David and keep up the good work.  Best Regards, Ian.

The $64 Question: How Big Will The Correction Be?

Saturday, November 10th, 2007

Correction

One thing we have put to bed is that when the Hindenburg Omen speaks, HGS Investors listen.  Hopefully most of you took cover and are sitting in your foxholes or else took advantage of the weakness in the Market Indexes and used leveraged Inverse ETF’s to give you maximum gains using the likes of the QID.  Those Indexes with the fattest profits took the worst shellacking and needless to say the Silverback Gorillas got hit hardest and gave up the most profits.  Now for sure you understand the game and how to play it…it is great fun hopping on extended stocks to make the biggest gains in the shortest time in buying the Rockets, but the higher they rise the harder they fall and I trust you were selling those great stocks before they turned to Rocks.  Buy Rockets and Sell Rocks! 

Now of course the $64 question is how big will the drop be, so we bring out our measuring rod and arrive at the targets for Low, Lower and Lowest?  Since I mentioned that Big Foot put in an appearance two days ago and then disappeared into the bushes when the market came roaring back in the last half hour, yesterday’s Market Close made sure to indicate that he had appeared again with a vengeance.  So we will use him for the Low Target, King Kong for the Lower and Godzilla for the Lowest…indicating a Bear Market!  A good friend suggested that would be a good way to keep it simple, so why not? 

The Measuring Rods:

Targets 

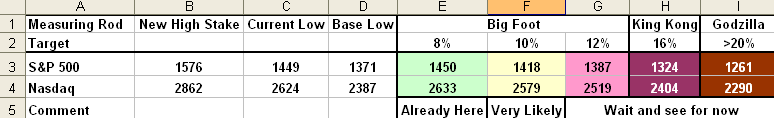
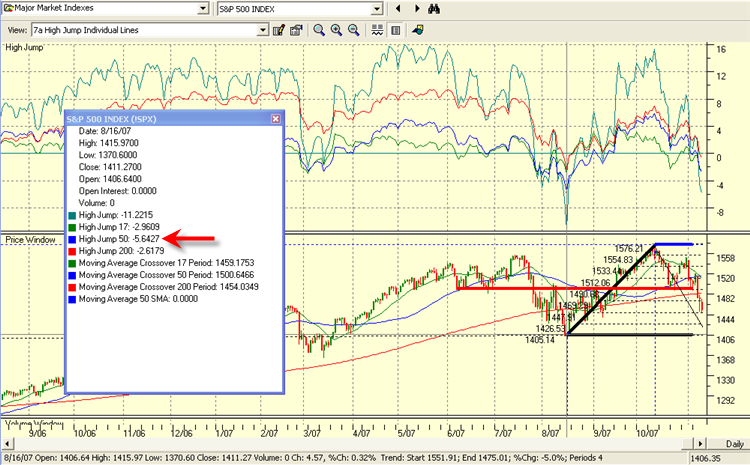
As we can see from the chart, we are already down ~8% from the High to Low on both Indexes, and do not have much further to go to chalk up 10%.  Given that we finished the day on Friday close to the lows, it would seem reasonable we will at least test the 10% level early next week if not on Monday.  It is always wise to have tests-of-reasonableness and the obvious measuring rod… (I love that term coined by another good friend…it reminds me of the guys with deep poles checking the snow level or the yard marker chains on the sidelines of the football pitch), …for doing this is the Limbo Bar, which is the inverse of the High Jump. The short answer is the numbers seem reasonable for now as shown below.  Anything lower, immediately will confirm we are in for a worse time than last August 16, so you will need to button down the hatches fairly tight if that happens:

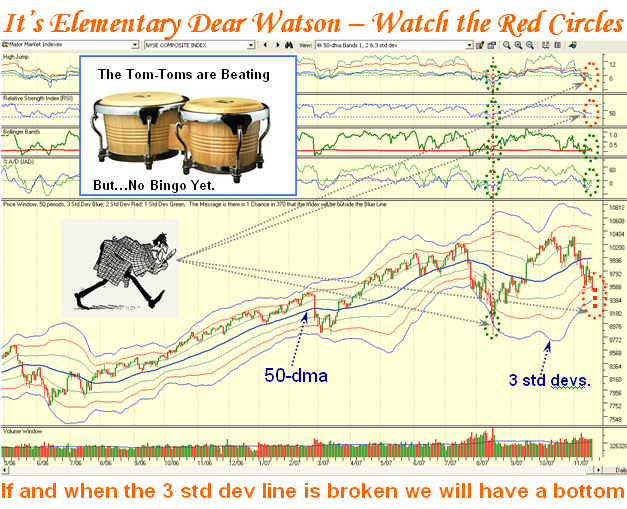
  1. S&P 500:  Last time the Limbo Bar for the 50-dma was -5.6427 and since the current 50-dma is at 1515.52, this suggests a target of 1430 for the S&P, slightly less than 10%.
  2. NASDAQ:  Last time on August 16, this went down -5.5434 for the 50-dma, and since the 50-dma is currently at 2717.98, we could get to 2567, slightly more than a 10% correction.

 High Jump Chart

 For completeness, we should look at the potential of a Bounce Play from an oversold situation, where we have had three hefty down days in a row and the quickest way to dispense with that target is to first see these two Indexes repair above their major resistance levels at either the 200, 50 and eventually the 17-dma.   So there you have it, Game Plan and Targets all set for Monday and now the scenarios are: 

  1. Stay in your foxholes until we get a “Bingo” followed by a Eureka signal
  2. Find items to short, but you must be super nimble
  3. Alternatively, look for Silverback Gorillas least hit for the upside scenario, should the market decide to give us a Bounce Play…don’t bottom fish now; it’s usually a waste of money. 

Let the market tell you which way to go.  It’s always “Your Call”.  Best Regards, Ian.

Caught Between a Rock and a Hard Place

Thursday, November 8th, 2007

rock

Helicopter Ben didn’t have any golden parachutes today for the Stock Market in his address to the Finance Committee and it was apparent he had no real solutions to the difficult alternatives he faces…hence he is caught between a rock and a hard place. If he continues to placate the Financial Community with more rate cuts, the lower the dollar goes, the higher the price of oil, the more the risk to inflation.  If he does nothing, the financial fiasco can continue to bubble and ultimately lead to a financial crisis.    Be that as it may, the Stock Market didn’t like what it was hearing and Big Foot came out of the bushes again today after that heavy 360 point down day in the DOW and another big wallop today until the bargain hunters came back in during the last hour. Big Foot disappeared in the bushes but is still lurking in the wings.   Anyone who was nimble had a field day today, but most conservative longer term buy and hold types were either sitting on the sidelines or already in their foxholes.   But you know all that and the $64 question is where next?  It’s not difficult:  For the first time, the big five have been hit, not enough to cause severe damage but enough to put a spanner in the works: 

  1. RIMM had an $18 spread and eventually gained back half the drop for a 6.15% loss.
  2. BIDU had a $52 drop and recovered $10 but finished with a 10% loss for the day.
  3. AAPL had a spread of $19, recovered$8 and finished with a 6% loss.
  4. GOOG dropped $57, recovered $14 and finished with about a 6% loss.
  5. GRMN had already been badly hit and is at least 24% off its highs so is a broken stock.

It goes without saying that the Leaders which are all in the NDX (Nasdaq 100) were hit with a -2.92% haircut today and the Nasdaq was little better with a 53 point drop and down 1.92%.  Surprisingly, the S&P 500 recovered to be essentially even and the NYSE and Russell 2000 were actually positive.   It’s far too early to say there is rotation until we see the follow through reaction tomorrow and being Friday we can expect that many traders will be looking to vacate their positions before the weekend. 

To rub salt in the wounds, the Chinese Silverbacks I gave you the other day have collectively given up 9.15% in a week!  On the rosy side, FSLR and JASO are flying high so the Solar Stocks are back in big business due to the blockbuster earnings report by the former.  Likewise, the Chemical Specialty Group was tight and held up well.  Net-net, I can’t make a silk purse out of a sow’s ear.  The prudent approach is to wait and see till the dust settles and sit on the sidelines, UNLESS you enjoy volatility and know how to use your trump card which is “Nimble”.  If you do, then sharpen your pencils for both sides of the coin, shorts and longs and you will do extremely well if you make the right calls quickly.  Late breaking news says there is now an Ultra Short Chinese ETF called FXP, which came out today.  You judge for yourself where the odds are right now with the picture below.  There is more to go on the downside before it gets to the OK Corral again.  Just watch the Red Line in the Sand. 

chart

Best Regards, Ian. 

Profit Taking or First Signs of Rotation?

Tuesday, October 30th, 2007

Rough Seas 

Many thanks from all of us the HGSI Team to all who attended the October Seminar for making it a “happening”, your strong contributions and interaction, your friendship and your support.  I had a lazy day today recuperating from the three day seminar, but happened to spy what may either be profit taking prior to the FOMC meeting tomorrow or the first signs of Rotation in the Leading Wolf Packs.  The pictures below for the Transportation- Shipping and Chemicals – Specialty Wolf Packs speak for themselves:

Indexes

Keep your powder dry and watch how the market behaves tomorrow after the FOMC Meeting Report which may either be a Trick or Treat for the Market.  The next Seminar will be held on March 29 to 31, 2008 so put it on your calendar and don’t let the grass grow under your feet in signing up as seating priority is “first come, first served”.

Best Regards, Ian.

Copyright © 2007-2010 Ian Woodward
Disclaimer: Commentaries on this Blog are not to be construed as recommendations to buy or sell the market and/or specific securites. The consumer of the information is responsible for their own investment decisions.