Ian Woodward's Investing Blog

Archive for September, 2007

The High Jump – The Most Trusted Tool I Invented

Sunday, September 9th, 2007

High Jump 


At a recent seminar I was pleasantly surprised to find that many in the audience make use of the Ian High Jump Indicator I have developed to establish when a stock is extended and due for a correction. There are three elements that will guide you to understanding when a stock is fully valued, relating to the % distance of the stock’s price from its 17 Day, 50 Day and 200 Day Moving Average. Just as the fundamentalist is concerned when a stock is overvalued and generally applies the yardstick of P-E to establish this, we can also use Technical Analysis to arrive at the same conclusion. The concept is very simple, and can certainly be a good guide for extended stocks.

Those who are lazy and/or do not have time need to remember only one rule of thumb.  Fund Managers will invariably take profits when the stock has made 100% above its 200-dma.  In other words they feel the stock is extended, and rather than be greedy, they lighten up and take profits.   


I see my good friend Manu Kapadia’s son Vince is contributing to the highgrowthstock.com bulletin board.  Now he is a chip off the old block, and has no fear, but is a young tiger.  Yet he has learned the tricks of the trade and is super nimble.  He has just contributed to conversations on the bb on two hot stocks, DRYS and EXM.  So let’s cut to the chase and review the bidding:


 High Jump #2

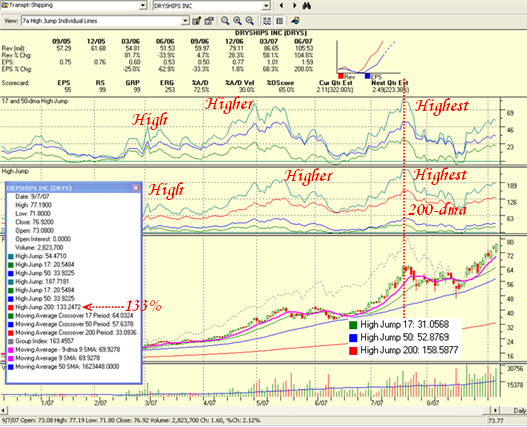
I show the High Jump at 133% up from its 200-dma, so we know it is in Rust Territory already, just like that rusty old car I show in the picture. 

The chart of DRYS above shows the High, Higher and Highest Jumps that it has made.  One can immediately see that the stock is currently at between the higher and highest level for the 17-dma + 50-dma on the upper window and at the Higher level on the middle window.  I show the High Jump percentages when it reached its highest level, and we see the highest was at 159% for the 200-dma so theoretically it has room to go another 26% on the High Jump.  Since the 200-dma is currently at $33 that means it could go to $85.47.  If we do the same arithmetic we get: 

  1. 17-dma   $64.0 x 1.31 = $83.84
  2. 50-dma   $57.6 x 1.53 = $88.13
  3. 200-dma $33.0 x 2.59 = $85.47 

It closed at $76.92, so there is a potential for another 15% up if it can reach over $88.  As Vince notes, the stock had a strong up day when the market sold off, so there is major upward drive. 

Late Breaking News on Sept 7: Analysts at Cantor Fitzgerald reiterate their “buy” rating on DryShips Inc (ticker: DRYS), while raising their estimates for the company. The target price has been raised from $71 to $94.  But the real reason for all the excitement is the EPS estimates for FY07 and FY08 have been raised from $7.28 to $7.75 and from $7.50 to $10.81, respectively. 

So with the stock the leader in the strongest group of all at this moment, there is a chance it can beat its previous highest jump and head for $94.  However with the market this skittish, realize that traders like Vince are prone to take their winnings and scarper…leave the scene of the crime in a hurry.  It only takes a couple of down days to take all the steam out of these high fliers.

The Message is with High Fliers like this, don’t sit there waiting to be taken out with a stop loss, but sell into the high and go.  Don’t get me wrong, you need to have a stop to protect yourself, but unless you can play with the mentality of a day trader who understands when the stock has peaked for the day, you will get stopped out at the low every time.  Likewise, you can’t afford not to get back in, because these trains leave the station fast.  The basic premise is you must understand that the stock is already very extended and you are playing on the steepest part of its ascent and therefore the most rewarding in the shortest time but with the highest risk.    

Best Regards, Ian.

Get Off My Back…Will You?

Saturday, September 8th, 2007


Blog Get Off My Back #1

Alan Greenspan made headlines again yesterday with his comparison of the current period to 1987 and 1998.  This has come when for the first time in four years the non-farm payrolls printed a negative number.  The occurrence of a negative print does not necessarily mean a recession is imminent, but the change in non-farm payrolls does turn negative leading up to a recession.  So, naturally the dreaded “R” word is on the airwaves yet again. This time for good reason as the measurement of reality to estimate is so far off base that “jobs” can now be added to the list of turmoil, especially as the two previous month’s were also taken down sharply.   

It is not amazing how the psychology of the Market has changed so rapidly from the FOMC will reduce Interest Rates at their next meeting to it must do so and should have done it sooner. Now the clamor is for 50 basis points instead of 25.  Our Grand Old Duke of York, aka BB, is now caught between a rock and a hard place.    

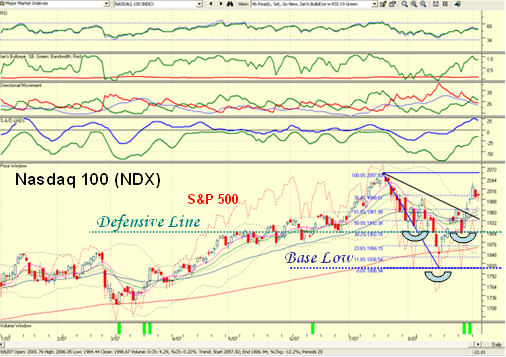
It goes without saying that it is now the Bears’ turn to have some fun, as we head down to test recent support.  Fortunately, we have had a recent short-term reverse Head and Shoulders pattern in all of the Indexes on the Bounce Play.  With the defensive team now out on the field, one can raise the bar, i.e., lines in the sand, to the right shoulder level to know if it will hold or we head back down lower to the previous Base Low area.  So remember that trick for the future.  When the markets have taken a beating, a reverse Head and Shoulders that is already imprinted gives better support than waiting for a double bottom that has yet to come. 

My colleague, Ron Brown, did a great job this morning focusing on the Market Internals.  When one has an unusual distribution day, especially at the top of a Bounce Play, take heed of what he has shown us as one gets a lot more information than just looking at the Index charts alone.     

The Case for the Bears

  1. Their swan song is a recession is inevitable, with chinks showing in Housing, Sub-Prime lending and mortgages in general, Carry Trade with a strong Yen and a weak Dollar, a disastrous jobs report, and lack of consumer spending. 
  2. A recession does not have to mean a Bear Market or vice versa, but if there is no super glue to put Humpty together again, then the bears rule the roost.  They will play cautiously, as once bitten twice shy with what happened two Fridays ago, when the Grand Old Duke of York, aka BB, dropped a bombshell on them and said “Charge”. 
  3. Gloom and doom talk by the media on the market usually is self-fulfilling and people like you and I just trot off to cash and wait for sunnier times.  Even those who are good short artists are confounded, but if you have learned the tricks of the trade with the likes of the QID, and other double your money bets on the various Indexes, you can enjoy this volatility.  There are two pre-requisites, very nimble and glued to your screen, but after a bit even that gets a trifle stale. 

The Case for the Bulls 

  1. Only one or two points from what I can see at this time, Uncle Ben with Super Glue, and he can’t fiddle around.  Since he is cautious, and he has vowed he will not act to just save the markets, but that there must be some bona fide case regarding liquidity for the Banks and/or sluggish signs in the Economy.  Don’t expect a Greenspan slash, dash, slash action from him.  In addition, any precipitous slash would be looked upon with suspicion as pandering to the media. 
  2. The second point is the injection from the Fed a couple of weeks ago did at least produce a decent bounce play, so there is breathing room to the downside before the Bulls get too morose, and completely throw in the towel.  After all we now have a yo-yo market and at the drop of a hat this beast can turn around and produce another 200 point up day.  There are enough players who recognize the decent earnings reports and that is exemplified by the types of stocks we normally are attracted to, i.e, strong growth stocks with stellar earnings reports. The NASDAQ 100 (NDX) is leading the way which says that technology is the place to be. It has been aptly demonstrated 10% in a week or less is still a good bet for the day or swing trader with these types of stocks with Relative Strength (RS) >95 right now.

The Game Plan for Next Week

Get Off My back #2

  1.  You can see what I mean about having Head and Shoulders Patterns when playing Defense. 
  2. I have used the NDX as a learning lesson…it is the strongest case for the Bulls.  There are several lines of defense the chart shows:
  • a. Just look at the strong breakout above the black line which is the 405 Freeway, on the way up
  • b. Note how it retraced all the way back to the 76.4% Fibonacci line.  That’s a strong bounce
  • c. Also note that the 4-dma, 9-dma and 17-dma all fanned up through the 50-dma…shows strength
  • d. The first line of defense is when it tries to hold at the 405 Freeway at around 1932
  • e. The next line in the sand is at the bottom of the right shoulder which is at 1899
  • f. The third line in the sand is the 200-dma at 1862
  • g. The final line in the sand is the recent Temporary Base Low of 1806 

   3. The gap down at the open on the NASDAQ Indexes is significant, and it essentially left the NDX with an Island Gap…between friends.  In this case the Bulls were caught napping with euphoria so to speak.  It is unusual for me to not concentrate on either the NASDAQ or the S&P 500, but a tip to you is to always seek out the strongest market index on a bounce play as that index will probably give more clues as to whether the rally will continue or seize up and die.  So my advice is to watch the behavior of the NDX over the short term, and I have identified the various lines of support so that we can get a feel for whether the new leaders in Technology continue to show resilience or were just a flash in the pan.          

   4. At this very instant, the one stock which should give us the biggest clue is Apple (APPL), since it recently announced price cuts and its behavior in the short term should be useful.       

   5. I’m sure you get the picture that there is a lot of room for the Bulls to play defense.  Given that the NDX is the strongest of the Indexes, if this is broken then there will be major damage and we are in for a bad correction. With the big gap down on Friday, the Index is already down to 1950, a 2% drop.  It has to snap back and close that gap quickly for the Bulls to have any re-assurance that there is still support to drive the market higher. Net-net, out of all that turmoil, the one simple item to watch in next week’s game plan is will the gap be closed on the NDX or will the problems around us take that index down through those support lines like a hot knife cuts through butter.  Let’s see how it plays out.   

Best Regards, Ian

Happy Birthday to Me!

Thursday, September 6th, 2007

Happy Birthday 

Many thanks to all my well-wishers for my Birthday.  The Market is Marking Time, so I am going to enjoy today with my family, and I wish Many Happy Un-Birthdays to all of you, and may all your stocks be winners!   

Best regards, Ian.

The Gladiators in a Frustrating Yo-Yo Market

Wednesday, September 5th, 2007

The Gladiators 

The only Gladiator who can master this market is the yo-yo player who can play either side of the market with equal ease.  We thought the Volatility was bad back in May through July of 2006. That was kid stuff compared to what we have now.  Quick be nimble and nimble be quick.  There is one strategy that is working and that is taking a leaf out of Dave Steckler’s book to grab profits when you make 10% or more in a stock in a week; otherwise they are going to get you!  However, there are a few rays of sunshine in all of this turmoil the markets are in: 

  1. The Bounce Play confirmed a lot, not that we didn’t know most of it but it cemented a few points.  The Nasdaq Big Cap (NDX), i.e. Technology is the place to be and is strong.
  2. Sure, they hit it today, but that was due to news that both Apple and Microsoft were lowering prices on their products. 
  3. The Bounce Play was tolerably good and at least we have a cushion now with which to make swift decisions should there be more on the downside. 
  4. The Reverse Head and Shoulders I showed you while Fly Specking on the “Hair Raising Experience” Blog notes now sets a higher level for the downside lines in the sand.
  5. The Game Plan Index of 18 stocks seems to be a major winner, which when taken to the general case says quite a lot.  It is so good that I will feature it in this month’s Newsletter.  It says that Growth Stocks in Capital Goods, Technology, Telecommunications, Health Care, Materials and a smattering of Consumer Goods, Consumer Services and Energy are the places to be.
  6. The sad part about this is the strong stocks are in the very HGS Investor pedigree which we have come to know and love.  Although the predominance is in High Growth Technology, there is something for every Investor Style within the 40+ stocks that are prime rib.  I say sad because one is reluctant to tip toe in at this terrible time, yet my eyes tell me that the Index is trotting off north into the sunset.
  7. If it is of any interest, rounding up many of the usual suspects which are strong with some even waving us good bye as they head north into the sunset include:  SILC; AKS; VDSI; CALM; WCRX; NUAN; PRFT; ICFI; TRAK; NUVA; SYNA; CRNT; MR; OMCL; FTK, BPHX, ICOC, CEDC. 

Best Regards, Ian.

The Critical Fork in the Road for the Stock Market

Monday, September 3rd, 2007

two roads

On this Labor Day, I am reminded of one of America’s greatest Poets, Robert Frost and his challenging Poem of the Road Not Taken.  The Market is faced with the same challenge during the next two weeks and we wait with much anticipation as to how it will unfold. 

In these past few weeks the pundits have covered the gamut from total gloom and doom of crash proportions ala 1929 and 1987, to this recent correction was little more than a storm in a teacup and now that we have had a decent correction we are up, up and away again.  Make no mistake about it this Market will be news driven in the next two weeks.  By way of that news and the current standing of the Market Indexes we have the potential of the perfect storm of events occurring all around the same time: 

  1. The FOMC will have returned from Jackson Hole,Wyoming all primed to act depending on the next fracas in the financial markets.
  2. General David Patreaus is due back on Capitol Hill with his report on Iraq and that may cause a flurry of discussion in Congress and stir up the pot in affecting the Markets.
  3. The Market Indexes have done their Bounce Routine and are poised to take either the high road or the low road to Loch Lomond, as the song goes. Bulls and Bears are at a stand off at the OK Corral, as we now enter September, historically the weakest month of the year. The S&P 500 has been up these past three years. So the stage is set for what we will look back on as a couple of weeks in Stock Market History. Let’s first summarize what we gleaned from the three mini-stakes in the ground and then we will step back and look at the macro picture.

Mini-Stakes in the Ground: 
  1. Leaders in leading Industry Groups is where the action is, with Technology, Telecom and Health Care leading the way along with Box #7 stocks with strong Fundamentals.  The StockPicker group performance shows Growth is preferred over Value at this time. 
  2. Wolf Packs as exemplified by Chemical – Specialty are also working according to form, and are poised for a breakout. 
  3. The Game Plan Index has demonstrated strength and has produced a cup with handle formation and is also poised to move.  It doesn’t have to be this Index, any strong index based on our HGS Principles will do the same thing for you, but the point I have made before is that this little bag of tricks has stood me in good stead for ages, ever since I introduced it 15 years ago. The bottom line for the mini-stakes is the Bulls have recovered and are set to head on back up. 

Major Stakes in the Ground:   

Frankly, all three of the items being so positive makes up for my disappointment that the Market Indexes have not snapped back more than 10% and above their 50-dma.  I am prepared to make an allowance for the seasonal low volume compensated by two Eureka signals.  

I expect that tomorrow will be a settling back day and not much will happen, but we should all be back from vacation and back to school with the old routine starting on Wednesday when the real clues will emerge.   

One item of Fly Specking that did not sit well with me was the unusually high sell off in the last 15 minutes on Friday.  Granted it was a three day weekend ahead and people were unwinding their positions, but I was licking my chops just prior to that and expecting the Indexes to finish very strong compared to the targets.  They finished flat. Other summary points from past blogs: 

  1. Trading in moments is where it is at right now; take your trades off before the end of the day! 
  2. The Reverse Head and Shoulders pattern makes the call easier on the downside
  3. The Gunfight at the OK Corral is won or lost by the FOMC’s action or inaction.  

    One of the good things in life is that we learn from each other.  Robert Minkowski, my good friend has turned up trumps on his work relating to Confirmation Days and Market Timing.  Having set targets and taken measurements for all of a month, it is now a good time to reset and fine-tune those targets going into tomorrow.  Riding piggy-back on Robert’s work, here is what I see for targets to the upside for a decent bounce assuring less odds of breaking the downside. I have added the S&P 500 to the list (with an eyeball):

Index Criteria                                Low     Target    Actual     % Up fr Low   Up to Target   

·     The S&P 500 > the 50-dma         1371      1500       1474            9.4%              26 pts (2 days) 

·     The Nasdaq 100 back to             1806      2002       1989           10.9%              13 (1 day)  

·     The NASDAQ back to                 2387      2655       2596           11.2%              59 (2 days)   

·     The !VAY                                   2153      2351       2327            9.2%               24 (1 day)             

What the above tells me for the future is that a good rule of thumb is 10 to 11% for the Indexes to repair from their Base Low, so tuck that yardstick away for future use.  Note that it won’t take much to achieve these targets…it is measured in a couple of good up days.  As I see it right now, the only item that can really upset the apple cart is more negative news on the financial banking front and all the accompanying baggage we have discussed ad nauseum; Also a global surprise of either a Political or Market nature, and those two come with the territory. 

Be careful which Road you take in the Yellow Wood.  Best regards, Ian.

Copyright © 2007-2010 Ian Woodward
Disclaimer: Commentaries on this Blog are not to be construed as recommendations to buy or sell the market and/or specific securites. The consumer of the information is responsible for their own investment decisions.